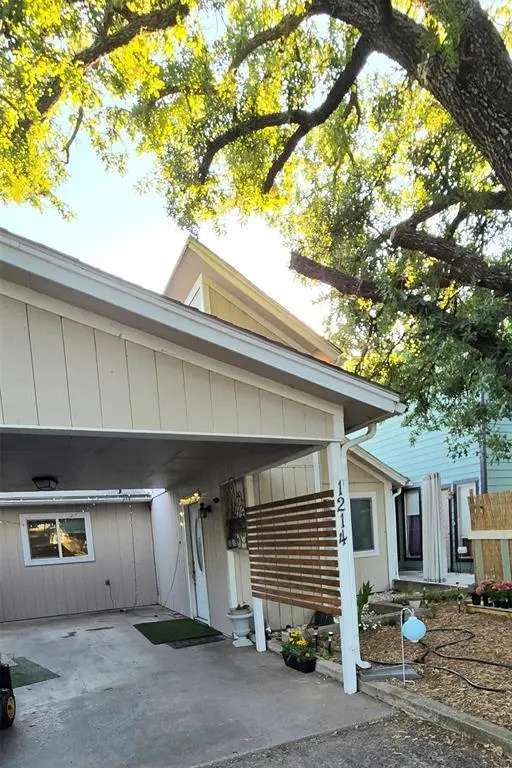
1214 Elm Ct · Runaway Bay, TX
Flood risk 1/10 · Minimal
- FEMA flood zone
- X (unshaded)
- Chance of flooding over 30 yrs
- 0.0%
- Est. flood insurance / yr
- $507 – $1,088
Fire risk 7/10 · Major
- Est. fire insurance / yr
- $1,222 – $2,270
Heat risk 7/10 · Major
- Hot days now (above 111°F)
- 7 days/yr
- Hot days in 30 yrs
- 21 days/yr
Wind risk 4/10 · Minor
- Chance of severe wind over 30 yrs
- 17.0%
Air-quality risk 1/10 · Minimal
- Unhealthy air days now
- 0 days/yr
- Unhealthy air days in 30 yrs
- 0 days/yr
Risk factors via First Street. Map © Google.
Why this score? — see what drove the B- grade
The composite is a weighted blend of 9 inputs, each scored 0–100. Each bar is that input's sub-score; the figure is the points it added to the 100-point composite (weight × sub-score).
- Cash flow +25.8/30.0
- DSCR +8.6/10.0
- ARV discount +7.5/15.0
- 1% rule +6.7/10.0
- Appreciation +4.6/10.0
- Schools +3.6/10.0
- Livability +3.4/5.0
- Rent growth +2.5/5.0
- Condition / age +2.5/5.0
$150,000
🖨 Deal sheet 📄 Offer letter ✓ Due diligence
Listing remarks MLS
Updated patio home near the lake at Runaway Bay. Updated doors, windows, paint, floor covering, vanities, kitchen cabinets have been refaced and new doors.
Key facts
- Patio home
- Updated windows
- Updated paint
Tags
Property features AI
Finance
- Other: Property type: Residential — Single Family Residence; Parcel/lot information available (less than 0.5 acre lot)
- Financial info: Listing accepts Cash, Conventional, FHA, and VA financing
- HOA & community: No association (no HOA)
Exterior
- Parking: Covered driveway parking; 2 covered/carport spaces
- Security: Smoke detectors installed
- Utilities: City water; City sewer; Electricity connected; Not in a municipal utility district
- Home design: Single-family residence; Built in 1970; One story; Not attached to other units; Subdivision: Runaway Bay
- Construction: Composition roof; Slab foundation
- Exterior features: Covered front porch; Rear porch; Patio; Covered patio/porch
Interior
- Kitchen: Dishwasher; Disposal; Electric oven; Electric range; Eat-in kitchen
- Bedrooms: Primary bedroom on main level with ensuite bath, dual sinks, and walk-in closet; Two additional bedrooms on main level
- Flooring: Laminate flooring
- Bathrooms: Two full bathrooms
- Heating & cooling: Central heating (electric); Central air; Ceiling fans
- Interior features: Decorative lighting; Eat-in kitchen; Open floorplan; Vaulted ceilings; Walk-in closets; 4 rooms total; One-level layout; One living area; One dining area
- Laundry & utility: Full-size washer/dryer area; Washer hookup; Electric dryer hookup
Neighborhood map
What this means for you Summary
Snapshot
- This is a 3-bed/2.0-bath single-family listed at $150k.
Deal economics
- At list price, monthly cash flow is $365 ($4k/yr) — positive.
- The deal already cash-flows at list — no discount required.
- Meets the 1% rule at list price ($2k rent vs $150k).
- Recommended offer: $146k (3.0% below list) — sets the bar for market timing.
- Cap rate 9.2% vs local median 2.9% in Runaway Bay — top-decile yield for the area; either an underpriced asset or a hidden risk that comps aren't pricing in. Stress-test before assuming the spread holds.
Location & tenants
- Location reads 68/100 on livability (#491 in TX) — a middle-class / working-renter tenant base. Strengths: crime A+, cost of living A+, housing A+; Watch: health & safety D+, amenities F, commute F.
- Bridgeport ISD (rural): math 41% / reading 41% proficiency, ranked #356 of 826 in TX (top 43%) — families likely to look elsewhere, expect single-tenant / working-renter base with shorter leases.
- Zoned schools: Bridgeport El (523 students, 70% FRL) — zoned schools average 70% FRL vs 50% district-wide (20 pts higher); higher-poverty schools than district average — tighter screening recommended.
- Market conditions: 338 active listings in the ZIP; 3 comparable units currently listed for rent nearby; rentals leasing fast (median 6d on market — plan ~1-2 weeks tenant-placement turnaround); solid renter incomes; 460 units permitted in Wise County in 2024 (243 in 5+ unit buildings).
Forward outlook
- Local home prices are declining (-0.8%/yr); year-one equity from $1k of loan paydown is wiped out by about $1k of value loss. Plan a longer hold.
- Wise County population projected at +27% by 2050 — long-run rental-demand tailwind backs the buy-and-hold thesis.
- At projected returns (-0.8% appreciation + 3.0% rent growth), your $42k cash investment doubles in ~8 years — after that, you're playing with house money.
Negotiation context
- It's been on market 36 days — a 3% lower offer ($146k) is reasonable based on typical stale-listing flexibility.
- 6 sale attempts since 7y ago with the ask held roughly flat each time — persistent listings suggest the price (not the market) is what's stuck; bring a comps-based counter.
Risks & watch-outs
- Climate carrying-cost: major wildfire risk; extreme-heat days projected 7→21/yr by 2055 (HVAC capex compounding) — expect insurance premiums to compound above CPI over the hold.
Questions for the listing agent
- It's been on market 36 days. Have you received any prior offers? Is the seller open to a 3% concession, seller financing, or rate buy-down credit?
- Built in 1970 — when were the roof, HVAC, electrical panel, plumbing, and water heater last replaced?
- Is there a deadline driving the sale (1031 exchange, divorce, estate, relocation)? That informs how much negotiation room exists.
- Schools are D-rated, which usually means shorter tenancies and higher turnover. Who's the typical renter profile here, and what's been the actual vacancy rate?
- What's the average days-on-market for RENTAL listings here right now (not sales)? A rising rental-DOM trend means longer vacancies and softer asking-rent achievability than the comps imply.
- What's the recent tenant-quality profile in this submarket — average credit score on applications, eviction rate, late-payment / NSF rate, and stable-employment percentage? A property-management company in the area should have these aggregated.
- How much new for-sale + rental construction is in the pipeline within 1–3 miles? Heavy new supply typically softens prices + rents 12–24 months out; constrained supply supports both.
Investment metrics
- 1% rule
- 1.17% ✓
- Cap rate
- 9.21%
- Cash-on-cash
- 10.42%
- DSCR
- 1.46
- GRM
- 7.1
CMA / ARV
- ARV (median comp)
- $304,943
- List price
- $150,000
- Delta
- -50.81%
- Verdict
- UNDERPRICED
- Comps
- 20 within 1.0 mi
Show comp detail 12 sales within ~0.75 mi
| Address | Dist | Beds/Ba | Sqft | Sold | Price | $/sf | Match |
|---|---|---|---|---|---|---|---|
| 813 Haynie Dr | 0.08mi | 3/2.0 | 1,560 (+11%) | 3mo | $289,900 | $186 | 75 |
| 184 Cactus Canyon Dr | 0.67mi | 3/2.0 | 1,430 (+2%) | 2mo | $264,900 | $185 | 64 |
| 111 Jim Walters Dr | 0.20mi | 3/2.0 | 1,603 (+14%) | 12mo | $295,000 | $184 | 57 |
| 171 Cactus Canyon Dr | 0.62mi | 3/2.0 | 1,430 (+2%) | 14mo | $250,000 | $175 | 56 |
| 115 Jim Walters Dr | 0.22mi | 3/2.0 | 1,591 (+13%) | 17mo | $299,900 | $188 | 54 |
| 217 Shady Oaks Dr | 0.52mi | 3/2.0 | 1,591 (+13%) | 1mo | $269,000 | $169 | 53 |
| 167 Cactus Canyon Dr | 0.62mi | 3/2.0 | 1,430 (+2%) | 18mo | $269,000 | $188 | 53 |
| 503 Runaway Bay Dr | 0.57mi | 3/2.0 | 1,604 (+14%) | 3mo | $289,900 | $181 | 47 |
| 416 Half Moon Way | 0.58mi | 3/2.0 | 1,585 (+13%) | 10mo | $224,900 | $142 | 43 |
| 188 Cactus Canyon Dr | 0.66mi | 3/2.0 | 1,263 (-10%) | 14mo | $244,650 | $194 | 41 |
| 137 Cimmarron Trl | 0.42mi | 2/1.5 (-1) | 1,530 (+9%) | 21mo | $299,900 | $196 | 40 |
| 401 Koppes Ct | 0.59mi | 4/2.0 (+1) | 1,613 (+15%) | 22mo | $219,999 | $136 | 25 |
Match score weights: distance 35% · size 25% · config 20% · recency 20%. Top-matched comps best support the ARV.
Projected returns pro-forma
-0.82% appreciation · 3.0% rent growth · sell at horizon
- IRR
- 6.9%
- Equity multiple
- 1.31×
- Total profit
- $13,179
- Equity at exit
- $37,505
- IRR
- 13.0%
- Equity multiple
- 2.31×
- Total profit
- $54,963
- Equity at exit
- $40,500
Cash invested: $42,000 (down + closing). Projections, not guarantees.
Landlord ↔ Tenant lean methodology
- Overall (STATE)
- 87 Strongly Landlord-Friendly
- State Texas
- 87 Strongly Landlord-Friendly · R+5
- County
- — inherits STATE
- City
- — inherits STATE
ZIP-level market 76426
- Home prices YoY
- -0.2%
- Active inventory
- 338
- Price-to-rent
- 7.1×
Monthly cashflow live
- Estimated rent
- $1,762 medium interval (Pro) →
- Mortgage (P&I)
- −$787
- Tax from tax record
- −$178 /mo · $2,135/yr
- Insurance
- −$62
- HOA
- −$0
- Vacancy / Maint / Mgmt
- −$370
- Net cashflow
- $365
Break-even live
UW: 25.0% down · 7.5% · 30yr · 1.5% tax · 5.0% vac · 8.0% maint · 8.0% mgmt
Financing live
Cash to close
- Down payment
- $37,500
- Closing costs
- $4,500
- Reserves months
- —
- Total cash needed
- —
Loan-product check · same deal, 3 products live
Conventional
25% down · 7.5% · 30yr
- Down + closing
- —
- Monthly P&I
- —
- Monthly cashflow
- —
- DSCR
- —
- Eligible?
- —
Personal DTI + credit; lowest rate.
DSCR
20% down · 8.5% · 30yr
- Down + closing
- —
- Monthly P&I
- —
- Monthly cashflow
- —
- DSCR
- —
- Eligible?
- —
No personal income docs; deal must DSCR.
Hard money
10% down · 12.0% · 12mo
- Down + closing
- —
- Monthly P&I
- —
- Monthly cashflow
- —
- DSCR
- —
- Eligible?
- —
Short-term bridge; refi at stabilization.
Rent comps 3 comps
| Address | Beds | Baths | Sqft | Rent | $/sqft | DOM | Units | Dist |
|---|---|---|---|---|---|---|---|---|
| 1218 Chestnut Ct Runaway Bay, TX | 2.0 | 2.0 | 1207 | $1,700 | $1.41 | 3d | 1 | 0.04mi |
| 1218 Chestnut Ct Runaway Bay, TX | 2.0 | 1.5 | 1207 | $1,700 | $1.41 | 6d | 1 | 0.04mi |
| 1210 Chestnut Ct Unit 1 Runaway Bay, TX | 2.0 | 2.5 | 1079 | $1,800 | $1.67 | 43d | 1 | 0.05mi |
Listing history 36 events
-
2026-06-18days on market $150,000 Active 36 DOM
-
2026-06-17days on market $150,000 Active 35 DOM
-
2026-06-16days on market $150,000 Active 34 DOM
-
2026-06-15days on market $150,000 Active 33 DOM
-
2026-06-13days on market $150,000 Active 31 DOM
-
2026-06-13days on market $150,000 Active 30 DOM
-
2026-06-09days on market $150,000 Active 27 DOM
-
2026-06-08days on market $150,000 Active 26 DOM
-
2026-06-07days on market $150,000 Active 25 DOM
-
2026-06-04days on market $150,000 Active 22 DOM
-
2026-06-03days on market $150,000 Active 21 DOM
-
2026-06-02days on market $150,000 Active 20 DOM
-
2026-06-01days on market $150,000 Active 19 DOM
-
2026-05-31days on market $150,000 Active 18 DOM
-
2026-05-13$155,000 Active 264-char remark
-
2026-05-12$155,000 Active 155-char remark
Show marketing remark (155 chars)
Updated patio home near the lake at Runaway Bay. Updated doors, windows, paint, floor covering, vanities, kitchen cabinets have been refaced and new doors.
-
2024-01-13historical
-
2023-09-12price $161,000
-
2023-09-03status Active
-
2023-08-21status Pending
-
2023-08-18historical Active Option Contract
-
2023-07-11$165,000 Active
-
2023-05-26historical Active Option Contract
-
2023-05-11price $165,000
-
2023-04-14price $175,000
-
2023-04-03price $179,999
-
2023-03-28price $185,000
-
2023-03-18price $199,999
-
2023-03-06price $215,000
-
2023-02-28$230,000 Active
-
2019-02-22soldstatus Sold
-
2019-02-22soldstatus
-
2019-02-07status Pending
-
2019-02-01$97,500 Active
-
1993-03-03soldstatus
-
1992-07-13soldstatus
ⓘ Source: listings_history table (triggers on properties + properties_extension) + one-shot
backfill from property_details.listing_events for pre-trigger history.
Tax reassessment forecast TX · Resets to sale price
- Current annual tax
- $2,135 · $178/mo
- Projected year-2 tax
- $2,745 · $229/mo
- Expected delta
- +$610/yr (+$51/mo · 28.6%)
ⓘ Screening estimate from a state-policy table — verify with the county assessor before closing.
Climate risk First Street
- Flood 1/10 Low FEMA zone X (unshaded) · 0% chance over 30 yrs
- Wildfire 7/10 Severe
- Heat 7/10 Severe 7 d/yr ≥111°F today · 21 d/yr by 30 yrs out
- Wind 4/10 Moderate 17% chance of damaging wind over 30 yrs
- Air quality 1/10 Low 0 unhealthy d/yr today · 0 by 30 yrs out
Nearby sold comps map
Loading sold comps map…
Walkable amenities ~0.75 mi
Loading nearby amenities…
Taxation est. · year 1
- Rental income
- $21,141
- − Mortgage interest
- −$8,402
- − Property taxes
- −$2,135
- − Insurance
- −$750
- − Repairs & maintenance
- −$1,691
- − Management
- −$1,691
- − Depreciation
- −$4,364
- Taxable income
- $2,108
- Est. tax owed @ 24.0%
- −$506
- After-tax cash flow
- $3,872/yr
For passive investors: Depreciation is non-cash, so a rental often shows a tax loss while cash-flowing — sheltering income. Rental losses are passive: they offset passive income freely, and up to $25,000/yr can offset ordinary (W-2) income if you actively participate and your MAGI is under $100k (phasing out to $0 by $150k); unused losses carry forward. On sale, claimed depreciation is recaptured at up to 25%, and gains may owe capital-gains tax (a 1031 exchange can defer both). Figures are a year-1 estimate at your 24.0% rate — not tax advice; consult a CPA.
Schools (NCES district)
- District
- Bridgeport ISD
- NCES district ID
- 4811340
- Math proficiency
- 41% ▼ -4.00%
- Reading proficiency
- 41% ▲ 3.00%
- Median HH income
- $51,866
- Composite
- 35.51/100
- National rank
- #4913
- State rank
- #356 of 826 in TX
Livability — Runaway Bay
- Score
- 68/100
- State rank
- #491
- US rank
- #9730
Category grades
Schools grade is shown separately in the Schools card above.
Census & demographics
- Census place
- Runaway Bay, TX
- County
- Wise County · 49,037 people
- Metro
- Dallas-Fort Worth-Arlington, TX
- Population (ZIP)
- 11,632
- Household income
- $92,130
- Rent vs Own
- Severe rent burden
- 74.0
Population outlook (Wise County) Hauer SSP2
- Today (2025)
- 71,620 people
- By 2030
- 75,858 · +5.9%
- By 2040
- 83,908 · +17.2%
- By 2050
- 90,717 · +26.7%
- By 2075
- 107,583 · +50.2%
- By 2100
- 114,996 · +60.6%
Race, ethnicity, and origin ACS 2023
- Neighborhood character
- Majority White (60%)
- Race & ethnicity
- White 60% Hispanic / Latino 32% Two or more races 9% Black 2% Asian 1% Native American 1%
- Hispanic origin (detail)
- Mexican 31%
- Common ancestry
- Slovak 1% Lithuanian 1% Romanian 1%
- Foreign-born
- 14% · Canada, Vietnam
- Languages at home
- 72% English-only · Spanish 27%
Political lean MEDSL · Wise
- 2024 margin
- Solid R (+70.0) · D 14.7% · R 84.7%
- 2008→2024 swing
- -14.3pp toward R · 2008: -55.7pp · 2024: -70.0pp
- All cycles
- 2024: R+70.0 2020: R+68.2 2016: R+69.9 2012: R+67.5 2008: R+55.7
Not yet ingested
- Civics
- —
Market trends
- HPI YoY
- ▼ -0.82%
- Current HPI
- 417.89
- Rent YoY
- —
- Metro
- Dallas-Fort Worth-Arlington, TX
- State GDP YoY
- ▲ 3.95%
- F500 in state
- 110
Industry mix (Fortune 500 HQ in TX)
| Industry | F500 HQs | Revenue |
|---|---|---|
| Energy | 16 | $1,198B |
|
||
| Technology | 5 | $198B |
|
||
| Engineering / Construction | 4 | $72B |
|
||
| Energy Services | 3 | $60B |
|
||
| Utilities | 3 | $41B |
|
||
| Healthcare | 2 | $330B |
|
||
Price history
+53.8% since first listed23 events — show timeline
- 2026-05-29 Price Changed $150,000 NTREIS
- 2026-05-13 Listed $155,000 NTREIS
- 2026-05-12 Listed $155,000 FSBO.com
- 2024-01-13 Listing Removed — NTREIS
- 2023-09-12 Price Changed $161,000 NTREIS
- 2023-09-03 Relisted — NTREIS
- 2023-08-21 Pending — NTREIS
- 2023-08-18 Contingent — NTREIS
- 2023-07-11 Listed $165,000 NTREIS
- 2023-05-26 Contingent — NTREIS
- 2023-05-11 Price Changed $165,000 NTREIS
- 2023-04-14 Price Changed $175,000 NTREIS
- 2023-04-03 Price Changed $179,999 NTREIS
- 2023-03-28 Price Changed $185,000 NTREIS
- 2023-03-18 Price Changed $199,999 NTREIS
- 2023-03-06 Price Changed $215,000 NTREIS
- 2023-02-28 Listed $230,000 NTREIS
- 2019-02-22 Sold (Public Records) — Public Records
- 2019-02-22 Sold (MLS) — NTREIS
- 2019-02-07 Pending — NTREIS
- 2019-02-01 Listed $97,500 NTREIS
- 1993-03-03 Sold (Public Records) — Public Records
- 1992-07-13 Sold (Public Records) — Public Records
Property tax history
+3.7%/yrLatest (2025): $2,135 · -6.7% YoY. Source: county tax records.
Cash-flow waterfall
monthlySold comps — $/sqft
last 12 mo · ≤1 miLoading sold comps…