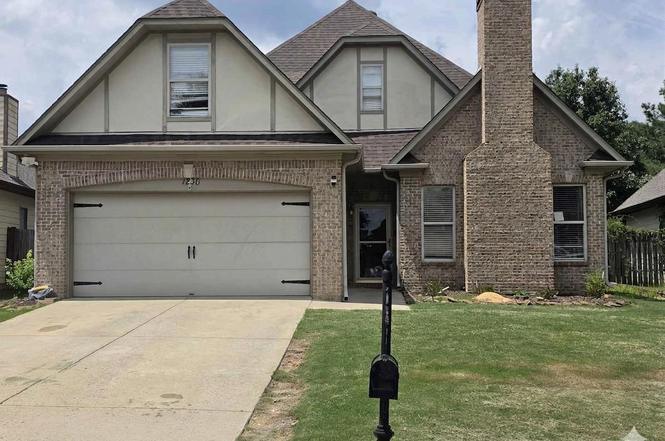
1236 Glenstone Pl · Moody, AL
Flood risk 1/10 · Minimal
- FEMA flood zone
- X (unshaded)
- Chance of flooding over 30 yrs
- 0.0%
- Est. flood insurance / yr
- $507 – $1,088
Fire risk 5/10 · Moderate
- Est. fire insurance / yr
- $916 – $1,700
Heat risk 7/10 · Major
- Hot days now (above 105°F)
- 8 days/yr
- Hot days in 30 yrs
- 22 days/yr
Wind risk 6/10 · Moderate
- Chance of severe wind over 30 yrs
- 27.0%
Air-quality risk 4/10 · Minor
- Unhealthy air days now
- 3 days/yr
- Unhealthy air days in 30 yrs
- 7 days/yr
Risk factors via First Street. Map © Google.
Why this score? — see what drove the D+ grade
The composite is a weighted blend of 9 inputs, each scored 0–100. Each bar is that input's sub-score; the figure is the points it added to the 100-point composite (weight × sub-score).
- ARV discount +15.0/15.0
- Cash flow +14.5/30.0
- DSCR +4.4/10.0
- Rent growth +4.2/5.0
- Schools +3.2/10.0
- Livability +3.2/5.0
- 1% rule +3.0/10.0
- Condition / age +2.5/5.0
- Appreciation +0.0/10.0
$259,900
🖨 Deal sheet (PDF) 📄 Offer letter ✓ Due diligence
Listing remarks MLS
Take a look at the 360HD Tour by clicking the virtual tour link! * Eligible for USDA's 100% Financing! * Welcome to Avalon! A community where neighbors know one another by name and children play outside! Featuring a sprawling 2,134+- Sq ft (per appraisal) this home is one of the roomiest in the area! At 4BD, 2BA You'll have an abundance of space w/ walk in pantry, large bedrooms and the upstairs 4th bedroom is like a Guest suite and office in one w/ its own walk in closet and has its own separate HVAC! Upgrades such as the cool hardwood floors in kitchen along with upgrades of new carpet & tile! The kitchen also boasts a stainless kitchen appliance package! With all the room and the wood burning fireplace you'll absolutely love what you get inside but once you walk outside on the screened patio is when it'll really hit you that this is HOME! Finding relaxation won't be hard here with the gorgeous back yard, community amenities such as the pool or the local Moody splash pad! Come see!
Key facts
- 6,098 sq ft lot
- 2 garage spots
- Built 2006
Property features AI
Finance
- Other: Lot size approximately 0.14 acre; Subdivision: Avalon
- HOA & community: Yearly association fee ($300) including common grounds maintenance and recreation facility
Exterior
- Parking: Attached 2-car garage with front entry; Driveway parking
- Utilities: Public water; Connected sewer; Underground utilities; Unknown internet availability
- Home design: Existing single-family home; Tri-level: No; Split level: No; Split foyer: No; Main living areas and all listed rooms on main level with additional upper level space
- Construction: One-side brick and other siding exterior; Slab foundation; Built prior to current listing (existing)
- Exterior features: Fenced yard; Screened patio
Interior
- Kitchen: Dishwasher (built-in); Built-in microwave; Electric stove; Solid surface countertops
- Bedrooms: Master bedroom (main level); Additional bedrooms (main level); Walk-in closets; Bedrooms located on main level
- Flooring: Carpet; Hardwood; Tile floors
- Bathrooms: Two full bathrooms; Master bath on main level; Separate shower; Garden tub; Linen closet
- Heating & cooling: Central heating; Central cooling
- Interior features: Cathedral/vaulted ceilings; Marble woodburning fireplace in the living room; Solid surface kitchen countertops; Some stainless appliances; No additional listed interior features
- Laundry & utility: Laundry room on main level; Washer hookup; Electric dryer hookup; Electric water heater
Neighborhood map
What this means for you Summary
Snapshot
- This is a 4-bed/1.0-bath single-family listed at $260k.
Deal economics
- At list price, monthly cash flow is $55 ($658/yr) — positive.
- The deal already cash-flows at list — no discount required.
- To meet the 1% rule (rent ≥ 1% of price), the offer needs to be $209k (19.7% below list).
- Recommended offer: $209k (19.7% below list) — sets the bar for 1% rule.
- Cap rate 6.5% vs local median 5.0% in Moody — top-decile yield for the area; either an underpriced asset or a hidden risk that comps aren't pricing in. Stress-test before assuming the spread holds.
Location & tenants
- Location reads 63/100 on livability (#191 in AL) — a middle-class / working-renter tenant base. Strengths: cost of living A+, housing A+, crime A; Watch: amenities F, commute F, health & safety F.
- St Clair County (rural): math 21% / reading 52% proficiency, ranked #33 of 129 in AL (top 26%) — families likely to look elsewhere, expect single-tenant / working-renter base with shorter leases.
- Zoned schools: Moody Elementary School (math 47% / reading 67%, grade C+, #76 of 627 statewide, top 13%, 835 students, 54% FRL); Moody Middle School (math 20% / reading 61%, grade F, #56 of 257 statewide, top 22%, 524 students, 61% FRL); Moody High School (math 17% / reading 22%, grade F, #169 of 305 statewide, top 59%, 687 students, 50% FRL).
- Market conditions: Rents rising fast (+6.7%/yr); 84 active listings in the ZIP; 3 comparable units currently listed for rent nearby; rentals leasing fast (median 4d on market — plan ~1-2 weeks tenant-placement turnaround); solid renter incomes; 557 units permitted in St. Clair County in 2024 (0 in 5+ unit buildings).
Forward outlook
- Local home prices are declining (-3.0%/yr); year-one equity from $2k of loan paydown is wiped out by about $8k of value loss. Plan a longer hold.
- St. Clair County population projected at +11% by 2050 — modest demand growth; plan on rents tracking national, not racing it.
Negotiation context
- Only 5 days on market — expect competitive offers; lowballing is unlikely to land.
- 2 sale attempts since 13y ago; this cycle's ask is 46% above the opening price — seller raised mid-cycle; expect resistance to lowballs.
- Current owner paid $174k; 49% above their basis — modest negotiation headroom, anchor on the comps not their cost.
Risks & watch-outs
- Climate carrying-cost: major wind risk, 27% chance of damaging wind over 30y; moderate wildfire risk; extreme-heat days projected 8→22/yr by 2055 (HVAC capex compounding) — expect insurance premiums to compound above CPI over the hold.
Questions for the listing agent
- What does the HOA fee cover, when was the last increase, and are there any pending special assessments or reserve-fund shortfalls?
- Is there a deadline driving the sale (1031 exchange, divorce, estate, relocation)? That informs how much negotiation room exists.
- The area grade is low — what's the realistic commute time and amenity access for the typical tenant pool here? Any planned neighborhood developments (good or bad) we should know about?
- What's the average days-on-market for RENTAL listings here right now (not sales)? A rising rental-DOM trend means longer vacancies and softer asking-rent achievability than the comps imply.
- What's the recent tenant-quality profile in this submarket — average credit score on applications, eviction rate, late-payment / NSF rate, and stable-employment percentage? A property-management company in the area should have these aggregated.
- How much new for-sale + rental construction is in the pipeline within 1–3 miles? Heavy new supply typically softens prices + rents 12–24 months out; constrained supply supports both.
Investment metrics
- 1% rule
- 0.80% ✗
- Cap rate
- 6.55%
- Cash-on-cash
- 0.90%
- DSCR
- 1.04
- GRM
- 10.4
CMA / ARV
- ARV (on-the-fly)
- $351,372
- Comps found
- 12
Show comp detail 12 sales within ~0.75 mi
| Address | Dist | Beds/Ba | Sqft | Sold | Price | $/sf | Match |
|---|---|---|---|---|---|---|---|
| 1136 Avalon Dr | 0.22mi | 3/2.5 (-1) | 1,785 (-4%) | 5mo | $293,000 | $164 | 67 |
| 4011 Verbena Dr | 0.51mi | 3/2.0 (-1) | 1,988 (+6%) | 3mo | $340,000 | $171 | 54 |
| 3001 Iris Ct | 0.61mi | 3/2.0 (-1) | 1,770 (-5%) | 2mo | $328,000 | $185 | 52 |
| 6004 Arbor Rdg | 0.70mi | 3/2.0 (-1) | 1,740 (-7%) | 2mo | $356,765 | $205 | 45 |
| 1075 Creel Dr | 0.65mi | 4/2.0 | 2,075 (+11%) | 3mo | $475,000 | $229 | 45 |
| 4155 Gardenia Ln | 0.62mi | 3/2.0 (-1) | 1,700 (-9%) | 3mo | $334,900 | $197 | 44 |
| 6005 Arbor Rdg | 0.70mi | 3/2.5 (-1) | 2,015 (+8%) | 2mo | $368,105 | $183 | 42 |
| 6001 Arbor Rdg | 0.70mi | 3/2.5 (-1) | 2,015 (+8%) | 2mo | $358,800 | $178 | 42 |
| 6029 Arbor Rdg | 0.70mi | 3/2.5 (-1) | 2,015 (+8%) | 4mo | $362,705 | $180 | 40 |
| 6052 Arbor Rdg | 0.70mi | 3/2.5 (-1) | 2,015 (+8%) | 6mo | $380,660 | $189 | 38 |
| 6053 Arbor Rdg | 0.70mi | 3/2.0 (-1) | 1,679 (-10%) | 6mo | $319,320 | $190 | 36 |
| 6078 Arbor Rdg | 0.74mi | 3/2.0 (-1) | 1,679 (-10%) | 4mo | $314,945 | $188 | 36 |
Match score weights: distance 35% · size 25% · config 20% · recency 20%. Top-matched comps best support the ARV.
Projected returns pro-forma
-3.0% appreciation · 6.67% rent growth · sell at horizon
- IRR
- -11.3%
- Equity multiple
- 0.58×
- Total profit
- $-30,722
- Equity at exit
- $38,752
- IRR
- 2.1%
- Equity multiple
- 1.18×
- Total profit
- $12,739
- Equity at exit
- $22,471
Cash invested: $72,772 (down + closing). Projections, not guarantees.
Landlord ↔ Tenant lean methodology
- Overall (STATE)
- 90 Strongly Landlord-Friendly
- State Alabama
- 90 Strongly Landlord-Friendly · R+15
- County
- — inherits STATE
- City
- — inherits STATE
ZIP-level market 35004
- Home prices YoY
- -26.5%
- Rents YoY
- 6.7%
- Active inventory
- 84
- Price-to-rent
- 10.4×
Monthly cashflow live
- Estimated rent
- $2,087 medium interval (Pro) →
- Mortgage (P&I)
- −$1,363
- Tax from tax record
- −$98 /mo · $1,174/yr
- Insurance
- −$108
- HOA
- −$25
- Vacancy / Maint / Mgmt
- −$438
- Net cashflow
- $55
Break-even live
Sensitivity live
| Price | -10% $202 | -5% $128 | +0% $55 | +5% $-19 | +10% $-92 |
|---|---|---|---|---|---|
| Rent | -10% $-110 | -5% $-28 | +0% $55 | +5% $137 | +10% $220 |
| Rate | -1.0pp $186 | -0.5pp $121 | base $55 | +0.5pp $-12 | +1.0pp $-81 |
UW: 25.0% down · 7.5% · 30yr · 1.5% tax · 5.0% vac · 8.0% maint · 8.0% mgmt
Financing live
Cash to close
- Down payment
- $64,975
- Closing costs
- $7,797
- Reserves months
- —
- Total cash needed
- —
Loan-product check · same deal, 3 products live
Conventional
25% down · 7.5% · 30yr
- Down + closing
- —
- Monthly P&I
- —
- Monthly cashflow
- —
- DSCR
- —
- Eligible?
- —
Personal DTI + credit; lowest rate.
DSCR
20% down · 8.5% · 30yr
- Down + closing
- —
- Monthly P&I
- —
- Monthly cashflow
- —
- DSCR
- —
- Eligible?
- —
No personal income docs; deal must DSCR.
Hard money
10% down · 12.0% · 12mo
- Down + closing
- —
- Monthly P&I
- —
- Monthly cashflow
- —
- DSCR
- —
- Eligible?
- —
Short-term bridge; refi at stabilization.
Rent comps 3 comps
| Address | Beds | Baths | Sqft | Rent | $/sqft | DOM | Units | Dist |
|---|---|---|---|---|---|---|---|---|
| 1136 Washington Dr Moody, AL | 3.0 | 2.0 | 1423 | $1,823 | $1.28 | 3d | 1 | 0.12mi |
| 1256 Washington Dr Moody, AL | 3.0 | 2.0 | 1544 | $1,696 | $1.10 | 3d | 1 | 0.14mi |
| 1135 Avalon Dr Moody, AL | 3.0 | 2.0 | 1466 | $1,849 | $1.26 | 12d | 1 | 0.18mi |
HOA detail
- Monthly dues
- $25 · $300/yr
- Likely covers
- pool
Listing history 5 events
-
2026-06-22days on market $259,900 Active 5 DOM
-
2026-06-18days on market $259,900 Active 2 DOM
-
2026-06-16status $259,900 Active 1 DOM
-
2026-06-15remarks 601-char remark
-
2026-06-15$259,900 Coming Soon 1 DOM
ⓘ Source: listings_history table (triggers on properties + properties_extension) + one-shot
backfill from property_details.listing_events for pre-trigger history.
Tax reassessment forecast AL · Resets to sale price
- Current annual tax
- $1,174 · $98/mo
- Projected year-2 tax
- $1,174 · $98/mo
- Expected delta
- $0/yr ($0/mo · 0.0%)
ⓘ Screening estimate from a state-policy table — verify with the county assessor before closing.
Climate risk First Street
- Flood 1/10 Low FEMA zone X (unshaded) · 0% chance over 30 yrs
- Wildfire 5/10 Major
- Heat 7/10 Severe 8 d/yr ≥105°F today · 22 d/yr by 30 yrs out
- Wind 6/10 Major 27% chance of damaging wind over 30 yrs
- Air quality 4/10 Moderate 3 unhealthy d/yr today · 7 by 30 yrs out
Nearby sold comps map
Loading sold comps map…
Walkable amenities ~0.75 mi
Loading nearby amenities…
Taxation est. · year 1
- Rental income
- $25,047
- − Mortgage interest
- −$14,558
- − Property taxes
- −$1,174
- − Insurance
- −$1,300
- − Repairs & maintenance
- −$2,004
- − Management
- −$2,004
- − HOA
- −$300
- − Depreciation
- −$7,561
- Taxable loss
- −$3,853
- Est. tax savings @ 24.0%
- +$925
- After-tax cash flow
- $1,583/yr
For passive investors: Depreciation is non-cash, so a rental often shows a tax loss while cash-flowing — sheltering income. Rental losses are passive: they offset passive income freely, and up to $25,000/yr can offset ordinary (W-2) income if you actively participate and your MAGI is under $100k (phasing out to $0 by $150k); unused losses carry forward. On sale, claimed depreciation is recaptured at up to 25%, and gains may owe capital-gains tax (a 1031 exchange can defer both). Figures are a year-1 estimate at your 24.0% rate — not tax advice; consult a CPA.
Schools (NCES district)
- District
- St Clair County
- NCES district ID
- 0103062
- Math proficiency
- 21% ▼ -34.00%
- Reading proficiency
- 52% ▬ 0.00%
- Median HH income
- $53,324
- Composite
- 31.79/100
- National rank
- #5887
- State rank
- #33 of 129 in AL
Livability — Moody
- Score
- 63/100
- State rank
- #191
- US rank
- #15571
Category grades
Schools grade is shown separately in the Schools card above.
Census & demographics
- Census place
- Moody, AL
- County
- Saint Clair County · 54,404 people
- City population
- 12,155
- Metro
- Birmingham-Hoover, AL
- Population (ZIP)
- 12,155
- Household income
- $87,652
- Rent vs Own
- Severe rent burden
- 108.0
Population outlook (St. Clair County) Hauer SSP2
- Today (2025)
- 94,158 people
- By 2030
- 97,008 · +3.0%
- By 2040
- 101,615 · +7.9%
- By 2050
- 104,537 · +11.0%
- By 2075
- 109,350 · +16.1%
- By 2100
- 106,785 · +13.4%
Race, ethnicity, and origin ACS 2023
- Neighborhood character
- Predominantly White (78%)
- Race & ethnicity
- White 78% Black 13% Two or more races 6% Hispanic / Latino 3% Native American 1%
- Common ancestry
- Slovak 4% Lithuanian 3% Serbian 1%
- Foreign-born
- 2% · Canada
- Languages at home
- 97% English-only · Tagalog/Filipino 1% Spanish 1% French/Haitian/Cajun 1%
Political lean MEDSL · St. Clair
- 2024 margin
- Solid R (+64.1) · D 17.6% · R 81.7%
- 2008→2024 swing
- -0.9pp no change · 2008: -63.2pp · 2024: -64.1pp
- All cycles
- 2024: R+64.1 2020: R+64.0 2016: R+68.6 2012: R+66.1 2008: R+63.2
Not yet ingested
- Civics
- —
Market trends
- HPI YoY
- ▼ -64.20%
- Current HPI
- 177.6589
- Rent YoY
- ▲ 6.67%
- Metro
- Birmingham-Hoover, AL
- State GDP YoY
- ▲ 2.94%
- F500 in state
- 4
Industry mix (Fortune 500 HQ in AL)
| Industry | F500 HQs | Revenue |
|---|---|---|
| Financial Services | 1 | $8B |
|
||
| Healthcare | 1 | $5B |
|
||
Price history
+80.5% since first listed9 events — show timeline
- 2026-06-15 Coming Soon $259,900 Greater Alabama MLS
- 2017-04-26 Sold (Public Records) $174,000 Public Records
- 2017-04-24 Sold (MLS) $174,000 Greater Alabama MLS
- 2017-03-16 Contingent — Greater Alabama MLS
- 2017-02-21 Listed $177,500 Greater Alabama MLS
- 2014-04-25 Sold (Public Records) $147,000 Public Records
- 2014-04-18 Sold (MLS) $147,000 Greater Alabama MLS
- 2013-12-06 Listed $149,900 Greater Alabama MLS
- 2005-11-28 Sold (Public Records) $144,000 Public Records
Property tax history
+9.7%/yrLatest (2022): $1,174 · +57.2% YoY. Source: county tax records.
Cash-flow waterfall
monthlySold comps — $/sqft
last 12 mo · ≤1 miLoading sold comps…