 Duplex
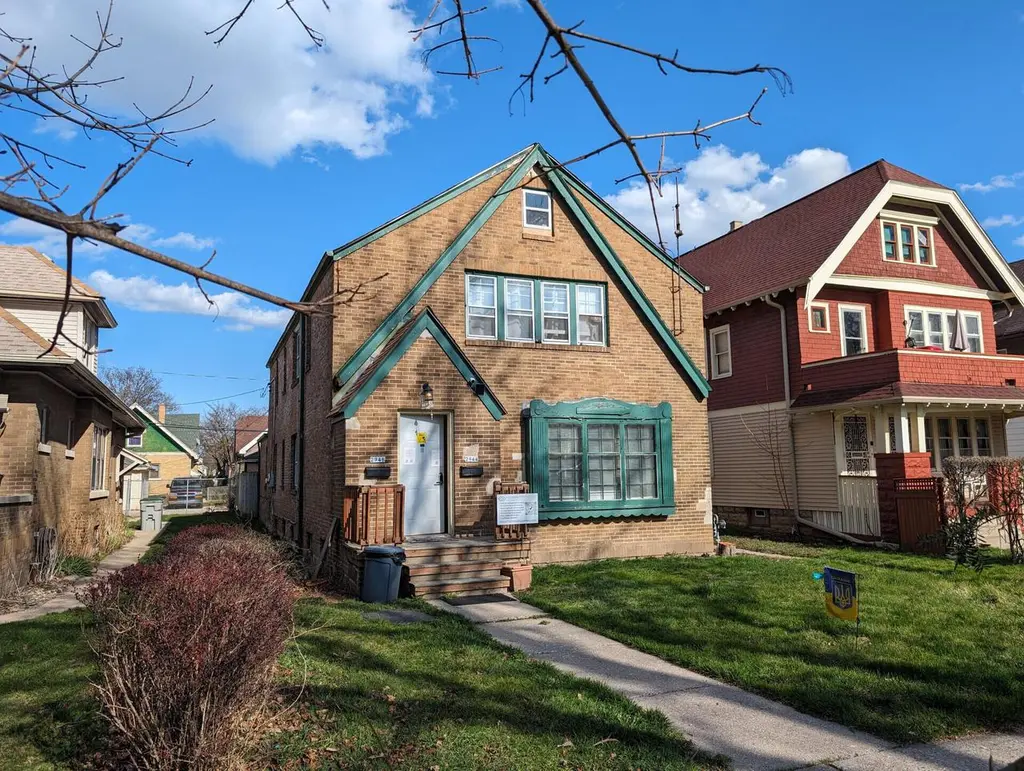
2944 N 48th St · Milwaukee, WI
Flood risk 1/10 · Minimal
- FEMA flood zone
- X (unshaded)
- Chance of flooding over 30 yrs
- 0.0%
- Est. flood insurance / yr
- $473 – $860
Fire risk 1/10 · Minimal
- Est. fire insurance / yr
- $636 – $1,182
Heat risk 2/10 · Minimal
- Hot days now (above 98°F)
- 7 days/yr
- Hot days in 30 yrs
- 13 days/yr
Wind risk 2/10 · Minimal
- Chance of severe wind over 30 yrs
- —
Air-quality risk 2/10 · Minimal
- Unhealthy air days now
- 2 days/yr
- Unhealthy air days in 30 yrs
- 2 days/yr
Risk factors via First Street. Map © Google.
Why this score? — see what drove the D grade
The composite is a weighted blend of 9 inputs, each scored 0–100. Each bar is that input's sub-score; the figure is the points it added to the 100-point composite (weight × sub-score).
- Cash flow +19.3/30.0
- DSCR +6.1/10.0
- 1% rule +5.1/10.0
- Livability +4.0/5.0
- Rent growth +3.5/5.0
- Condition / age +2.2/5.0
- Schools +1.2/10.0
- ARV discount +0.0/15.0
- Appreciation +0.0/10.0
$235,000
🖨 Deal sheet 📄 Offer letter ✓ Due diligence
Multi-family units
County records classify this as Multi-Family (5+ Unit). Listing-text estimate: 2 units. estimate disagrees with records
5+ unit building — per-unit beds/baths from public records are typically unavailable; the breakdown below (if shown) is an estimate from the listing text.
Listing remarks MLS
Excellent brick duplex investment opportunity with strong cash flow and upside in a convenient Milwaukee location. This well-maintained property offers a total of 6 bedrooms, 3 full bathrooms, and 2 additional half bathrooms, providing flexible layouts and strong tenant appeal. Both main units are currently rented at $1,450 per month each, generating $2,900 in immediate monthly income. The property also features a finished basement area with potential for an additional studio rental, estimated at $650 per month, bringing total projected monthly income to $3,550. Property is being sold in ''AS IS'' condition. Garage siding and roof have a hole
Key facts
- Strong cash flow
- Brick duplex
- Milwaukee location
Tags
Neighborhood map
What this means for you Summary
Snapshot
- This is a 2 × 3-bed/1.8-bath units multifamily listed at $235k. Condition is rated fair.
Deal economics
- At list price, monthly cash flow is $258 ($3k/yr) — positive. Per door: $129/mo.
- The deal already cash-flows at list — no discount required.
- Meets the 1% rule at list price ($2k rent vs $235k).
- Recommended offer: $207k (12.0% below list) — sets the bar for market timing.
- Cap rate 7.6% vs local median 5.1% in Milwaukee — top-decile yield for the area; either an underpriced asset or a hidden risk that comps aren't pricing in. Stress-test before assuming the spread holds.
Location & tenants
- Location reads 81/100 on livability (#55 in WI, #1,534 nationally) — a professional / high-income tenant draw. Strengths: amenities A+, commute A+, cost of living A+; Watch: employment D+, schools F, crime F.
- Milwaukee School District (urban): math 10% / reading 18% proficiency, ranked #337 of 342 in WI (top 98%) — low school quality limits family demand, transient renter base, plan for 1-2y turnover; 77% free/reduced lunch — lower-income household profile, screen leases tightly.
- Market conditions: Rents rising (+3.8%/yr); 142 active listings in the ZIP; 3 comparable units currently listed for rent nearby; rentals at typical pace (median 24d on market — plan ~3-4 weeks tenant-placement turnaround); 1,017 units permitted in Milwaukee County in 2024 (803 in 5+ unit buildings).
- At $2,382/mo this rent would consume 59% of the median local household income ($48k/yr) (locally 1730% of renters already pay >50% of income on rent) — very limited rent-growth headroom before tenants either downsize or default.
Forward outlook
- Local home prices are declining (-3.0%/yr); year-one equity from $2k of loan paydown is wiped out by about $7k of value loss. Plan a longer hold.
- Milwaukee County population projected at +4% by 2050 — modest demand growth; plan on rents tracking national, not racing it.
Negotiation context
- It's been on market 123 days — a 12% lower offer ($207k) is reasonable based on typical stale-listing flexibility.
- 3 sale attempts since 2y ago; this cycle's ask is 4% above the opening price — seller raised mid-cycle; expect resistance to lowballs.
Risks & watch-outs
- Watch-outs: built in 1927 — expect roof / HVAC / electrical / plumbing capex.
Questions for the listing agent
- It's been on market 123 days. Have you received any prior offers? Is the seller open to a 12% concession, seller financing, or rate buy-down credit?
- Can we see the unit-by-unit rent roll, current vacancy, and any below-market leases? What's the average tenancy length?
- What capital expenditures (roof, boiler, parking lot, exteriors) have been made in the last 5 years, and what's planned in the next 2?
- Have any recent inspections been done? Can we get a copy of the seller's disclosures and any deferred-maintenance estimates?
- Built in 1927 — when were the roof, HVAC, electrical panel, plumbing, and water heater last replaced?
- Why hasn't it sold? Are there any deal-killer items the seller is aware of (foundation, flood, title, zoning, code violations)?
- Is there a deadline driving the sale (1031 exchange, divorce, estate, relocation)? That informs how much negotiation room exists.
- Schools are F-rated, which usually means shorter tenancies and higher turnover. Who's the typical renter profile here, and what's been the actual vacancy rate?
- Crime grade is F in this area — have there been break-ins, vandalism, or insurance claims at this property in the last 3 years? What carrier currently insures it and at what premium?
- The area grade is low — what's the realistic commute time and amenity access for the typical tenant pool here? Any planned neighborhood developments (good or bad) we should know about?
- What's the average days-on-market for RENTAL listings here right now (not sales)? A rising rental-DOM trend means longer vacancies and softer asking-rent achievability than the comps imply.
- What's the recent tenant-quality profile in this submarket — average credit score on applications, eviction rate, late-payment / NSF rate, and stable-employment percentage? A property-management company in the area should have these aggregated.
- How much new apartment / multifamily construction is in the pipeline within 1–3 miles? Heavy new supply (>2% of stock underway) typically softens rents 12–24 months out; light construction supports rent growth.
Investment metrics
- 1% rule
- 1.01% ✓
- Cap rate
- 7.61%
- Cash-on-cash
- 4.70%
- DSCR
- 1.21
- GRM
- 8.2
CMA / ARV
- ARV (median comp)
- $174,126
- List price
- $235,000
- Delta
- 34.96%
- Verdict
- OVERPRICED
- Comps
- 20 within 1.0 mi
Show comp detail 12 sales within ~0.75 mi
| Address | Dist | Beds/Ba | Sqft | Sold | Price | $/sf | Match |
|---|---|---|---|---|---|---|---|
| 2848 N 50th St #2850 | 0.17mi | 6/2.0 | 2,222 (-2%) | 1mo | $239,900 | $108 | 81 |
| 3012 N 57th St | 0.55mi | 6/2.0 | 2,261 (-0%) | 3mo | $180,000 | $80 | 66 |
| 2860 N 52nd St #2862 | 0.28mi | 5/3.0 (-1) | 2,440 (+8%) | 10mo | $290,000 | $119 | 59 |
| 2501 N 50th St #2503 | 0.59mi | 6/2.0 | 2,325 (+3%) | 5mo | $239,000 | $103 | 58 |
| 2977 N 60th St #2979 | 0.73mi | 5/2.0 (-1) | 2,273 (+0%) | 0mo | $179,900 | $79 | 53 |
| 2555 N 51st St #2557 | 0.54mi | 6/2.0 | 2,519 (+11%) | 7mo | $148,400 | $59 | 44 |
| 3154 N 54th St #3156 | 0.46mi | 5/2.0 (-1) | 2,523 (+11%) | 6mo | $168,010 | $67 | 44 |
| 2638 N 49th St #2640 | 0.39mi | 6/2.0 | 2,556 (+13%) | 12mo | $190,000 | $74 | 44 |
| 2565 N 40th St #2567 | 0.68mi | 5/2.0 (-1) | 2,348 (+4%) | 9mo | $123,000 | $52 | 43 |
| 2437 N 45th St #2439 | 0.66mi | 6/2.0 | 2,423 (+7%) | 9mo | $175,000 | $72 | 43 |
| 3176 N 54th St #3178 | 0.47mi | 5/2.0 (-1) | 2,523 (+11%) | 8mo | $240,000 | $95 | 41 |
| 2706 N 40th St #2708 | 0.60mi | 5/2.0 (-1) | 2,058 (-9%) | 12mo | $165,000 | $80 | 36 |
Match score weights: distance 35% · size 25% · config 20% · recency 20%. Top-matched comps best support the ARV.
Projected returns pro-forma
-3.0% appreciation · 3.82% rent growth · sell at horizon
- IRR
- -8.0%
- Equity multiple
- 0.70×
- Total profit
- $-19,647
- Equity at exit
- $35,039
- IRR
- 2.5%
- Equity multiple
- 1.19×
- Total profit
- $12,443
- Equity at exit
- $20,319
Cash invested: $65,800 (down + closing). Projections, not guarantees.
Landlord ↔ Tenant lean methodology
- Overall (STATE)
- 73 Landlord-Friendly
- State Wisconsin
- 73 Landlord-Friendly · R+2
- County
- — inherits STATE
- City
- — inherits STATE
ZIP-level market 53210
- Home prices YoY
- -21.5%
- Rents YoY
- 3.8%
- Active inventory
- 142
- Price-to-rent
- 16.4×
Monthly cashflow live
- Estimated rent
- $2,382 high interval (Pro) →
- Mortgage (P&I)
- −$1,232
- Tax est. 1.5%
- −$294 /mo · $3,525/yr
- Insurance
- −$98
- HOA
- −$0
- Vacancy / Maint / Mgmt
- −$500
- Net cashflow
- $258
Break-even live
2-unit breakdown (identical units grouped — click to expand)
| Units | Beds | Baths | Est. rent |
|---|---|---|---|
| 2× units | 3 | 1.8 | $2,382 |
| #1 | 3 | 1.8 | $1,191 |
| #2 | 3 | 1.8 | $1,191 |
| Total (2 units) | $2,382 | ||
UW: 25.0% down · 7.5% · 30yr · 1.5% tax · 5.0% vac · 8.0% maint · 8.0% mgmt
Financing live
Cash to close
- Down payment
- $58,750
- Closing costs
- $7,050
- Reserves months
- —
- Total cash needed
- —
Loan-product check · same deal, 3 products live
Conventional
25% down · 7.5% · 30yr
- Down + closing
- —
- Monthly P&I
- —
- Monthly cashflow
- —
- DSCR
- —
- Eligible?
- —
Personal DTI + credit; lowest rate.
DSCR
20% down · 8.5% · 30yr
- Down + closing
- —
- Monthly P&I
- —
- Monthly cashflow
- —
- DSCR
- —
- Eligible?
- —
No personal income docs; deal must DSCR.
Hard money
10% down · 12.0% · 12mo
- Down + closing
- —
- Monthly P&I
- —
- Monthly cashflow
- —
- DSCR
- —
- Eligible?
- —
Short-term bridge; refi at stabilization.
Rent comps 3 comps
| Address | Beds | Baths | Sqft | Rent | $/sqft | DOM | Units | Dist |
|---|---|---|---|---|---|---|---|---|
| 2137 N 47th St Milwaukee, WI | 5.0 | 2.0 | 1723 | $1,850 | $1.07 | 14d | 1 | 1.04mi |
| 2704 W Concordia Ave Unit Na Milwaukee, WI | 5.0 | 2.0 | 1856 | $2,500 | $1.35 | 23d | 1 | 1.36mi |
| 2432 N 28th St Milwaukee, WI | 5.0 | 1.5 | 1876 | $1,600 | $0.85 | 43d | 1 | 1.41mi |
Listing history 19 events
-
2026-06-16days on market $235,000 Active 123 DOM
-
2026-06-15days on market $235,000 Active 122 DOM
-
2026-06-13days on market $235,000 Active 120 DOM
-
2026-06-13days on market $235,000 Active 119 DOM
-
2026-06-09days on market $235,000 Active 116 DOM
-
2026-06-08days on market $235,000 Active 115 DOM
-
2026-06-07days on market $235,000 Active 114 DOM
-
2026-06-05days on market $235,000 Active 111 DOM
-
2026-06-03days on market $235,000 Active 110 DOM
-
2026-06-02days on market $235,000 Active 109 DOM
-
2026-06-01days on market $235,000 Active 108 DOM
-
2026-05-31days on market $235,000 Active 107 DOM
-
2026-05-15price $235,000 650-char remark
Show marketing remark (650 chars)
Excellent brick duplex investment opportunity with strong cash flow and upside in a convenient Milwaukee location. This well-maintained property offers a total of 6 bedrooms, 3 full bathrooms, and 2 additional half bathrooms, providing flexible layouts and strong tenant appeal. Both main units are currently rented at $1,450 per month each, generating $2,900 in immediate monthly income. The property also features a finished basement area with potential for an additional studio rental, estimated at $650 per month, bringing total projected monthly income to $3,550. Property is being sold in ''AS IS'' condition. Garage siding and roof have a hole
-
2026-03-13price $245,000 650-char remark
Show marketing remark (650 chars)
Excellent brick duplex investment opportunity with strong cash flow and upside in a convenient Milwaukee location. This well-maintained property offers a total of 6 bedrooms, 3 full bathrooms, and 2 additional half bathrooms, providing flexible layouts and strong tenant appeal. Both main units are currently rented at $1,450 per month each, generating $2,900 in immediate monthly income. The property also features a finished basement area with potential for an additional studio rental, estimated at $650 per month, bringing total projected monthly income to $3,550. Property is being sold in ''AS IS'' condition. Garage siding and roof have a hole
-
2026-02-13$225,000 Active 650-char remark
Show marketing remark (650 chars)
Excellent brick duplex investment opportunity with strong cash flow and upside in a convenient Milwaukee location. This well-maintained property offers a total of 6 bedrooms, 3 full bathrooms, and 2 additional half bathrooms, providing flexible layouts and strong tenant appeal. Both main units are currently rented at $1,450 per month each, generating $2,900 in immediate monthly income. The property also features a finished basement area with potential for an additional studio rental, estimated at $650 per month, bringing total projected monthly income to $3,550. Property is being sold in ''AS IS'' condition. Garage siding and roof have a hole
-
2024-04-10historical $1,450
-
2024-04-04$1,450
-
2024-03-28historical $1,850
-
2024-03-13$1,850
ⓘ Source: listings_history table (triggers on properties + properties_extension) + one-shot
backfill from property_details.listing_events for pre-trigger history.
Climate risk First Street
- Flood 1/10 Low FEMA zone X (unshaded) · 0% chance over 30 yrs
- Wildfire 1/10 Low
- Heat 2/10 Low 7 d/yr ≥98°F today · 13 d/yr by 30 yrs out
- Wind 2/10 Low
- Air quality 2/10 Low 2 unhealthy d/yr today · 2 by 30 yrs out
Nearby sold comps map
Loading sold comps map…
Walkable amenities ~0.75 mi
Loading nearby amenities…
Taxation est. · year 1
- Rental income
- $28,584
- − Mortgage interest
- −$13,164
- − Property taxes
- −$3,525
- − Insurance
- −$1,175
- − Repairs & maintenance
- −$2,287
- − Management
- −$2,287
- − Depreciation
- −$6,836
- Taxable loss
- −$689
- Est. tax savings @ 24.0%
- +$165
- After-tax cash flow
- $3,258/yr
For passive investors: Depreciation is non-cash, so a rental often shows a tax loss while cash-flowing — sheltering income. Rental losses are passive: they offset passive income freely, and up to $25,000/yr can offset ordinary (W-2) income if you actively participate and your MAGI is under $100k (phasing out to $0 by $150k); unused losses carry forward. On sale, claimed depreciation is recaptured at up to 25%, and gains may owe capital-gains tax (a 1031 exchange can defer both). Figures are a year-1 estimate at your 24.0% rate — not tax advice; consult a CPA.
Condition & rehab AI · 6 photos
This well-maintained but fair condition multi-family property presents an opportunity for moderate renovations to enhance its curb appeal and increase its value.
Repairs flagged
- Major Garage siding — Hole in the siding
- Major Garage roof — Hole in the roof
Value-add opportunities
- Both Landscaping — Improves curb appeal and rental value
- Both Paint exterior — Enhances curb appeal and resale value
- Both Replace garage siding and roof — Fixes major structural issues and improves property value
Renovation cost estimate screening
| Repair item | Severity | Est. cost |
|---|---|---|
| Garage siding · Hole in the siding | Major | $15,000–50,000 |
| Garage roof · Hole in the roof | Major | $15,000–50,000 |
| Total estimated repair cost · 2 items | $30,000–100,000 |
Value-add ROI direction
- Both Landscaping — Improves curb appeal and rental value ↑
- Both Paint exterior — Enhances curb appeal and resale value ↑
- Both Replace garage siding and roof — Fixes major structural issues and improves property value ↑
ⓘ Cost ranges are severity-bucket heuristics (US national rule-of-thumb). Get contractor quotes + a written scope before underwriting a rehab budget.
Schools (NCES district)
- District
- Milwaukee School District
- NCES district ID
- 5509600
- Math proficiency
- 10% ▼ -5.00%
- Reading proficiency
- 18% ▬ 0.00%
- Median HH income
- $36,339
- Composite
- 11.61/100
- National rank
- #9696
- State rank
- #337 of 342 in WI
Livability — Milwaukee
- Score
- 81/100
- State rank
- #55
- US rank
- #1534
Category grades
Schools grade is shown separately in the Schools card above.
Census & demographics
- Census place
- Milwaukee, WI
- County
- Milwaukee County · 926,379 people
- City population
- 573,768
- Metro
- Milwaukee-Waukesha, WI
- Population (ZIP)
- 23,922
- Household income
- $48,217
- Rent vs Own
- Severe rent burden
- 1730.0
Population outlook (Milwaukee County) Hauer SSP2
- Today (2025)
- 995,758 people
- By 2030
- 1,009,124 · +1.3%
- By 2040
- 1,028,128 · +3.3%
- By 2050
- 1,040,066 · +4.4%
- By 2075
- 1,057,849 · +6.2%
- By 2100
- 1,039,774 · +4.4%
Race, ethnicity, and origin ACS 2023
- Neighborhood character
- Predominantly Black (71%)
- Race & ethnicity
- Black 71% White 17% Hispanic / Latino 6% Two or more races 6% Asian 2%
- Hispanic origin (detail)
- Mexican 3% Puerto Rican 1%
- Common ancestry
- Romanian 2% Portuguese 1% Italian 1%
- Foreign-born
- 3% · Canada, Philippines
- Languages at home
- 94% English-only · Spanish 3% Other Asian/Pacific 2%
Political lean MEDSL · Milwaukee
- 2024 margin
- Solid D (+38.5) · D 68.3% · R 29.8% · Other 1.8%
- 2008→2024 swing
- +2.7pp toward D · 2008: 35.9pp · 2024: 38.5pp
- All cycles
- 2024: D+38.5 2020: D+39.9 2016: D+37.5 2012: D+34.6 2008: D+35.9
Not yet ingested
- Civics
- —
Market trends
- HPI YoY
- ▼ -76.77%
- Current HPI
- 280.0133
- Rent YoY
- ▲ 3.82%
- Metro
- Milwaukee-Waukesha, WI
- State GDP YoY
- ▲ 2.10%
- F500 in state
- 20
Industry mix (Fortune 500 HQ in WI)
| Industry | F500 HQs | Revenue |
|---|---|---|
| Industrial Machinery | 4 | $23B |
|
||
| Industrial Technology | 2 | $36B |
|
||
| Insurance | 1 | $36B |
|
||
| Professional Services | 1 | $19B |
|
||
| Utilities | 1 | $9B |
|
||
| Consumer Goods | 1 | $3B |
|
||
Price history
+12602.7% since first listed7 events — show timeline
- 2026-05-15 Price Changed $235,000 METROMLS
- 2026-03-13 Price Changed $245,000 METROMLS
- 2026-02-13 Listed $225,000 METROMLS
- 2024-04-10 Rental Removed $1,450 APPFOLIO
- 2024-04-04 Listed for Rent $1,450 APPFOLIO
- 2024-03-28 Rental Removed $1,850 APPFOLIO
- 2024-03-13 Listed for Rent $1,850 APPFOLIO
Cash-flow waterfall
monthlySold comps — $/sqft
last 12 mo · ≤1 miLoading sold comps…