 Fourplex
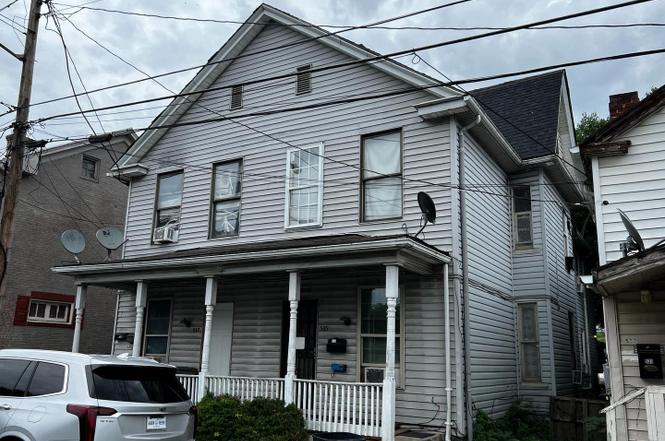
535-537 Roundhouse Way · Martinsburg, WV
Flood risk No data
- FEMA flood zone
- —
- Chance of flooding over 30 yrs
- —
- Est. flood insurance / yr
- —
Fire risk No data
- Est. fire insurance / yr
- —
Heat risk No data
- Hot days now (above threshold)
- —
- Hot days in 30 yrs
- —
Wind risk No data
- Chance of severe wind over 30 yrs
- —
Air-quality risk No data
- Unhealthy air days now
- —
- Unhealthy air days in 30 yrs
- —
Risk factors via First Street. Map © Google.
Why this score? — see what drove the B grade
The composite is a weighted blend of 9 inputs, each scored 0–100. Each bar is that input's sub-score; the figure is the points it added to the 100-point composite (weight × sub-score).
- Cash flow +30.0/30.0
- 1% rule +10.0/10.0
- DSCR +10.0/10.0
- ARV discount +7.5/15.0
- Rent growth +4.1/5.0
- Livability +3.8/5.0
- Schools +2.6/10.0
- Condition / age +2.5/5.0
- Appreciation +0.0/10.0
$370,000
🖨 Deal sheet (PDF) 📄 Offer letter ✓ Due diligence
Multi-family units
County records classify this as Multi-Family (2-4 Unit). Listing-text estimate: 4 units. confirmed
Listing remarks
Great opportunity to start into the rental business or bolster your current portfolio. This 4 unit building has separate water and electric metering. Washer & Dryer hook up in each unit. Each unit has 2 bedrooms in a spacious design. Each unit is rented at $900.00 to $1000.00 a month. Don't miss this opportunity. Property is 100% occupied and leases in place.
Key facts
- 4 unit building
- 100 percent occupied
- 0.25 acre lot
Tags
Property features AI
Finance
- Other: Ownership: Fee simple; Property condition: Average
- Financial info: Property sold/operated as 4-unit multifamily; Gross annual rental income listed as $45,600; Income source: apartment rentals; Operating expenses include trash and snow removal; Existing leases are month-to-month; No rent control
- HOA & community: Not specified
Exterior
- Parking: Total of 8 garage/parking spaces; Driveway with 4 spaces; 4 off-street spaces
- Security: Not specified
- Utilities: Public water; Public sewer; 200+ amp electric service; Cable TV available; DSL available; Fiber optic available; Phone service available; Municipal trash service
- Home design: Detached structure; Building not winterized
- Construction: Wood siding exterior; Stone foundation; Year built: (source: Assessor)
- Exterior features: Open lot; Above-grade and below-grade structures
Interior
- Kitchen: Refrigerator; Stove
- Bedrooms: Four 2-bedroom units (all leased month-to-month)
- Flooring: Not specified
- Bathrooms: Not specified
- Heating & cooling: Central A/C; Electric baseboard heating; Electric hot water
- Interior features: Traditional floor plan; Eat-in kitchen; Full basement
- Laundry & utility: Not specified
Neighborhood map
What this means for you Summary
Snapshot
- This is a 4 × 2-bed/?-bath units multifamily listed at $370k.
Deal economics
- At list price, monthly cash flow is $2k ($27k/yr) — positive. Per door: $570/mo.
- The deal already cash-flows at list — no discount required.
- Meets the 1% rule at list price ($6k rent vs $370k).
- Recommended offer: $326k (12.0% below list) — sets the bar for market timing.
- Cap rate 13.7% vs local median 4.0% in Martinsburg — top-decile yield for the area; either an underpriced asset or a hidden risk that comps aren't pricing in. Stress-test before assuming the spread holds.
Location & tenants
- Location reads 75/100 on livability (#29 in WV, #4,057 nationally) — a middle-class / working-renter tenant base. Strengths: amenities A+, cost of living A+, housing A+; Watch: commute F, employment D-.
- Berkeley County Schools (other): math 21% / reading 38% proficiency, ranked #24 of 55 in WV (top 44%) — low school quality limits family demand, transient renter base, plan for 1-2y turnover.
- Market conditions: Rents rising fast (+6.3%/yr); 109 active listings in the ZIP; 1,460 units permitted in Berkeley County in 2024 (16 in 5+ unit buildings).
- At $6,123/mo this rent would consume 104% of the median local household income ($71k/yr) (locally 833% of renters already pay >50% of income on rent) — very limited rent-growth headroom before tenants either downsize or default.
Forward outlook
- Local home prices are declining (-3.0%/yr); year-one equity from $3k of loan paydown is wiped out by about $11k of value loss. Plan a longer hold.
- Berkeley County population projected at +25% by 2050 — long-run rental-demand tailwind backs the buy-and-hold thesis.
- At projected returns (-3.0% appreciation + 6.3% rent growth), your $104k cash investment doubles in ~5 years — after that, you're playing with house money.
Negotiation context
- It's been on market 154 days — a 12% lower offer ($326k) is reasonable based on typical stale-listing flexibility.
Risks & watch-outs
- Watch-outs: built in 1920 — expect roof / HVAC / electrical / plumbing capex.
Questions for the listing agent
- It's been on market 154 days. Have you received any prior offers? Is the seller open to a 12% concession, seller financing, or rate buy-down credit?
- Can we see the unit-by-unit rent roll, current vacancy, and any below-market leases? What's the average tenancy length?
- What capital expenditures (roof, boiler, parking lot, exteriors) have been made in the last 5 years, and what's planned in the next 2?
- Built in 1920 — when were the roof, HVAC, electrical panel, plumbing, and water heater last replaced?
- Why hasn't it sold? Are there any deal-killer items the seller is aware of (foundation, flood, title, zoning, code violations)?
- Is there a deadline driving the sale (1031 exchange, divorce, estate, relocation)? That informs how much negotiation room exists.
- What's the average days-on-market for RENTAL listings here right now (not sales)? A rising rental-DOM trend means longer vacancies and softer asking-rent achievability than the comps imply.
- What's the recent tenant-quality profile in this submarket — average credit score on applications, eviction rate, late-payment / NSF rate, and stable-employment percentage? A property-management company in the area should have these aggregated.
- How much new apartment / multifamily construction is in the pipeline within 1–3 miles? Heavy new supply (>2% of stock underway) typically softens rents 12–24 months out; light construction supports rent growth.
Investment metrics
- 1% rule
- 1.65% ✓
- Cap rate
- 13.69%
- Cash-on-cash
- 26.41%
- DSCR
- 2.18
- GRM
- 5.0
CMA / ARV
No comps found within radius.
Projected returns pro-forma
-3.0% appreciation · 6.3% rent growth · sell at horizon
- IRR
- 23.9%
- Equity multiple
- 2.03×
- Total profit
- $106,365
- Equity at exit
- $55,168
- IRR
- 33.8%
- Equity multiple
- 4.59×
- Total profit
- $372,235
- Equity at exit
- $31,991
Cash invested: $103,600 (down + closing). Projections, not guarantees.
Landlord ↔ Tenant lean methodology
- Overall (STATE)
- 83 Strongly Landlord-Friendly
- State West Virginia
- 83 Strongly Landlord-Friendly · R+22
- County
- — inherits STATE
- City
- — inherits STATE
ZIP-level market 25404
- Home prices YoY
- -10.7%
- Rents YoY
- 6.3%
- Active inventory
- 109
- Price-to-rent
- 20.1×
Monthly cashflow live
- Estimated rent
- $6,123 medium interval (Pro) →
- Mortgage (P&I)
- −$1,940
- Tax est. 1.5%
- −$462 /mo · $5,550/yr
- Insurance
- −$154
- HOA
- −$0
- Vacancy / Maint / Mgmt
- −$1,286
- Net cashflow
- $2,280
Break-even live
Sensitivity live
| Price | -10% $2,536 | -5% $2,408 | +0% $2,280 | +5% $2,152 | +10% $2,024 |
|---|---|---|---|---|---|
| Rent | -10% $1,796 | -5% $2,038 | +0% $2,280 | +5% $2,522 | +10% $2,764 |
| Rate | -1.0pp $2,467 | -0.5pp $2,374 | base $2,280 | +0.5pp $2,184 | +1.0pp $2,087 |
4-unit breakdown (identical units grouped — click to expand)
| Units | Beds | Baths | Est. rent |
|---|---|---|---|
| 4× units | 2 | — | $6,124 |
| #1 | 2 | — | $1,531 |
| #2 | 2 | — | $1,531 |
| #3 | 2 | — | $1,531 |
| #4 | 2 | — | $1,531 |
| Total (4 units) | $6,123 | ||
UW: 25.0% down · 7.5% · 30yr · 1.5% tax · 5.0% vac · 8.0% maint · 8.0% mgmt
Financing live
Cash to close
- Down payment
- $92,500
- Closing costs
- $11,100
- Reserves months
- —
- Total cash needed
- —
Loan-product check · same deal, 3 products live
Conventional
25% down · 7.5% · 30yr
- Down + closing
- —
- Monthly P&I
- —
- Monthly cashflow
- —
- DSCR
- —
- Eligible?
- —
Personal DTI + credit; lowest rate.
DSCR
20% down · 8.5% · 30yr
- Down + closing
- —
- Monthly P&I
- —
- Monthly cashflow
- —
- DSCR
- —
- Eligible?
- —
No personal income docs; deal must DSCR.
Hard money
10% down · 12.0% · 12mo
- Down + closing
- —
- Monthly P&I
- —
- Monthly cashflow
- —
- DSCR
- —
- Eligible?
- —
Short-term bridge; refi at stabilization.
Listing history 15 events
-
2026-06-18days on market $370,000 Active 154 DOM
-
2026-06-17days on market $370,000 Active 153 DOM
-
2026-06-16days on market $370,000 Active 152 DOM
-
2026-06-15days on market $370,000 Active 151 DOM
-
2026-06-14days on market $370,000 Active 149 DOM
-
2026-06-13days on market $370,000 Active 148 DOM
-
2026-06-10days on market $370,000 Active 146 DOM
-
2026-06-09days on market $370,000 Active 145 DOM
-
2026-06-08days on market $370,000 Active 144 DOM
-
2026-06-07days on market $370,000 Active 143 DOM
-
2026-06-02days on market $370,000 Active 138 DOM
-
2026-06-01days on market $370,000 Active 137 DOM
-
2026-05-31days on market $370,000 Active 136 DOM
-
2026-05-30days on market $370,000 Active 135 DOM
-
2026-01-15$370,000 Active
ⓘ Source: listings_history table (triggers on properties + properties_extension) + one-shot
backfill from property_details.listing_events for pre-trigger history.
Nearby sold comps map
Loading sold comps map…
Walkable amenities ~0.75 mi
Loading nearby amenities…
Taxation est. · year 1
- Rental income
- $73,476
- − Mortgage interest
- −$20,726
- − Property taxes
- −$5,550
- − Insurance
- −$1,850
- − Repairs & maintenance
- −$5,878
- − Management
- −$5,878
- − Depreciation
- −$10,764
- Taxable income
- $22,830
- Est. tax owed @ 24.0%
- −$5,479
- After-tax cash flow
- $21,883/yr
For passive investors: Depreciation is non-cash, so a rental often shows a tax loss while cash-flowing — sheltering income. Rental losses are passive: they offset passive income freely, and up to $25,000/yr can offset ordinary (W-2) income if you actively participate and your MAGI is under $100k (phasing out to $0 by $150k); unused losses carry forward. On sale, claimed depreciation is recaptured at up to 25%, and gains may owe capital-gains tax (a 1031 exchange can defer both). Figures are a year-1 estimate at your 24.0% rate — not tax advice; consult a CPA.
Schools (NCES district)
- District
- Berkeley County Schools
- NCES district ID
- 5400060
- Math proficiency
- 21% ▼ -12.00%
- Reading proficiency
- 38% ▼ -6.00%
- Median HH income
- $54,599
- Composite
- 26.16/100
- National rank
- #7273
- State rank
- #24 of 55 in WV
Livability — Martinsburg
- Score
- 75/100
- State rank
- #29
- US rank
- #4057
Category grades
Schools grade is shown separately in the Schools card above.
Census & demographics
- County
- Berkeley County · 85,235 people
- City population
- 55,439
- Metro
- Hagerstown-Martinsburg, MD-WV
- Population (ZIP)
- 23,990
- Household income
- $70,633
- Rent vs Own
- Severe rent burden
- 833.0
Population outlook (Berkeley County) Hauer SSP2
- Today (2025)
- 127,359 people
- By 2030
- 134,684 · +5.8%
- By 2040
- 148,219 · +16.4%
- By 2050
- 159,300 · +25.1%
- By 2075
- 179,920 · +41.3%
- By 2100
- 183,896 · +44.4%
Race, ethnicity, and origin ACS 2023
- Neighborhood character
- Predominantly White (78%)
- Race & ethnicity
- White 78% Black 9% Two or more races 8% Hispanic / Latino 7% Asian 1%
- Hispanic origin (detail)
- Mexican 3% Puerto Rican 1%
- Common ancestry
- Slovak 3% Romanian 3% Italian 1%
- Foreign-born
- 6% · Canada, South Korea
- Languages at home
- 94% English-only · Spanish 5%
Political lean MEDSL · Berkeley
- 2024 margin
- Solid R (+35.8) · D 31.2% · R 67.0% · Other 1.8%
- 2008→2024 swing
- -22.8pp toward R · 2008: -13.0pp · 2024: -35.8pp
- All cycles
- 2024: R+35.8 2020: R+31.2 2016: R+37.2 2012: R+21.3 2008: R+13.0
Not yet ingested
- Civics
- —
Market trends
- HPI YoY
- ▼ -24.58%
- Current HPI
- 205.3277
- Rent YoY
- ▲ 6.30%
- Metro
- Hagerstown-Martinsburg, MD-WV
- State GDP YoY
- —
- F500 in state
- 0
Price history
1 event — show timeline
- 2026-01-15 Listed $370,000 BRIGHT MLS
Cash-flow waterfall
monthlySold comps — $/sqft
last 12 mo · ≤1 miLoading sold comps…