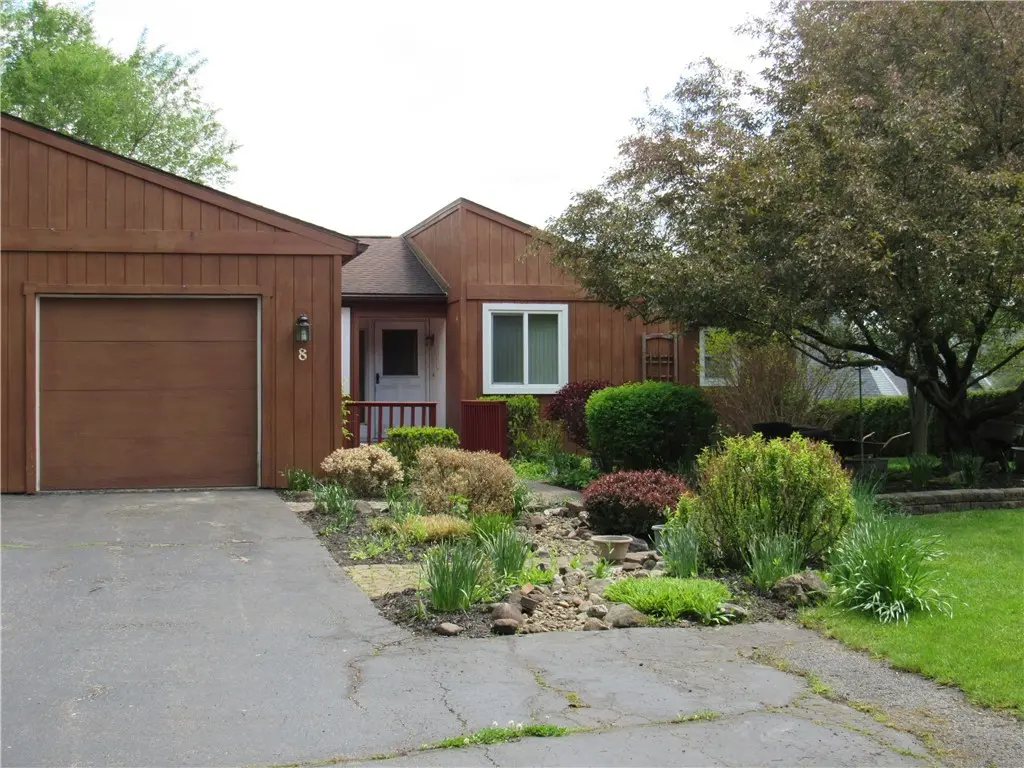
8 Hanningfield Cir · Fairport, NY
Flood risk 1/10 · Minimal
- FEMA flood zone
- X (unshaded)
- Chance of flooding over 30 yrs
- 0.0%
- Est. flood insurance / yr
- $473 – $860
Fire risk 4/10 · Minor
- Est. fire insurance / yr
- $691 – $1,283
Heat risk 2/10 · Minimal
- Hot days now (above 96°F)
- 7 days/yr
- Hot days in 30 yrs
- 16 days/yr
Wind risk 1/10 · Minimal
- Chance of severe wind over 30 yrs
- —
Air-quality risk 2/10 · Minimal
- Unhealthy air days now
- 1 days/yr
- Unhealthy air days in 30 yrs
- 1 days/yr
Risk factors via First Street. Map © Google.
Why this score? — see what drove the B- grade
The composite is a weighted blend of 9 inputs, each scored 0–100. Each bar is that input's sub-score; the figure is the points it added to the 100-point composite (weight × sub-score).
- Cash flow +25.1/30.0
- ARV discount +15.0/15.0
- DSCR +8.2/10.0
- 1% rule +7.2/10.0
- Schools +5.4/10.0
- Livability +3.7/5.0
- Condition / age +2.5/5.0
- Rent growth +2.3/5.0
- Appreciation +0.0/10.0
$199,900
🖨 Deal sheet (PDF) 📄 Offer letter ✓ Due diligence
Listing remarks
Welcome to 8 Hanningfield Circle. Meticulously maintained townhome owned by the same owner since its construction in 1977 - with no HOA fees! Pride of ownership is evident throughout, with numerous thoughtful upgrades completed over the years. This spacious home features 3 bedrooms and 3 full baths, along with a bright and inviting three-season room - perfect for relaxing or entertaining. All appliances are included for added convenience. Additional highlights include a spacious driveway for multiple vehicles, a one-car garage, and 200 amp electrical service. Step outside to enjoy a beautifully landscaped yard filled with stunning perennial gardens. OPEN HOUSE: Saturday, 5/23/26 from 12:00
Key facts
- Three season room
- Spacious driveway
- Garage
Tags
Property features AI
Finance
- HOA & community: Pets allowed: cats and dogs
Exterior
- Parking: Attached garage with 1 parking space; Open parking with garage door opener
- Utilities: Public water (connected); Sewer connected; Cable available; High-speed internet available
- Home design: Single-story home; Existing/resale property
- Construction: Cedar construction; Blown-in insulation; Asphalt shingle roof; Partial basement with sump pump; Basement present
- Exterior features: Deck; Patio; Located on a cul-de-sac; Rectangular residential lot; City street frontage
Interior
- Kitchen: Electric oven and electric range; Dishwasher; Garbage disposal; Refrigerator; Eat-in kitchen layout
- Bedrooms: Three main-level bedrooms
- Flooring: Carpet; Ceramic tile; Laminate; Vinyl; Varied flooring
- Bathrooms: Three full bathrooms (all on main level)
- Heating & cooling: Gas forced-air heating; Central air conditioning
- Interior features: Entrance foyer; Eat-in kitchen; Separate/formal living room; Country kitchen; Main level primary; Primary suite; Sunroom; Florida room
- Laundry & utility: Laundry in basement; Gas water heater; Dryer
Neighborhood map
What this means for you Summary
Snapshot
- This is a 3-bed/2.0-bath townhouse listed at $200k.
Deal economics
- At list price, monthly cash flow is $441 ($5k/yr) — positive.
- The deal already cash-flows at list — no discount required.
- Meets the 1% rule at list price ($2k rent vs $200k).
- Cap rate 8.9% vs local median 3.4% in Fairport — top-decile yield for the area; either an underpriced asset or a hidden risk that comps aren't pricing in. Stress-test before assuming the spread holds.
Location & tenants
- Location reads 74/100 on livability (#301 in NY, #4,847 nationally) — a middle-class / working-renter tenant base. Strengths: housing A+, health & safety A+, schools A; Watch: commute F.
- Fairport Central School District (suburban): math 55% / reading 66% proficiency, ranked #199 of 590 in NY (top 34%) — acceptable for families but not a draw, mixed tenant base, ~2y average lease; only 14% free/reduced lunch — higher-income household profile.
- Market conditions: Rents soft (-0.8%/yr); 186 active listings in the ZIP; 4 comparable units currently listed for rent nearby; rentals at typical pace (median 24d on market — plan ~3-4 weeks tenant-placement turnaround); solid renter incomes; 1,169 units permitted in Monroe County in 2024 (591 in 5+ unit buildings).
Forward outlook
- Local home prices are declining (-3.0%/yr); year-one equity from $1k of loan paydown is wiped out by about $6k of value loss. Plan a longer hold.
- Monroe County population projected to shrink 6% by 2050 — rents likely to lag national; underwrite the cash flow, not the appreciation.
Negotiation context
- Only 10 days on market — expect competitive offers; lowballing is unlikely to land.
Questions for the listing agent
- Built in 1977 — when were the roof, HVAC, electrical panel, plumbing, and water heater last replaced?
- Is there a deadline driving the sale (1031 exchange, divorce, estate, relocation)? That informs how much negotiation room exists.
- Schools are A-rated — typically a magnet for longer-tenancy family renters. What's the average tenant stay here, and is there a school-zone premium baked into asking?
- What's the average days-on-market for RENTAL listings here right now (not sales)? A rising rental-DOM trend means longer vacancies and softer asking-rent achievability than the comps imply.
- What's the recent tenant-quality profile in this submarket — average credit score on applications, eviction rate, late-payment / NSF rate, and stable-employment percentage? A property-management company in the area should have these aggregated.
- How much new for-sale + rental construction is in the pipeline within 1–3 miles? Heavy new supply typically softens prices + rents 12–24 months out; constrained supply supports both.
Investment metrics
- 1% rule
- 1.22% ✓
- Cap rate
- 8.94%
- Cash-on-cash
- 9.45%
- DSCR
- 1.42
- GRM
- 6.8
CMA / ARV
- ARV (on-the-fly)
- $243,664
- Comps found
- 12
Show comp detail 12 sales within ~0.75 mi
| Address | Dist | Beds/Ba | Sqft | Sold | Price | $/sf | Match |
|---|---|---|---|---|---|---|---|
| 27 Garrison Dr | 0.21mi | 3/1.5 | 1,214 (-3%) | 2mo | $225,000 | $185 | 81 |
| 24 Bucklebury Hl | 0.22mi | 3/1.5 | 1,240 (-1%) | 10mo | $235,000 | $190 | 78 |
| 8 Arbor Ct | 0.28mi | 3/1.5 | 1,200 (-4%) | 1mo | $257,000 | $214 | 76 |
| 26 Broxbourne Dr | 0.24mi | 2/2.0 (-1) | 1,200 (-4%) | 1mo | $295,000 | $246 | 76 |
| 4 Arbor Ct | 0.29mi | 3/1.5 | 1,200 (-4%) | 5mo | $210,000 | $175 | 73 |
| 41 Bucklebury Hl | 0.23mi | 3/1.5 | 1,248 (-1%) | 17mo | $220,000 | $176 | 72 |
| 9 Hollingham | 0.27mi | 3/1.5 | 1,345 (+7%) | 2mo | $241,000 | $179 | 72 |
| 47 Bucklebury Hl | 0.23mi | 3/1.5 | 1,144 (-9%) | 1mo | $231,000 | $202 | 71 |
| 9 Brimsdown Cir | 0.26mi | 2/2.5 (-1) | 1,332 (+6%) | 1mo | $305,000 | $229 | 70 |
| 4 Chesterton Ct | 0.42mi | 3/1.5 | 1,136 (-10%) | 0mo | $262,000 | $231 | 62 |
| 6 Canterbury Ct | 0.43mi | 2/1.5 (-1) | 1,168 (-7%) | 9mo | $195,000 | $167 | 54 |
| 6 Chesterton Ct | 0.43mi | 3/1.5 | 1,136 (-10%) | 18mo | $220,000 | $194 | 47 |
Match score weights: distance 35% · size 25% · config 20% · recency 20%. Top-matched comps best support the ARV.
Projected returns pro-forma
-3.0% appreciation · 0.0% rent growth · sell at horizon
- IRR
- -5.7%
- Equity multiple
- 0.80×
- Total profit
- $-11,389
- Equity at exit
- $29,806
- IRR
- -0.3%
- Equity multiple
- 0.98×
- Total profit
- $-1,071
- Equity at exit
- $17,284
Cash invested: $55,972 (down + closing). Projections, not guarantees.
Landlord ↔ Tenant lean methodology
- Overall (STATE)
- 15 Strongly Tenant-Friendly
- State New York
- 15 Strongly Tenant-Friendly · D+10
- County
- — inherits STATE
- City
- — inherits STATE
ZIP-level market 14450
- Rents YoY
- -0.8%
- Active inventory
- 186
- Price-to-rent
- 6.8×
Monthly cashflow live
- Estimated rent
- $2,449 medium interval (Pro) →
- Mortgage (P&I)
- −$1,048
- Tax from tax record
- −$362 /mo · $4,346/yr
- Insurance
- −$83
- HOA
- −$0
- Vacancy / Maint / Mgmt
- −$514
- Net cashflow
- $441
Break-even live
Sensitivity live
| Price | -10% $554 | -5% $497 | +0% $441 | +5% $384 | +10% $328 |
|---|---|---|---|---|---|
| Rent | -10% $247 | -5% $344 | +0% $441 | +5% $538 | +10% $634 |
| Rate | -1.0pp $541 | -0.5pp $492 | base $441 | +0.5pp $389 | +1.0pp $336 |
UW: 25.0% down · 7.5% · 30yr · 1.5% tax · 5.0% vac · 8.0% maint · 8.0% mgmt
Financing live
Cash to close
- Down payment
- $49,975
- Closing costs
- $5,997
- Reserves months
- —
- Total cash needed
- —
Loan-product check · same deal, 3 products live
Conventional
25% down · 7.5% · 30yr
- Down + closing
- —
- Monthly P&I
- —
- Monthly cashflow
- —
- DSCR
- —
- Eligible?
- —
Personal DTI + credit; lowest rate.
DSCR
20% down · 8.5% · 30yr
- Down + closing
- —
- Monthly P&I
- —
- Monthly cashflow
- —
- DSCR
- —
- Eligible?
- —
No personal income docs; deal must DSCR.
Hard money
10% down · 12.0% · 12mo
- Down + closing
- —
- Monthly P&I
- —
- Monthly cashflow
- —
- DSCR
- —
- Eligible?
- —
Short-term bridge; refi at stabilization.
Rent comps 4 comps
| Address | Beds | Baths | Sqft | Rent | $/sqft | DOM | Units | Dist |
|---|---|---|---|---|---|---|---|---|
| 131 Broxbourne Dr Fairport, NY | 3.0 | 2.0 | 1110 | $2,700 | $2.43 | 11d | 1 | 0.12mi |
| 166 High St Unit A Fairport, NY | 2.0 | 2.0 | 1600 | $2,300 | $1.44 | 44d | 1 | 0.59mi |
| 166 High St Unit B Fairport, NY | 2.0 | 1.5 | 1300 | $2,000 | $1.54 | 24d | 1 | 0.59mi |
| 100 Ezra Xing Fairport, NY | 2.0 | 2.0 | 1200 | $2,868 | $2.39 | 3d | 1 | 1.38mi |
Listing history 1 events
-
2026-05-18$199,900 Active
ⓘ Source: listings_history table (triggers on properties + properties_extension) + one-shot
backfill from property_details.listing_events for pre-trigger history.
Tax reassessment forecast NY · Partial reset (capped growth)
- Current annual tax
- $4,346 · $362/mo
- Projected year-2 tax
- $4,346 · $362/mo
- Expected delta
- $0/yr ($0/mo · 0.0%)
ⓘ Screening estimate from a state-policy table — verify with the county assessor before closing.
Climate risk First Street
- Flood 1/10 Low FEMA zone X (unshaded) · 0% chance over 30 yrs
- Wildfire 4/10 Moderate
- Heat 2/10 Low 7 d/yr ≥96°F today · 16 d/yr by 30 yrs out
- Wind 1/10 Low
- Air quality 2/10 Low 1 unhealthy d/yr today · 1 by 30 yrs out
Nearby sold comps map
Loading sold comps map…
Walkable amenities ~0.75 mi
Loading nearby amenities…
Taxation est. · year 1
- Rental income
- $29,385
- − Mortgage interest
- −$11,198
- − Property taxes
- −$4,346
- − Insurance
- −$1,000
- − Repairs & maintenance
- −$2,351
- − Management
- −$2,351
- − Depreciation
- −$5,815
- Taxable income
- $2,325
- Est. tax owed @ 24.0%
- −$558
- After-tax cash flow
- $4,731/yr
For passive investors: Depreciation is non-cash, so a rental often shows a tax loss while cash-flowing — sheltering income. Rental losses are passive: they offset passive income freely, and up to $25,000/yr can offset ordinary (W-2) income if you actively participate and your MAGI is under $100k (phasing out to $0 by $150k); unused losses carry forward. On sale, claimed depreciation is recaptured at up to 25%, and gains may owe capital-gains tax (a 1031 exchange can defer both). Figures are a year-1 estimate at your 24.0% rate — not tax advice; consult a CPA.
Schools (NCES district)
- District
- Fairport Central School District
- NCES district ID
- 3610890
- Math proficiency
- 55% ▼ -16.00%
- Reading proficiency
- 66% ▲ 3.00%
- Median HH income
- $74,981
- Composite
- 53.84/100
- National rank
- #1409
- State rank
- #199 of 590 in NY
Livability — Fairport
- Score
- 74/100
- State rank
- #301
- US rank
- #4847
Category grades
Schools grade is shown separately in the Schools card above.
Census & demographics
- County
- Monroe County · 674,131 people
- City population
- 42,750
- Metro
- Rochester, NY
- Population (ZIP)
- 42,750
- Household income
- $109,466
- Rent vs Own
- Severe rent burden
- 843.0
Population outlook (Monroe County) Hauer SSP2
- Today (2025)
- 759,460 people
- By 2030
- 757,154 · -0.3%
- By 2040
- 740,644 · -2.5%
- By 2050
- 714,443 · -5.9%
- By 2075
- 645,883 · -15.0%
- By 2100
- 547,084 · -28.0%
Race, ethnicity, and origin ACS 2023
- Neighborhood character
- Predominantly White (89%)
- Race & ethnicity
- White 89% Two or more races 5% Hispanic / Latino 3% Asian 2% Black 2%
- Common ancestry
- Romanian 6% Lithuanian 2% Iranian 2%
- Foreign-born
- 6% · Canada, China, South Korea
- Languages at home
- 94% English-only · Other Indo-European 1% Spanish 1% Other Asian/Pacific 1%
Political lean MEDSL · Monroe
- 2024 margin
- D (+19.1) · D 59.5% · R 40.5%
- 2008→2024 swing
- +1.4pp toward D · 2008: 17.7pp · 2024: 19.1pp
- All cycles
- 2024: D+19.1 2020: D+21.0 2016: D+14.1 2012: D+17.4 2008: D+17.7
Not yet ingested
- Civics
- —
Market trends
- HPI YoY
- ▼ -189.56%
- Current HPI
- 270.7329
- Rent YoY
- ▼ -0.84%
- Metro
- Rochester, NY
- State GDP YoY
- ▲ 2.60%
- F500 in state
- 92
Industry mix (Fortune 500 HQ in NY)
| Industry | F500 HQs | Revenue |
|---|---|---|
| Financial Services | 10 | $950B |
|
||
| Consumer Goods | 9 | $162B |
|
||
| Insurance | 4 | $225B |
|
||
| Telecommunications | 2 | $144B |
|
||
| Pharmaceuticals | 2 | $112B |
|
||
| Media / Entertainment | 2 | $69B |
|
||
Price history
1 event — show timeline
- 2026-05-18 Listed $199,900 UNYREIS
Property tax history
+15.0%/yrLatest (2025): $4,346 · +52.6% YoY. Source: county tax records.
Cash-flow waterfall
monthlySold comps — $/sqft
last 12 mo · ≤1 miLoading sold comps…