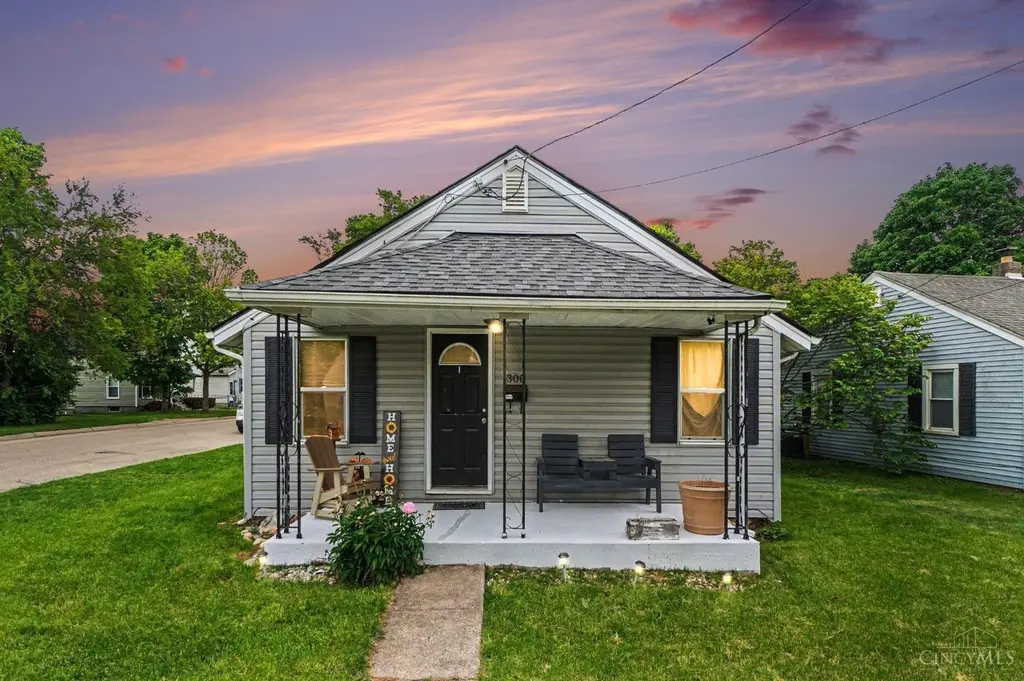
300 S First St · Trenton, OH
Flood risk 4/10 · Minor
- FEMA flood zone
- X (unshaded)
- Chance of flooding over 30 yrs
- 0.22%
- Est. flood insurance / yr
- $473 – $860
Fire risk 1/10 · Minimal
- Est. fire insurance / yr
- $713 – $1,323
Heat risk 4/10 · Minor
- Hot days now (above 103°F)
- 7 days/yr
- Hot days in 30 yrs
- 19 days/yr
Wind risk 2/10 · Minimal
- Chance of severe wind over 30 yrs
- 1.0%
Air-quality risk 2/10 · Minimal
- Unhealthy air days now
- 1 days/yr
- Unhealthy air days in 30 yrs
- 2 days/yr
Risk factors via First Street. Map © Google.
Why this score? — see what drove the D+ grade
The composite is a weighted blend of 9 inputs, each scored 0–100. Each bar is that input's sub-score; the figure is the points it added to the 100-point composite (weight × sub-score).
- Cash flow +17.8/30.0
- ARV discount +7.2/15.0
- DSCR +5.6/10.0
- Schools +4.4/10.0
- 1% rule +4.0/10.0
- Livability +3.7/5.0
- Rent growth +2.5/5.0
- Condition / age +2.5/5.0
- Appreciation +0.0/10.0
$189,900
🖨 Deal sheet (PDF) 📄 Offer letter ✓ Due diligence
Listing remarks MLS
Waiting for you!! Renovated in 2016, this 2 bed, 2/fenced yard is ready for it's new owner. All appliances included so you can move right in! Carpet replaced 2020.
Key facts
- 4,356 sq ft lot
- Built 1933
- Listed 42 days
Property features AI
Finance
- Other: Lease not considered
- HOA & community: No homeowners association
Exterior
- Utilities: Water at street; Sewer at street; Gas at street
- Home design: Ranch-style single-family home; One level; Stone foundation
- Construction: Vinyl siding
- Exterior features: Vinyl windows; Shingle roof
Interior
- Kitchen: Kitchen approximately 15 x 12
- Bedrooms: Two bedrooms, each about 12 x 12
- Bathrooms: One full bathroom on the main level
- Heating & cooling: Forced-air heating (gas); Central air conditioning; Gas water heater
- Interior features: Full basement; Total of 5 rooms
Neighborhood map
What this means for you Summary
Snapshot
- This is a 3-bed/1.0-bath single-family listed at $190k.
Deal economics
- At list price, monthly cash flow is $156 ($2k/yr) — positive.
- The deal already cash-flows at list — no discount required.
- To meet the 1% rule (rent ≥ 1% of price), the offer needs to be $171k (9.7% below list).
- Recommended offer: $171k (9.7% below list) — sets the bar for 1% rule.
- Cap rate 7.3% vs local median 3.7% in Trenton — top-decile yield for the area; either an underpriced asset or a hidden risk that comps aren't pricing in. Stress-test before assuming the spread holds.
Location & tenants
- Location reads 74/100 on livability (#282 in OH, #4,633 nationally) — a middle-class / working-renter tenant base. Strengths: crime A+, employment A+, cost of living A+; Watch: amenities F, commute F, health & safety F.
- Edgewood City (rural): math 43% / reading 57% proficiency, ranked #427 of 656 in OH (top 65%) — acceptable for families but not a draw, mixed tenant base, ~2y average lease.
- Market conditions: 65 active listings in the ZIP; 8 comparable units currently listed for rent nearby; rentals at typical pace (median 24d on market — plan ~3-4 weeks tenant-placement turnaround); solid renter incomes; 1,163 units permitted in Butler County in 2024 (356 in 5+ unit buildings).
Forward outlook
- Local home prices are declining (-3.0%/yr); year-one equity from $1k of loan paydown is wiped out by about $6k of value loss. Plan a longer hold.
Negotiation context
- It's been on market 42 days — a 3% lower offer ($184k) is reasonable based on typical stale-listing flexibility.
- 9 sale attempts since 28y ago; this cycle's ask has dropped $10k (5%) from the opening price — seller is motivated, your offer sets the floor, not the list.
- Current owner paid $96k; list at $190k implies a 98% gain — meaningful room to come down on a strong offer.
Risks & watch-outs
- Watch-outs: built in 1933 — expect roof / HVAC / electrical / plumbing capex.
Questions for the listing agent
- It's been on market 42 days. Have you received any prior offers? Is the seller open to a 10% concession, seller financing, or rate buy-down credit?
- Built in 1933 — when were the roof, HVAC, electrical panel, plumbing, and water heater last replaced?
- Is there a deadline driving the sale (1031 exchange, divorce, estate, relocation)? That informs how much negotiation room exists.
- Schools are B-rated — typically a magnet for longer-tenancy family renters. What's the average tenant stay here, and is there a school-zone premium baked into asking?
- The area grade is low — what's the realistic commute time and amenity access for the typical tenant pool here? Any planned neighborhood developments (good or bad) we should know about?
- What's the average days-on-market for RENTAL listings here right now (not sales)? A rising rental-DOM trend means longer vacancies and softer asking-rent achievability than the comps imply.
- What's the recent tenant-quality profile in this submarket — average credit score on applications, eviction rate, late-payment / NSF rate, and stable-employment percentage? A property-management company in the area should have these aggregated.
- How much new for-sale + rental construction is in the pipeline within 1–3 miles? Heavy new supply typically softens prices + rents 12–24 months out; constrained supply supports both.
Investment metrics
- 1% rule
- 0.90% ✗
- Cap rate
- 7.28%
- Cash-on-cash
- 3.51%
- DSCR
- 1.16
- GRM
- 9.2
CMA / ARV
- ARV (median comp)
- $188,578
- List price
- $189,900
- Delta
- 0.70%
- Verdict
- FAIR
- Comps
- 20 within 1.0 mi
Show comp detail 12 sales within ~0.75 mi
| Address | Dist | Beds/Ba | Sqft | Sold | Price | $/sf | Match |
|---|---|---|---|---|---|---|---|
| 117 Ohio Ave | 0.05mi | 3/1.0 | 1,008 (+2%) | 2mo | $75,000 | $74 | 92 |
| 310 S First St | 0.05mi | 3/2.0 | 1,008 (+2%) | 10mo | $238,000 | $236 | 81 |
| 427 Madison Ave | 0.29mi | 3/1.0 | 1,008 (+2%) | 13mo | $205,000 | $203 | 72 |
| 203 Gwen Ln | 0.29mi | 3/1.0 | 1,008 (+2%) | 15mo | $229,900 | $228 | 70 |
| 423 E State St | 0.34mi | 3/1.0 | 966 (-2%) | 14mo | $100,000 | $104 | 69 |
| 417 Kerry St | 0.46mi | 3/2.0 | 960 (-2%) | 2mo | $170,000 | $177 | 68 |
| 207 Center St | 0.08mi | 2/2.0 (-1) | 960 (-2%) | 18mo | $211,000 | $220 | 68 |
| 109 W Home Ave | 0.15mi | 3/1.0 | 1,104 (+12%) | 7mo | $169,000 | $153 | 67 |
| 317 Linda Ct | 0.34mi | 3/1.0 | 1,040 (+6%) | 11mo | $239,900 | $231 | 66 |
| 303 Kerry St | 0.33mi | 2/1.5 (-1) | 960 (-2%) | 12mo | $225,000 | $234 | 64 |
| 104 Burke St | 0.21mi | 3/2.0 | 1,056 (+7%) | 16mo | $210,000 | $199 | 61 |
| 707 Nathan Dr | 0.59mi | 3/2.0 | 1,092 (+11%) | 7mo | $235,000 | $215 | 44 |
Match score weights: distance 35% · size 25% · config 20% · recency 20%. Top-matched comps best support the ARV.
Projected returns pro-forma
-3.0% appreciation · 3.0% rent growth · sell at horizon
- IRR
- -10.8%
- Equity multiple
- 0.61×
- Total profit
- $-20,898
- Equity at exit
- $28,315
- IRR
- -1.5%
- Equity multiple
- 0.89×
- Total profit
- $-5,604
- Equity at exit
- $16,419
Cash invested: $53,172 (down + closing). Projections, not guarantees.
Landlord ↔ Tenant lean methodology
- Overall (STATE)
- 73 Landlord-Friendly
- State Ohio
- 73 Landlord-Friendly · R+6
- County
- — inherits STATE
- City
- — inherits STATE
ZIP-level market 45067
- Active inventory
- 65
- Price-to-rent
- 9.2×
Monthly cashflow live
- Estimated rent
- $1,715 high interval (Pro) →
- Mortgage (P&I)
- −$996
- Tax from tax record
- −$124 /mo · $1,490/yr
- Insurance
- −$79
- HOA
- −$0
- Vacancy / Maint / Mgmt
- −$360
- Net cashflow
- $156
Break-even live
Sensitivity live
| Price | -10% $263 | -5% $209 | +0% $156 | +5% $102 | +10% $48 |
|---|---|---|---|---|---|
| Rent | -10% $20 | -5% $88 | +0% $156 | +5% $223 | +10% $291 |
| Rate | -1.0pp $251 | -0.5pp $204 | base $156 | +0.5pp $107 | +1.0pp $56 |
UW: 25.0% down · 7.5% · 30yr · 1.5% tax · 5.0% vac · 8.0% maint · 8.0% mgmt
Financing live
Cash to close
- Down payment
- $47,475
- Closing costs
- $5,697
- Reserves months
- —
- Total cash needed
- —
Loan-product check · same deal, 3 products live
Conventional
25% down · 7.5% · 30yr
- Down + closing
- —
- Monthly P&I
- —
- Monthly cashflow
- —
- DSCR
- —
- Eligible?
- —
Personal DTI + credit; lowest rate.
DSCR
20% down · 8.5% · 30yr
- Down + closing
- —
- Monthly P&I
- —
- Monthly cashflow
- —
- DSCR
- —
- Eligible?
- —
No personal income docs; deal must DSCR.
Hard money
10% down · 12.0% · 12mo
- Down + closing
- —
- Monthly P&I
- —
- Monthly cashflow
- —
- DSCR
- —
- Eligible?
- —
Short-term bridge; refi at stabilization.
Rent comps 8 comps
| Address | Beds | Baths | Sqft | Rent | $/sqft | DOM | Units | Dist |
|---|---|---|---|---|---|---|---|---|
| 227 Linda Ct Trenton, OH | 2.0 | 1.0 | 941 | $980 | $1.04 | 24d | 1 | 0.20mi |
| 101 Keith Ave Trenton, OH | 3.0 | 1.0 | 1057 | $1,600 | $1.51 | 2d | 1 | 0.26mi |
| 406 Sal Blvd Trenton, OH | 2.0 | 1.5 | 1100 | $1,330 | $1.21 | 8d | 1 | 0.48mi |
| 406 Sal Blvd Trenton, OH | 3.0 | 2.0 | 1115 | $1,500 | $1.35 | 44d | 1 | 0.48mi |
| 408 Mars Dr Trenton, OH | 3.0 | 2.0 | 1000 | $1,380 | $1.38 | 8d | 1 | 0.51mi |
| 104 Poplin Pl Unit 1 Trenton, OH | 2.0 | 1.5 | 1100 | $1,075 | $0.98 | 45d | 1 | 0.55mi |
| 417 Sal Blvd Trenton, OH | 3.0 | 2.0 | 1000 | $1,530 | $1.53 | 2d | 1 | 0.58mi |
| 476 Peyton Dr Trenton, OH | 3.0 | 1.0 | 1008 | $1,731 | $1.72 | 24d | 1 | 0.61mi |
Listing history 41 events
-
2026-06-18days on market $189,900 Active 42 DOM
-
2026-06-17days on market $189,900 Active 41 DOM
-
2026-06-16days on market $189,900 Active 40 DOM
-
2026-06-15days on market $189,900 Active 39 DOM
-
2026-06-13days on market $189,900 Active 37 DOM
-
2026-06-09days on market $189,900 Active 33 DOM
-
2026-06-08days on market $189,900 Active 32 DOM
-
2026-06-07days on market $189,900 Active 31 DOM
-
2026-06-05days on market $189,900 Active 28 DOM
-
2026-06-03days on market $189,900 Active 27 DOM
-
2026-06-02pricedays on market $189,900 Active 26 DOM
-
2026-06-01days on market $200,000 Active 25 DOM
-
2026-06-01status $200,000 Active 24 DOM
-
2026-05-31days on market $200,000 Contingency Pending 24 DOM
-
2026-05-08$200,000 Active 208-char remark
-
2020-08-18soldstatus $96,000
-
2020-08-12soldstatus $96,000 Sold 163-char remark
Show marketing remark (163 chars)
Waiting for you!! Renovated in 2016, this 2 bed, 2/fenced yard is ready for it's new owner. All appliances included so you can move right in! Carpet replaced 2020.
-
2020-07-20historical Contingency Pending 163-char remark
Show marketing remark (163 chars)
Waiting for you!! Renovated in 2016, this 2 bed, 2/fenced yard is ready for it's new owner. All appliances included so you can move right in! Carpet replaced 2020.
-
2020-07-16$92,000 Active 163-char remark
Show marketing remark (163 chars)
Waiting for you!! Renovated in 2016, this 2 bed, 2/fenced yard is ready for it's new owner. All appliances included so you can move right in! Carpet replaced 2020.
-
2016-06-21historical
-
2016-03-17$64,900 Active
-
2016-03-15historical
-
2016-02-25price $66,000
-
2016-02-17price $68,500
-
2016-01-26price $68,800
-
2015-10-21price $68,900
-
2015-09-18$69,900 Active
-
2015-06-26soldstatus $32,000 Sold
-
2015-06-12historical Accept Backup Offers
-
2014-12-05$42,500 Active
-
2007-07-20historical
-
2007-06-01$87,900
-
2006-07-07soldstatus $76,000
-
2006-05-01soldstatus $43,600
-
2006-01-26$44,900
-
1999-01-11soldstatus $69,500
-
1998-12-31soldstatus $69,500
-
1998-11-05$69,900
-
1993-07-29soldstatus $52,500
-
1992-05-22soldstatus $44,500
-
1992-03-03soldstatus $24,488
ⓘ Source: listings_history table (triggers on properties + properties_extension) + one-shot
backfill from property_details.listing_events for pre-trigger history.
Tax reassessment forecast OH · Partial reset (capped growth)
- Current annual tax
- $1,490 · $124/mo
- Projected year-2 tax
- $2,226 · $186/mo
- Expected delta
- +$736/yr (+$61/mo · 49.4%)
ⓘ Screening estimate from a state-policy table — verify with the county assessor before closing.
Climate risk First Street
- Flood 4/10 Moderate FEMA zone X (unshaded) · 22% chance over 30 yrs
- Wildfire 1/10 Low
- Heat 4/10 Moderate 7 d/yr ≥103°F today · 19 d/yr by 30 yrs out
- Wind 2/10 Low 100% chance of damaging wind over 30 yrs
- Air quality 2/10 Low 1 unhealthy d/yr today · 2 by 30 yrs out
Nearby sold comps map
Loading sold comps map…
Walkable amenities ~0.75 mi
Loading nearby amenities…
Taxation est. · year 1
- Rental income
- $20,580
- − Mortgage interest
- −$10,637
- − Property taxes
- −$1,490
- − Insurance
- −$950
- − Repairs & maintenance
- −$1,646
- − Management
- −$1,646
- − Depreciation
- −$5,524
- Taxable loss
- −$1,314
- Est. tax savings @ 24.0%
- +$315
- After-tax cash flow
- $2,184/yr
For passive investors: Depreciation is non-cash, so a rental often shows a tax loss while cash-flowing — sheltering income. Rental losses are passive: they offset passive income freely, and up to $25,000/yr can offset ordinary (W-2) income if you actively participate and your MAGI is under $100k (phasing out to $0 by $150k); unused losses carry forward. On sale, claimed depreciation is recaptured at up to 25%, and gains may owe capital-gains tax (a 1031 exchange can defer both). Figures are a year-1 estimate at your 24.0% rate — not tax advice; consult a CPA.
Schools (NCES district)
- District
- Edgewood City
- NCES district ID
- 3904609
- Math proficiency
- 43% ▼ -21.00%
- Reading proficiency
- 57% ▼ -12.00%
- Median HH income
- $58,971
- Composite
- 43.59/100
- National rank
- #2975
- State rank
- #427 of 656 in OH
Livability — Trenton
- Score
- 74/100
- State rank
- #282
- US rank
- #4633
Category grades
Schools grade is shown separately in the Schools card above.
Census & demographics
- Census place
- Trenton, OH
- County
- Butler County · 381,674 people
- City population
- 15,471
- Metro
- Cincinnati, OH-KY-IN
- Population (ZIP)
- 15,471
- Household income
- $81,605
- Rent vs Own
- Severe rent burden
- 237.0
Population outlook (Butler County) Hauer SSP2
- Today (2025)
- 387,706 people
- By 2030
- 392,028 · +1.1%
- By 2040
- 395,307 · +2.0%
- By 2050
- 391,116 · +0.9%
- By 2075
- 378,642 · -2.3%
- By 2100
- 343,248 · -11.5%
Race, ethnicity, and origin ACS 2023
- Neighborhood character
- Predominantly White (96%)
- Race & ethnicity
- White 96% Two or more races 2% Hispanic / Latino 2%
- Common ancestry
- Slovak 3% Lithuanian 2% German 1%
- Foreign-born
- 2% · Canada
- Languages at home
- 98% English-only · Spanish 1% Arabic 1%
Political lean MEDSL · Butler
- 2024 margin
- Strong R (+26.3) · D 36.4% · R 62.7%
- 2008→2024 swing
- -3.6pp toward R · 2008: -22.6pp · 2024: -26.3pp
- All cycles
- 2024: R+26.3 2020: R+24.0 2016: R+28.3 2012: R+26.2 2008: R+22.6
Not yet ingested
- Civics
- —
Market trends
- HPI YoY
- ▼ -160.89%
- Current HPI
- 238.256
- Rent YoY
- —
- Metro
- Cincinnati, OH-KY-IN
- State GDP YoY
- ▲ 1.98%
- F500 in state
- 48
Industry mix (Fortune 500 HQ in OH)
| Industry | F500 HQs | Revenue |
|---|---|---|
| Insurance | 3 | $145B |
|
||
| Industrial Machinery | 3 | $49B |
|
||
| Financial Services | 3 | $24B |
|
||
| Consumer Goods | 2 | $93B |
|
||
| Aerospace / Defense | 2 | $47B |
|
||
| Utilities | 2 | $33B |
|
||
Price history
+675.5% since first listed30 events — show timeline
- 2026-06-02 Price Changed $189,900 Cincy MLS
- 2026-05-31 Relisted — Cincy MLS
- 2026-05-24 Contingent — Cincy MLS
- 2026-05-08 Listed $200,000 Cincy MLS
- 2020-08-18 Sold (Public Records) $96,000 Public Records
- 2020-08-12 Sold (MLS) $96,000 Cincy MLS
- 2020-07-20 Contingent — Cincy MLS
- 2020-07-16 Listed $92,000 Cincy MLS
- 2016-06-21 Listing Removed — Cincy MLS
- 2016-03-17 Listed $64,900 Cincy MLS
- 2016-03-15 Listing Removed — Cincy MLS
- 2016-02-25 Price Changed $66,000 Cincy MLS
- 2016-02-17 Price Changed $68,500 Cincy MLS
- 2016-01-26 Price Changed $68,800 Cincy MLS
- 2015-10-21 Price Changed $68,900 Cincy MLS
- 2015-09-18 Listed $69,900 Cincy MLS
- 2015-06-26 Sold (MLS) $32,000 Cincy MLS
- 2015-06-12 Contingent — Cincy MLS
- 2014-12-05 Listed $42,500 Cincy MLS
- 2007-07-20 Listing Removed — Cincy MLS
- 2007-06-01 Listed $87,900 Cincy MLS
- 2006-07-07 Sold (Public Records) $76,000 Public Records
- 2006-05-01 Sold (MLS) $43,600 Cincy MLS
- 2006-01-26 Listed $44,900 Cincy MLS
- 1999-01-11 Sold (Public Records) $69,500 Public Records
- 1998-12-31 Sold (MLS) $69,500 Cincy MLS
- 1998-11-05 Listed $69,900 Cincy MLS
- 1993-07-29 Sold (Public Records) $52,500 Public Records
- 1992-05-22 Sold (Public Records) $44,500 Public Records
- 1992-03-03 Sold (Public Records) $24,488 Public Records
Property tax history
-11.5%/yrLatest (2025): $1,490 · -0.5% YoY. Source: county tax records.
Cash-flow waterfall
monthlySold comps — $/sqft
last 12 mo · ≤1 miLoading sold comps…