 Duplex
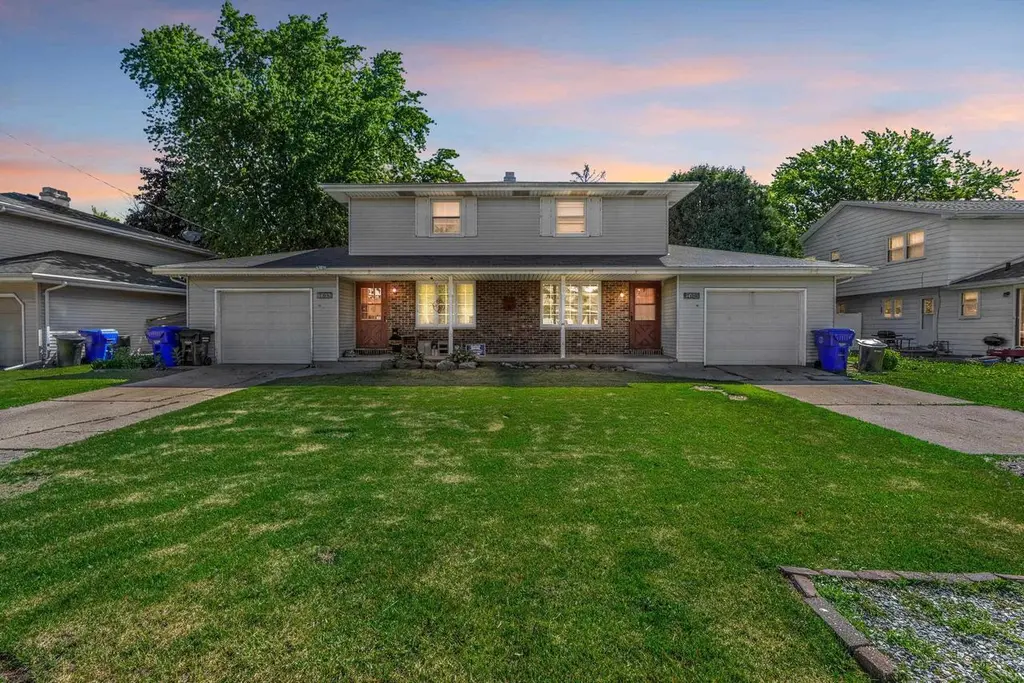
706 N Hawthorne Dr · Appleton, WI
Flood risk No data
- FEMA flood zone
- —
- Chance of flooding over 30 yrs
- %
- Est. flood insurance / yr
- —
Fire risk No data
- Est. fire insurance / yr
- —
Heat risk No data
- Hot days now (above °F)
- days/yr
- Hot days in 30 yrs
- days/yr
Wind risk No data
- Chance of severe wind over 30 yrs
- %
Air-quality risk No data
- Unhealthy air days now
- days/yr
- Unhealthy air days in 30 yrs
- days/yr
Risk factors via First Street. Map © Google.
Why this score? — see what drove the D+ grade
The composite is a weighted blend of 9 inputs, each scored 0–100. Each bar is that input's sub-score; the figure is the points it added to the 100-point composite (weight × sub-score).
- Cash flow +23.7/30.0
- DSCR +7.6/10.0
- 1% rule +6.2/10.0
- Livability +4.1/5.0
- Schools +3.0/10.0
- Rent growth +2.5/5.0
- Condition / age +2.5/5.0
- ARV discount +0.0/15.0
- Appreciation +0.0/10.0
$349,900
🖨 Deal sheet 📄 Offer letter ✓ Due diligence
Listing remarks
Fantastic duplex opportunity in Appleton! Whether you're looking to expand your investment portfolio or occupy one unit while generating rental income, this property offers excellent potential. Conveniently located near parks, restaurants, and the Fox River, it provides easy access to local amenities and recreation. Each unit features 2 bedrooms, 1 bathroom, 1 half-bathroom with an attached 1-car garage for added convenience. With strong versatility and plenty of possibilities, this duplex is a great opportunity for owner-occupants and investors alike. Also available as a package w/ (Duplexes) 1427 College Ave and 1633 Weiland Ln in Appleton. Open houses: June 20, 11am-12pm and June 24, 3-4
Key facts
- Attached garage
- Near restaurants
- Near parks
Tags
Neighborhood map
What this means for you Summary
Snapshot
- This is a 2 × 2-bed/1.8-bath units multifamily listed at $350k.
Deal economics
- At list price, monthly cash flow is $666 ($8k/yr) — positive. Per door: $333/mo.
- The deal already cash-flows at list — no discount required.
- Meets the 1% rule at list price ($4k rent vs $350k).
- Cap rate 8.6% vs local median 3.8% in Appleton — top-decile yield for the area; either an underpriced asset or a hidden risk that comps aren't pricing in. Stress-test before assuming the spread holds.
Location & tenants
- Location reads 82/100 on livability (#44 in WI, #1,073 nationally) — a professional / high-income tenant draw. Strengths: commute A+, cost of living A+, housing A+; Watch: amenities C-.
- Appleton Area School District (urban): math 33% / reading 36% proficiency, ranked #224 of 342 in WI (top 66%) — families likely to look elsewhere, expect single-tenant / working-renter base with shorter leases.
- Market conditions: 71 active listings in the ZIP; 2 comparable units currently listed for rent nearby; solid renter incomes; 460 units permitted in Outagamie County in 2024 (30 in 5+ unit buildings).
- At $3,904/mo this rent would consume 54% of the median local household income ($87k/yr) (locally 684% of renters already pay >50% of income on rent) — very limited rent-growth headroom before tenants either downsize or default.
Forward outlook
- Local home prices are declining (-3.0%/yr); year-one equity from $2k of loan paydown is wiped out by about $10k of value loss. Plan a longer hold.
- Outagamie County population projected at +8% by 2050 — modest demand growth; plan on rents tracking national, not racing it.
Negotiation context
- Only 1 days on market — expect competitive offers; lowballing is unlikely to land.
Questions for the listing agent
- Can we see the unit-by-unit rent roll, current vacancy, and any below-market leases? What's the average tenancy length?
- What capital expenditures (roof, boiler, parking lot, exteriors) have been made in the last 5 years, and what's planned in the next 2?
- Built in 1972 — when were the roof, HVAC, electrical panel, plumbing, and water heater last replaced?
- Is there a deadline driving the sale (1031 exchange, divorce, estate, relocation)? That informs how much negotiation room exists.
- The area grade is low — what's the realistic commute time and amenity access for the typical tenant pool here? Any planned neighborhood developments (good or bad) we should know about?
- What's the average days-on-market for RENTAL listings here right now (not sales)? A rising rental-DOM trend means longer vacancies and softer asking-rent achievability than the comps imply.
- What's the recent tenant-quality profile in this submarket — average credit score on applications, eviction rate, late-payment / NSF rate, and stable-employment percentage? A property-management company in the area should have these aggregated.
- How much new apartment / multifamily construction is in the pipeline within 1–3 miles? Heavy new supply (>2% of stock underway) typically softens rents 12–24 months out; light construction supports rent growth.
Investment metrics
- 1% rule
- 1.12% ✓
- Cap rate
- 8.58%
- Cash-on-cash
- 8.16%
- DSCR
- 1.36
- GRM
- 7.5
CMA / ARV
- ARV (on-the-fly)
- $288,144
- Comps found
- 1
Show comp detail 1 sale within ~0.75 mi
| Address | Dist | Beds/Ba | Sqft | Sold | Price | $/sf | Match |
|---|---|---|---|---|---|---|---|
| 3601 Crestview Dr | 0.12mi | 4/2.5 | 2,508 (+1%) | 16mo | $290,000 | $116 | 75 |
Match score weights: distance 35% · size 25% · config 20% · recency 20%. Top-matched comps best support the ARV.
Projected returns pro-forma
-3.0% appreciation · 3.0% rent growth · sell at horizon
- IRR
- -3.9%
- Equity multiple
- 0.85×
- Total profit
- $-14,217
- Equity at exit
- $52,171
- IRR
- 5.8%
- Equity multiple
- 1.43×
- Total profit
- $42,486
- Equity at exit
- $30,253
Cash invested: $97,972 (down + closing). Projections, not guarantees.
Landlord ↔ Tenant lean methodology
- Overall (STATE)
- 73 Landlord-Friendly
- State Wisconsin
- 73 Landlord-Friendly · R+2
- County
- — inherits STATE
- City
- — inherits STATE
ZIP-level market 54915
- Active inventory
- 71
- Price-to-rent
- 14.9×
Monthly cashflow live
- Estimated rent
- $3,904 medium interval (Pro) →
- Mortgage (P&I)
- −$1,835
- Tax est. 1.5%
- −$437 /mo · $5,248/yr
- Insurance
- −$146
- HOA
- −$0
- Vacancy / Maint / Mgmt
- −$820
- Net cashflow
- $666
Break-even live
2-unit breakdown (identical units grouped — click to expand)
| Units | Beds | Baths | Est. rent |
|---|---|---|---|
| 2× units | 2 | 1.8 | $3,904 |
| #1 | 2 | 1.8 | $1,952 |
| #2 | 2 | 1.8 | $1,952 |
| Total (2 units) | $3,904 | ||
UW: 25.0% down · 7.5% · 30yr · 1.5% tax · 5.0% vac · 8.0% maint · 8.0% mgmt
Financing live
Cash to close
- Down payment
- $87,475
- Closing costs
- $10,497
- Reserves months
- —
- Total cash needed
- —
Loan-product check · same deal, 3 products live
Conventional
25% down · 7.5% · 30yr
- Down + closing
- —
- Monthly P&I
- —
- Monthly cashflow
- —
- DSCR
- —
- Eligible?
- —
Personal DTI + credit; lowest rate.
DSCR
20% down · 8.5% · 30yr
- Down + closing
- —
- Monthly P&I
- —
- Monthly cashflow
- —
- DSCR
- —
- Eligible?
- —
No personal income docs; deal must DSCR.
Hard money
10% down · 12.0% · 12mo
- Down + closing
- —
- Monthly P&I
- —
- Monthly cashflow
- —
- DSCR
- —
- Eligible?
- —
Short-term bridge; refi at stabilization.
Rent comps 2 comps
| Address | Beds | Baths | Sqft | Rent | $/sqft | DOM | Units | Dist |
|---|---|---|---|---|---|---|---|---|
| W3183 Westowne Ct Appleton, WI | 3.0 | 2.0 | 1695 | $1,875 | $1.11 | 13d | 1 | 1.28mi |
| N307 Eastowne Ct Unit 1061648P Appleton, WI | 3.0 | 2.0 | 1743 | $8,165 | $4.68 | 20d | 1 | 1.34mi |
Listing history 2 events
-
2026-06-19remarks 699-char remark
-
2026-06-19$349,900 Active 1 DOM
ⓘ Source: listings_history table (triggers on properties + properties_extension) + one-shot
backfill from property_details.listing_events for pre-trigger history.
Nearby sold comps map
Loading sold comps map…
Walkable amenities ~0.75 mi
Loading nearby amenities…
Taxation est. · year 1
- Rental income
- $46,848
- − Mortgage interest
- −$19,600
- − Property taxes
- −$5,248
- − Insurance
- −$1,750
- − Repairs & maintenance
- −$3,748
- − Management
- −$3,748
- − Depreciation
- −$10,179
- Taxable income
- $2,576
- Est. tax owed @ 24.0%
- −$618
- After-tax cash flow
- $7,375/yr
For passive investors: Depreciation is non-cash, so a rental often shows a tax loss while cash-flowing — sheltering income. Rental losses are passive: they offset passive income freely, and up to $25,000/yr can offset ordinary (W-2) income if you actively participate and your MAGI is under $100k (phasing out to $0 by $150k); unused losses carry forward. On sale, claimed depreciation is recaptured at up to 25%, and gains may owe capital-gains tax (a 1031 exchange can defer both). Figures are a year-1 estimate at your 24.0% rate — not tax advice; consult a CPA.
Schools (NCES district)
- District
- Appleton Area School District
- NCES district ID
- 5500390
- Math proficiency
- 33% ▼ -6.00%
- Reading proficiency
- 36% ▼ -1.00%
- Median HH income
- $53,892
- Composite
- 30.3/100
- National rank
- #6279
- State rank
- #224 of 342 in WI
Livability — Appleton
- Score
- 82/100
- State rank
- #44
- US rank
- #1073
Category grades
Schools grade is shown separately in the Schools card above.
Census & demographics
- Census place
- Appleton, WI
- County
- Outagamie County · 155,051 people
- City population
- 126,671
- Metro
- Appleton, WI
- Population (ZIP)
- 44,367
- Household income
- $87,426
- Rent vs Own
- Severe rent burden
- 684.0
Population outlook (Outagamie County) Hauer SSP2
- Today (2025)
- 195,863 people
- By 2030
- 201,154 · +2.7%
- By 2040
- 209,053 · +6.7%
- By 2050
- 211,957 · +8.2%
- By 2075
- 214,299 · +9.4%
- By 2100
- 200,825 · +2.5%
Race, ethnicity, and origin ACS 2023
- Neighborhood character
- Predominantly White (83%)
- Race & ethnicity
- White 83% Two or more races 6% Asian 6% Hispanic / Latino 6% Black 2%
- Hispanic origin (detail)
- Mexican 4%
- Common ancestry
- Romanian 8% Iranian 5% Portuguese 4%
- Foreign-born
- 6% · Canada, Vietnam, China
- Languages at home
- 91% English-only · Other Asian/Pacific 3% Spanish 3% Other Indo-European 1%
Political lean MEDSL · Outagamie
- 2024 margin
- R (+10.2) · D 44.2% · R 54.4% · Other 1.5%
- 2008→2024 swing
- -21.8pp toward R · 2008: 11.6pp · 2024: -10.2pp
- All cycles
- 2024: R+10.2 2020: R+9.9 2016: R+12.6 2012: R+1.8 2008: D+11.6
Not yet ingested
- Civics
- —
Market trends
- HPI YoY
- ▼ -219.05%
- Current HPI
- 212.4897
- Rent YoY
- —
- Metro
- Appleton, WI
- State GDP YoY
- ▲ 2.10%
- F500 in state
- 20
Industry mix (Fortune 500 HQ in WI)
| Industry | F500 HQs | Revenue |
|---|---|---|
| Industrial Machinery | 4 | $23B |
|
||
| Industrial Technology | 2 | $36B |
|
||
| Insurance | 1 | $36B |
|
||
| Professional Services | 1 | $19B |
|
||
| Utilities | 1 | $9B |
|
||
| Consumer Goods | 1 | $3B |
|
||
Cash-flow waterfall
monthlySold comps — $/sqft
last 12 mo · ≤1 miLoading sold comps…