10066 Sharpton Dr · Houston, TX
Flood risk 4/10 · Minor
- FEMA flood zone
- X (unshaded)
- Chance of flooding over 30 yrs
- 0.22%
- Est. flood insurance / yr
- $507 – $1,088
Fire risk 3/10 · Minor
- Est. fire insurance / yr
- $1,222 – $2,270
Heat risk 9/10 · Severe
- Hot days now (above 110°F)
- 7 days/yr
- Hot days in 30 yrs
- 25 days/yr
Wind risk 9/10 · Severe
- Chance of severe wind over 30 yrs
- 99.0%
Air-quality risk 3/10 · Minor
- Unhealthy air days now
- 3 days/yr
- Unhealthy air days in 30 yrs
- 4 days/yr
Risk factors via First Street. Map © Google.
Why this score? — see what drove the C- grade
The composite is a weighted blend of 9 inputs, each scored 0–100. Each bar is that input's sub-score; the figure is the points it added to the 100-point composite (weight × sub-score).
- Cash flow +23.7/30.0
- DSCR +7.6/10.0
- 1% rule +6.6/10.0
- Livability +3.7/5.0
- ARV discount +3.2/15.0
- Rent growth +2.5/5.0
- Condition / age +2.5/5.0
- Schools +1.5/10.0
- Appreciation +0.0/10.0
$149,995
🖨 Deal sheet (PDF) 📄 Offer letter ✓ Due diligence
Listing remarks
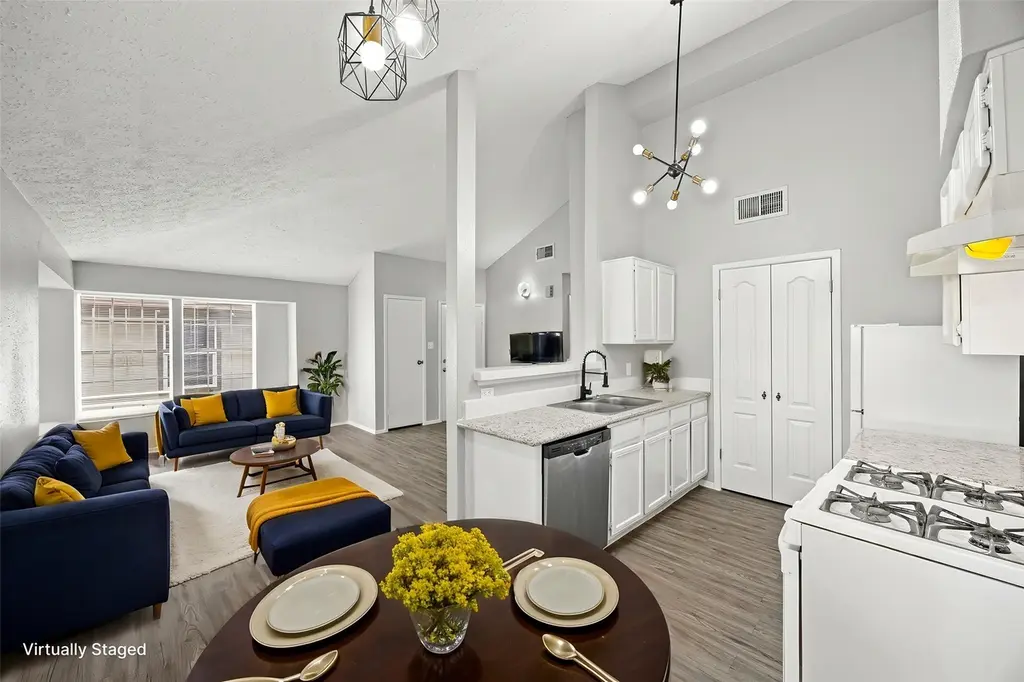
Fully refreshed and move-in ready! This charming 2-bed, 1-bath Ridgepoint home has been thoughtfully updated with fresh paint throughout, gorgeous new marble countertops in the kitchen, new sinks in both kitchen and bathroom, new ceiling fans, and a smart thermostat for modern energy efficiency. Outside, you'll find newly refreshed landscaping and a repaired privacy fence. The 900 sq ft single-story floor plan features an open living area, functional kitchen with included appliances, and comfortable bedrooms. Central electric heat and air. Slab foundation. Situated minutes from Beltway 8, I-45, FM-249, IAH Airport, Greenspoint, and Downtown Houston. Zoned to Aldine ISD. Active HOA managed b
Key facts
- New ceiling fans
- New sinks
- Smart thermostat
Tags
Property features AI
Finance
- HOA & community: Association managed by C.I.A. Services
Exterior
- Utilities: Public water; Public sewer
- Home design: Residential property; Single-story (entry level: first floor)
- Construction: Built in 1983; Brick and cement siding exterior; Composition roof; Slab foundation
- Exterior features: Fully fenced yard; Asphalt road access; Located in a subdivision
Interior
- Kitchen: Dishwasher; Pantry
- Bedrooms: Primary bedroom on the first floor; Additional bedroom on the first floor
- Bathrooms: 1 full bathroom; Primary bathroom on the first floor
- Heating & cooling: Central heating (electric); Central air (electric); Programmable thermostat
- Interior features: Double vanity; High ceilings; Kitchen/family room combo; Pantry; Tub with shower; Ceiling fans; Programmable thermostat
Neighborhood map
What this means for you Summary
Snapshot
- This is a 2-bed/1.0-bath townhouse listed at $150k.
Deal economics
- At list price, monthly cash flow is $285 ($3k/yr) — positive.
- The deal already cash-flows at list — no discount required.
- Meets the 1% rule at list price ($2k rent vs $150k).
- Recommended offer: $148k (1.5% below list) — sets the bar for market timing.
- Cap rate 8.6% vs local median 3.2% in Houston — top-decile yield for the area; either an underpriced asset or a hidden risk that comps aren't pricing in. Stress-test before assuming the spread holds.
Location & tenants
- Location reads 74/100 on livability (#184 in TX, #4,771 nationally) — a middle-class / working-renter tenant base. Strengths: amenities A+, cost of living A+, housing A+; Watch: crime F.
- Aldine ISD (suburban): math 16% / reading 21% proficiency, ranked #790 of 826 in TX (top 96%) — low school quality limits family demand, transient renter base, plan for 1-2y turnover; 79% free/reduced lunch — lower-income household profile, screen leases tightly.
- Zoned schools: Gray El (math 17% / reading 18%, grade F, #3,805 of 4,322 statewide, top 89%, 491 students, 96% FRL); Stovall Middle (math 20% / reading 25%, grade F, #1,341 of 1,662 statewide, top 82%, 961 students, 95% FRL); Aldine H S (math 15% / reading 20%, grade F, #1,451 of 1,632 statewide, top 89%, 2,663 students, 94% FRL) — zoned schools average 95% FRL vs 79% district-wide (16 pts higher); higher-poverty schools than district average — tighter screening recommended.
- Market conditions: 54 active listings in the ZIP; 4 comparable units currently listed for rent nearby; rentals at typical pace (median 26d on market — plan ~3-4 weeks tenant-placement turnaround); 29,883 units permitted in Harris County in 2024 (8,621 in 5+ unit buildings).
- This rent runs 36% of the median local income ($57k/yr) — at the standard rent-burdened threshold; future hikes will face affordability resistance.
Forward outlook
- Local home prices are declining (-3.0%/yr); year-one equity from $1k of loan paydown is wiped out by about $4k of value loss. Plan a longer hold.
- Harris County population projected at +47% by 2050 — long-run rental-demand tailwind backs the buy-and-hold thesis.
Negotiation context
- It's been on market 29 days — a 2% lower offer ($148k) is reasonable based on typical stale-listing flexibility.
- 5 sale attempts since 2y ago with the ask held roughly flat each time — persistent listings suggest the price (not the market) is what's stuck; bring a comps-based counter.
- Current owner paid $37k; list at $150k implies a 305% gain — meaningful room to come down on a strong offer.
Risks & watch-outs
- Climate carrying-cost: severe wind risk, 99% chance of damaging wind over 30y; extreme-heat days projected 7→25/yr by 2055 (HVAC capex compounding) — expect insurance premiums to compound above CPI over the hold.
Questions for the listing agent
- Is there a deadline driving the sale (1031 exchange, divorce, estate, relocation)? That informs how much negotiation room exists.
- Schools are D-rated, which usually means shorter tenancies and higher turnover. Who's the typical renter profile here, and what's been the actual vacancy rate?
- Crime grade is F in this area — have there been break-ins, vandalism, or insurance claims at this property in the last 3 years? What carrier currently insures it and at what premium?
- What's the average days-on-market for RENTAL listings here right now (not sales)? A rising rental-DOM trend means longer vacancies and softer asking-rent achievability than the comps imply.
- What's the recent tenant-quality profile in this submarket — average credit score on applications, eviction rate, late-payment / NSF rate, and stable-employment percentage? A property-management company in the area should have these aggregated.
- How much new for-sale + rental construction is in the pipeline within 1–3 miles? Heavy new supply typically softens prices + rents 12–24 months out; constrained supply supports both.
Investment metrics
- 1% rule
- 1.16% ✓
- Cap rate
- 8.57%
- Cash-on-cash
- 8.15%
- DSCR
- 1.36
- GRM
- 7.2
CMA / ARV
- ARV (on-the-fly)
- $136,800
- Comps found
- 1
Show comp detail 1 sale within ~0.75 mi
| Address | Dist | Beds/Ba | Sqft | Sold | Price | $/sf | Match |
|---|---|---|---|---|---|---|---|
| 10038 Woodico Ct | 0.11mi | 2/1.0 | 855 (-5%) | 2mo | $129,900 | $152 | 85 |
Match score weights: distance 35% · size 25% · config 20% · recency 20%. Top-matched comps best support the ARV.
Projected returns pro-forma
-3.0% appreciation · 3.0% rent growth · sell at horizon
- IRR
- -3.9%
- Equity multiple
- 0.86×
- Total profit
- $-6,088
- Equity at exit
- $22,365
- IRR
- 5.9%
- Equity multiple
- 1.44×
- Total profit
- $18,317
- Equity at exit
- $12,969
Cash invested: $41,999 (down + closing). Projections, not guarantees.
Landlord ↔ Tenant lean methodology
- Overall (STATE)
- 87 Strongly Landlord-Friendly
- State Texas
- 87 Strongly Landlord-Friendly · R+5
- County
- — inherits STATE
- City
- — inherits STATE
ZIP-level market 77038
- Home prices YoY
- -20.0%
- Active inventory
- 54
- Price-to-rent
- 7.2×
Monthly cashflow live
- Estimated rent
- $1,737 medium interval (Pro) →
- Mortgage (P&I)
- −$787
- Tax from tax record
- −$238 /mo · $2,858/yr
- Insurance
- −$62
- HOA
- −$0
- Vacancy / Maint / Mgmt
- −$365
- Net cashflow
- $285
Break-even live
Sensitivity live
| Price | -10% $370 | -5% $328 | +0% $285 | +5% $243 | +10% $200 |
|---|---|---|---|---|---|
| Rent | -10% $148 | -5% $217 | +0% $285 | +5% $354 | +10% $422 |
| Rate | -1.0pp $361 | -0.5pp $323 | base $285 | +0.5pp $246 | +1.0pp $207 |
UW: 25.0% down · 7.5% · 30yr · 1.5% tax · 5.0% vac · 8.0% maint · 8.0% mgmt
Financing live
Cash to close
- Down payment
- $37,499
- Closing costs
- $4,500
- Reserves months
- —
- Total cash needed
- —
Loan-product check · same deal, 3 products live
Conventional
25% down · 7.5% · 30yr
- Down + closing
- —
- Monthly P&I
- —
- Monthly cashflow
- —
- DSCR
- —
- Eligible?
- —
Personal DTI + credit; lowest rate.
DSCR
20% down · 8.5% · 30yr
- Down + closing
- —
- Monthly P&I
- —
- Monthly cashflow
- —
- DSCR
- —
- Eligible?
- —
No personal income docs; deal must DSCR.
Hard money
10% down · 12.0% · 12mo
- Down + closing
- —
- Monthly P&I
- —
- Monthly cashflow
- —
- DSCR
- —
- Eligible?
- —
Short-term bridge; refi at stabilization.
Rent comps 4 comps
| Address | Beds | Baths | Sqft | Rent | $/sqft | DOM | Units | Dist |
|---|---|---|---|---|---|---|---|---|
| 1330 Blue Bell Rd Houston, TX | 2.0–3.0 | 1.0–2.0 | 1418 | $1,200 | $0.85 | 1d | 7 | 0.83mi |
| 9750 Deer Trail Dr Houston, TX | 2.0 | 2.0 | 1000 | $1,800 | $1.80 | 26d | 1 | 1.03mi |
| 9750 Deer Trail Dr Houston, TX | 3.0 | 2.0 | 1050 | $2,200 | $2.10 | 45d | 1 | 1.03mi |
| 10445 Greens Crossing Blvd Houston, TX | 1.0–3.0 | 1.0–2.0 | 862 | $1,324 | $1.54 | 1d | 44 | 1.16mi |
Listing history 33 events
-
2026-06-21days on market $149,995 Active 29 DOM
-
2026-06-18days on market $149,995 Active 26 DOM
-
2026-06-17days on market $149,995 Active 25 DOM
-
2026-06-16days on market $149,995 Active 24 DOM
-
2026-06-15days on market $149,995 Active 23 DOM
-
2026-06-13days on market $149,995 Active 21 DOM
-
2026-06-13days on market $149,995 Active 20 DOM
-
2026-06-09days on market $149,995 Active 17 DOM
-
2026-06-08days on market $149,995 Active 16 DOM
-
2026-06-07days on market $149,995 Active 15 DOM
-
2026-06-04days on market $149,995 Active 12 DOM
-
2026-06-03days on market $149,995 Active 11 DOM
-
2026-06-02days on market $149,995 Active 10 DOM
-
2026-06-01days on market $149,995 Active 9 DOM
-
2026-05-31days on market $149,995 Active 8 DOM
-
2026-05-23$149,995 Active
-
2025-04-27historical $850
-
2025-03-06$850
-
2024-11-19soldstatus
-
2024-11-09historical
-
2024-10-27$139,999 Active
-
2024-10-22historical
-
2024-10-11price $139,990
-
2024-08-01$155,000 Active
-
2024-08-01historical
-
2024-07-25$155,000 Active
-
2023-03-24soldstatus
-
2023-03-24soldstatus
-
2020-10-08soldstatus
-
2020-02-04soldstatus
-
2013-02-08soldstatus $37,000
-
2012-10-19soldstatus $130,530
-
1988-06-06soldstatus
ⓘ Source: listings_history table (triggers on properties + properties_extension) + one-shot
backfill from property_details.listing_events for pre-trigger history.
Tax reassessment forecast TX · Resets to sale price
- Current annual tax
- $2,858 · $238/mo
- Projected year-2 tax
- $2,858 · $238/mo
- Expected delta
- $0/yr ($0/mo · 0.0%)
ⓘ Screening estimate from a state-policy table — verify with the county assessor before closing.
Climate risk First Street
- Flood 4/10 Moderate FEMA zone X (unshaded) · 22% chance over 30 yrs
- Wildfire 3/10 Moderate
- Heat 9/10 Extreme 7 d/yr ≥110°F today · 25 d/yr by 30 yrs out
- Wind 9/10 Extreme 99% chance of damaging wind over 30 yrs
- Air quality 3/10 Moderate 3 unhealthy d/yr today · 4 by 30 yrs out
Nearby sold comps map
Loading sold comps map…
Walkable amenities ~0.75 mi
Loading nearby amenities…
Taxation est. · year 1
- Rental income
- $20,847
- − Mortgage interest
- −$8,402
- − Property taxes
- −$2,858
- − Insurance
- −$750
- − Repairs & maintenance
- −$1,668
- − Management
- −$1,668
- − Depreciation
- −$4,363
- Taxable income
- $1,138
- Est. tax owed @ 24.0%
- −$273
- After-tax cash flow
- $3,149/yr
For passive investors: Depreciation is non-cash, so a rental often shows a tax loss while cash-flowing — sheltering income. Rental losses are passive: they offset passive income freely, and up to $25,000/yr can offset ordinary (W-2) income if you actively participate and your MAGI is under $100k (phasing out to $0 by $150k); unused losses carry forward. On sale, claimed depreciation is recaptured at up to 25%, and gains may owe capital-gains tax (a 1031 exchange can defer both). Figures are a year-1 estimate at your 24.0% rate — not tax advice; consult a CPA.
Schools (NCES district)
- District
- Aldine ISD
- NCES district ID
- 4807710
- Math proficiency
- 16% ▼ -23.00%
- Reading proficiency
- 21% ▼ -11.00%
- Median HH income
- $37,081
- Composite
- 15.42/100
- National rank
- #9317
- State rank
- #790 of 826 in TX
Livability — Houston
- Score
- 74/100
- State rank
- #184
- US rank
- #4771
Category grades
Schools grade is shown separately in the Schools card above.
Census & demographics
- County
- Harris County · 4,702,590 people
- City population
- 3,226,434
- Metro
- Houston-The Woodlands-Sugar Land, TX
- Population (ZIP)
- 32,637
- Household income
- $57,232
- Rent vs Own
- Severe rent burden
- 1038.0
Population outlook (Harris County) Hauer SSP2
- Today (2025)
- 5,571,493 people
- By 2030
- 6,089,821 · +9.3%
- By 2040
- 7,142,806 · +28.2%
- By 2050
- 8,185,864 · +46.9%
- By 2075
- 10,574,329 · +89.8%
- By 2100
- 12,109,958 · +117.4%
Race, ethnicity, and origin ACS 2023
- Neighborhood character
- Predominantly Hispanic (70%)
- Race & ethnicity
- Hispanic / Latino 70% Two or more races 23% Black 21% Asian 4% White 3%
- Hispanic origin (detail)
- Mexican 52% Puerto Rican 1% Cuban 1%
- Foreign-born
- 36% · Canada, Vietnam
- Languages at home
- 32% English-only · Spanish 64% Vietnamese 3% Other Asian/Pacific 1%
Political lean MEDSL · Harris
- 2024 margin
- Lean D (+5.5) · D 52.0% · R 46.4% · Other 1.6%
- 2008→2024 swing
- +3.9pp toward D · 2008: 1.6pp · 2024: 5.5pp
- All cycles
- 2024: D+5.5 2020: D+13.3 2016: D+12.4 2012: D+0.1 2008: D+1.6
Not yet ingested
- Civics
- —
Market trends
- HPI YoY
- ▼ -69.18%
- Current HPI
- 277.0068
- Rent YoY
- —
- Metro
- Houston-The Woodlands-Sugar Land, TX
- State GDP YoY
- ▲ 3.95%
- F500 in state
- 110
Industry mix (Fortune 500 HQ in TX)
| Industry | F500 HQs | Revenue |
|---|---|---|
| Energy | 16 | $1,198B |
|
||
| Technology | 5 | $198B |
|
||
| Engineering / Construction | 4 | $72B |
|
||
| Energy Services | 3 | $60B |
|
||
| Utilities | 3 | $41B |
|
||
| Healthcare | 2 | $330B |
|
||
Price history
+14.9% since first listed18 events — show timeline
- 2026-05-23 Listed $149,995 HARMLS
- 2025-04-27 Rental Removed $850 SHOWMOJO
- 2025-03-06 Listed for Rent $850 SHOWMOJO
- 2024-11-19 Sold (Public Records) — Public Records
- 2024-11-09 Listing Removed — HARMLS
- 2024-10-27 Listed $139,999 HARMLS
- 2024-10-22 Listing Removed — HARMLS
- 2024-10-11 Price Changed $139,990 HARMLS
- 2024-08-01 Listing Removed — HARMLS
- 2024-08-01 Listed $155,000 HARMLS
- 2024-07-25 Listed $155,000 HARMLS
- 2023-03-24 Sold (Public Records) — Public Records
- 2023-03-24 Sold (Public Records) — Public Records
- 2020-10-08 Sold (Public Records) — Public Records
- 2020-02-04 Sold (Public Records) — Public Records
- 2013-02-08 Sold (Public Records) $37,000 Public Records
- 2012-10-19 Sold (Public Records) $130,530 Public Records
- 1988-06-06 Sold (Public Records) — Public Records
Property tax history
+9.6%/yrLatest (2025): $2,858 · +13.0% YoY. Source: county tax records.
Cash-flow waterfall
monthlySold comps — $/sqft
last 12 mo · ≤1 miLoading sold comps…