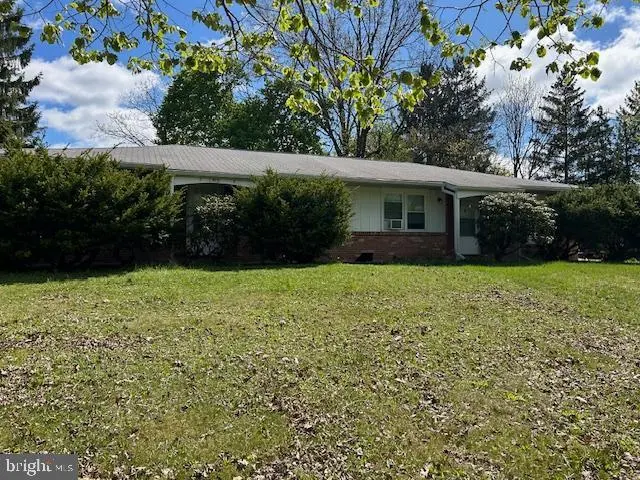
 Duplex
1355-1357 University Dr · State College, PA
Flood risk 1/10 · Minimal
- FEMA flood zone
- X (unshaded)
- Chance of flooding over 30 yrs
- 0.0%
- Est. flood insurance / yr
- $473 – $860
Fire risk 1/10 · Minimal
- Est. fire insurance / yr
- $511 – $949
Heat risk 3/10 · Minor
- Hot days now (above 93°F)
- 7 days/yr
- Hot days in 30 yrs
- 16 days/yr
Wind risk 2/10 · Minimal
- Chance of severe wind over 30 yrs
- —
Air-quality risk 2/10 · Minimal
- Unhealthy air days now
- 0 days/yr
- Unhealthy air days in 30 yrs
- 1 days/yr
Risk factors via First Street. Map © Google.
Why this score? — see what drove the D grade
The composite is a weighted blend of 9 inputs, each scored 0–100. Each bar is that input's sub-score; the figure is the points it added to the 100-point composite (weight × sub-score).
- Cash flow +12.1/30.0
- ARV discount +9.3/15.0
- Schools +5.7/10.0
- Livability +4.5/5.0
- DSCR +3.6/10.0
- 1% rule +3.2/10.0
- Rent growth +3.2/5.0
- Condition / age +2.5/5.0
- Appreciation +0.0/10.0
$425,000
🖨 Deal sheet (PDF) 📄 Offer letter ✓ Due diligence
Multi-family units
County records classify this as Multi-Family (5+ Unit). Listing-text estimate: 2 units. estimate disagrees with records
5+ unit building — per-unit beds/baths from public records are typically unavailable; the breakdown below (if shown) is an estimate from the listing text.
Listing remarks
A great investment opportunity in the heart of State College Borough, this fully leased duplex combines established STUDENT HOME LICENSES, active rental permits, and an unbeatable location just moments from Penn State University. Consistent demand, walkability, and direct access to the CATA bus route make this property a reliable performer in one of the area’s strongest rental markets. Each unit offers approximately 900 sq. ft. of functional living space, including hardwood floors, a comfortable living room, a kitchen with included refrigerators and ranges, 2 bedrooms, 1 full bathroom, and unfinished basements ideal for storage. Both units are separately metered with tenants responsib
Key facts
- 0.27 acre lot
- Built 1970
Neighborhood map
What this means for you Summary
Snapshot
- This is a 2 × 2-bed/1-bath units multifamily listed at $425k.
Deal economics
- At list price, monthly cash flow is $-95 ($-1k/yr) — negative. Per door: $-48/mo.
- To cash-flow at today's rent, offer at most $408k (4.0% below list).
- To meet the 1% rule (rent ≥ 1% of price), the offer needs to be $350k (17.7% below list).
- Recommended offer: $350k (17.7% below list) — sets the bar for 1% rule.
- Cap rate 6.0% vs local median 1.7% in State College — top-decile yield for the area; either an underpriced asset or a hidden risk that comps aren't pricing in. Stress-test before assuming the spread holds.
Location & tenants
- Location reads 89/100 on livability (#29 in PA, #164 nationally) — a professional / high-income tenant draw. Strengths: crime A+, amenities A+, commute A+; Watch: employment C-, cost of living C-.
- State College Area SD (urban): math 62% / reading 73% proficiency, ranked #41 of 539 in PA (top 8%) — acceptable for families but not a draw, mixed tenant base, ~2y average lease; only 15% free/reduced lunch — higher-income household profile.
- Zoned schools: Easterly Parkway El Sch (math 57% / reading 67%, grade B, #313 of 1,518 statewide, top 24%, 316 students, 37% FRL); Mount Nittany Ms (math 40% / reading 72%, grade B-, #69 of 512 statewide, top 14%, 695 students, 20% FRL); State College Area Hs (math 90% / reading 24%, grade C, #86 of 437 statewide, top 20%, 2,410 students, 20% FRL).
- Market conditions: Rents rising (+2.8%/yr); 162 active listings in the ZIP; 1 comparable units currently listed for rent nearby; 399 units permitted in Centre County in 2024 (44 in 5+ unit buildings).
- At $3,496/mo this rent would consume 68% of the median local household income ($62k/yr) (locally 3590% of renters already pay >50% of income on rent) — very limited rent-growth headroom before tenants either downsize or default.
Forward outlook
- Local home prices are declining (-3.0%/yr); year-one equity from $3k of loan paydown is wiped out by about $13k of value loss. Plan a longer hold.
- Centre County population projected at +16% by 2050 — long-run rental-demand tailwind backs the buy-and-hold thesis.
Negotiation context
- Only 0 days on market — expect competitive offers; lowballing is unlikely to land.
Questions for the listing agent
- What do current leases actually rent for vs. the listed asking? Can we see a recent rent roll and the last 12 months of T-12 income?
- Can we see the unit-by-unit rent roll, current vacancy, and any below-market leases? What's the average tenancy length?
- What capital expenditures (roof, boiler, parking lot, exteriors) have been made in the last 5 years, and what's planned in the next 2?
- Built in 1970 — when were the roof, HVAC, electrical panel, plumbing, and water heater last replaced?
- Is there a deadline driving the sale (1031 exchange, divorce, estate, relocation)? That informs how much negotiation room exists.
- Schools are A-rated — typically a magnet for longer-tenancy family renters. What's the average tenant stay here, and is there a school-zone premium baked into asking?
- The area grade is low — what's the realistic commute time and amenity access for the typical tenant pool here? Any planned neighborhood developments (good or bad) we should know about?
- What's the average days-on-market for RENTAL listings here right now (not sales)? A rising rental-DOM trend means longer vacancies and softer asking-rent achievability than the comps imply.
- What's the recent tenant-quality profile in this submarket — average credit score on applications, eviction rate, late-payment / NSF rate, and stable-employment percentage? A property-management company in the area should have these aggregated.
- How much new apartment / multifamily construction is in the pipeline within 1–3 miles? Heavy new supply (>2% of stock underway) typically softens rents 12–24 months out; light construction supports rent growth.
Investment metrics
- 1% rule
- 0.82% ✗
- Cap rate
- 6.02%
- Cash-on-cash
- -0.96%
- DSCR
- 0.96
- GRM
- 10.1
CMA / ARV
- ARV (on-the-fly)
- $442,250
- Comps found
- 4
Show comp detail 4 sales within ~0.75 mi
| Address | Dist | Beds/Ba | Sqft | Sold | Price | $/sf | Match |
|---|---|---|---|---|---|---|---|
| 1355-1357 University Dr | 0.00mi | 4/— | 1,800 (+2%) | 0mo | $440,000 | $244 | 97 |
| 1317-1319 University Dr | 0.08mi | 4/— | 1,800 (+2%) | 1mo | $450,000 | $250 | 93 |
| 1307-1309 University Dr | 0.09mi | 4/— | 1,800 (+2%) | 1mo | $450,000 | $250 | 92 |
| 120,122 A & B Logan Ave | 0.74mi | 5/— (+1) | 1,768 (-0%) | 11mo | $515,000 | $291 | 52 |
Match score weights: distance 35% · size 25% · config 20% · recency 20%. Top-matched comps best support the ARV.
Projected returns pro-forma
-3.0% appreciation · 2.77% rent growth · sell at horizon
- IRR
- -18.1%
- Equity multiple
- 0.36×
- Total profit
- $-75,740
- Equity at exit
- $63,369
- IRR
- -10.8%
- Equity multiple
- 0.35×
- Total profit
- $-77,049
- Equity at exit
- $36,746
Cash invested: $119,000 (down + closing). Projections, not guarantees.
Landlord ↔ Tenant lean methodology
- Overall (STATE)
- 62 Landlord-Friendly
- State Pennsylvania
- 62 Landlord-Friendly · EVEN
- County
- — inherits STATE
- City
- — inherits STATE
ZIP-level market 16801
- Rents YoY
- 2.8%
- Active inventory
- 162
- Price-to-rent
- 20.3×
Monthly cashflow live
- Estimated rent
- $3,496 high interval (Pro) →
- Mortgage (P&I)
- −$2,229
- Tax from tax record
- −$451 /mo · $5,415/yr
- Insurance
- −$177
- HOA
- −$0
- Lot rent
- −$0
- Vacancy / Maint / Mgmt
- −$734
- Net cashflow
- $-95
Break-even live
Sensitivity live
| Price | -10% $145 | -5% $25 | +0% $-95 | +5% $-216 | +10% $-336 |
|---|---|---|---|---|---|
| Rent | -10% $-371 | -5% $-233 | +0% $-95 | +5% $43 | +10% $181 |
| Rate | -1.0pp $119 | -0.5pp $13 | base $-95 | +0.5pp $-205 | +1.0pp $-317 |
2-unit breakdown (identical units grouped — click to expand)
| Units | Beds | Baths | Est. rent |
|---|---|---|---|
| 2× units | 2 | 1 | $3,496 |
| #1 | 2 | 1 | $1,748 |
| #2 | 2 | 1 | $1,748 |
| Total (2 units) | $3,496 | ||
UW: 25.0% down · 7.5% · 30yr · 1.5% tax · 5.0% vac · 8.0% maint · 8.0% mgmt
Financing live
Cash to close
- Down payment
- $106,250
- Closing costs
- $12,750
- Reserves months
- —
- Total cash needed
- —
Loan-product check · same deal, 3 products live
Conventional
25% down · 7.5% · 30yr
- Down + closing
- —
- Monthly P&I
- —
- Monthly cashflow
- —
- DSCR
- —
- Eligible?
- —
Personal DTI + credit; lowest rate.
DSCR
20% down · 8.5% · 30yr
- Down + closing
- —
- Monthly P&I
- —
- Monthly cashflow
- —
- DSCR
- —
- Eligible?
- —
No personal income docs; deal must DSCR.
Hard money
10% down · 12.0% · 12mo
- Down + closing
- —
- Monthly P&I
- —
- Monthly cashflow
- —
- DSCR
- —
- Eligible?
- —
Short-term bridge; refi at stabilization.
Rent comps 1 comps
| Address | Beds | Baths | Sqft | Rent | $/sqft | DOM | Units | Dist |
|---|---|---|---|---|---|---|---|---|
| 679-A Waupelani Dr State College, PA | 4.0 | 1.0–2.5 | 1335 | $2,619 | $1.96 | 46d | 47 | 1.42mi |
Listing history 2 events
-
2026-05-06$425,000
-
2026-05-06historical
ⓘ Source: listings_history table (triggers on properties + properties_extension) + one-shot
backfill from property_details.listing_events for pre-trigger history.
Tax reassessment forecast PA · Partial reset (capped growth)
- Current annual tax
- $5,415 · $451/mo
- Projected year-2 tax
- $6,065 · $505/mo
- Expected delta
- +$650/yr (+$54/mo · 12.0%)
ⓘ Screening estimate from a state-policy table — verify with the county assessor before closing.
Climate risk First Street
- Flood 1/10 Low FEMA zone X (unshaded) · 0% chance over 30 yrs
- Wildfire 1/10 Low
- Heat 3/10 Moderate 7 d/yr ≥93°F today · 16 d/yr by 30 yrs out
- Wind 2/10 Low
- Air quality 2/10 Low 0 unhealthy d/yr today · 1 by 30 yrs out
Nearby sold comps map
Loading sold comps map…
Walkable amenities ~0.75 mi
Loading nearby amenities…
Taxation est. · year 1
- Rental income
- $41,952
- − Mortgage interest
- −$23,807
- − Property taxes
- −$5,415
- − Insurance
- −$2,125
- − Repairs & maintenance
- −$3,356
- − Management
- −$3,356
- − Depreciation
- −$12,364
- Taxable loss
- −$8,471
- Est. tax savings @ 24.0%
- +$2,033
- After-tax cash flow
- $890/yr
For passive investors: Depreciation is non-cash, so a rental often shows a tax loss while cash-flowing — sheltering income. Rental losses are passive: they offset passive income freely, and up to $25,000/yr can offset ordinary (W-2) income if you actively participate and your MAGI is under $100k (phasing out to $0 by $150k); unused losses carry forward. On sale, claimed depreciation is recaptured at up to 25%, and gains may owe capital-gains tax (a 1031 exchange can defer both). Figures are a year-1 estimate at your 24.0% rate — not tax advice; consult a CPA.
Schools (NCES district)
- District
- State College Area SD
- NCES district ID
- 4222770
- Math proficiency
- 62% ▼ -4.00%
- Reading proficiency
- 73% ▼ -7.00%
- Median HH income
- $49,753
- Composite
- 57.23/100
- National rank
- #1094
- State rank
- #41 of 539 in PA
Livability — State College
- Score
- 89/100
- State rank
- #29
- US rank
- #164
Category grades
Schools grade is shown separately in the Schools card above.
Census & demographics
- Census place
- State College, PA
- County
- Centre County · 99,000 people
- City population
- 64,751
- Metro
- State College, PA
- Population (ZIP)
- 40,774
- Household income
- $61,836
- Rent vs Own
- Severe rent burden
- 3590.0
Population outlook (Centre County) Hauer SSP2
- Today (2025)
- 177,113 people
- By 2030
- 185,138 · +4.5%
- By 2040
- 196,009 · +10.7%
- By 2050
- 205,070 · +15.8%
- By 2075
- 217,575 · +22.8%
- By 2100
- 230,649 · +30.2%
Race, ethnicity, and origin ACS 2023
- Neighborhood character
- Predominantly White (80%)
- Race & ethnicity
- White 80% Asian 9% Two or more races 6% Hispanic / Latino 4% Black 3%
- Common ancestry
- Romanian 6% Lithuanian 2% Scotch-Irish 2%
- Foreign-born
- 12% · China, South Korea, Canada
- Languages at home
- 86% English-only · Chinese 3% Spanish 2% Other Indo-European 2%
Political lean MEDSL · Centre
- 2024 margin
- Toss-up / Even · D 50.9% · R 48.1% · Other 1.0%
- 2008→2024 swing
- -9.0pp toward R · 2008: 11.8pp · 2024: 2.8pp
- All cycles
- 2024: D+2.8 2020: D+4.8 2016: D+1.9 2012: R+0.0 2008: D+11.8
Not yet ingested
- Civics
- —
Market trends
- HPI YoY
- ▼ -140.33%
- Current HPI
- 208.2423
- Rent YoY
- ▲ 2.77%
- Metro
- State College, PA
- State GDP YoY
- ▲ 1.68%
- F500 in state
- 34
Industry mix (Fortune 500 HQ in PA)
| Industry | F500 HQs | Revenue |
|---|---|---|
| Healthcare | 2 | $309B |
|
||
| Insurance | 2 | $27B |
|
||
| Telecommunications / Media | 1 | $124B |
|
||
| Industrial Distribution | 1 | $22B |
|
||
| Financial Services | 1 | $20B |
|
||
| Chemicals / Materials | 1 | $18B |
|
||
Price history
2 events — show timeline
- 2026-05-06 Listing Removed — BRIGHT MLS
- 2026-05-06 Listed $425,000 BRIGHT MLS
Property tax history
+3.4%/yrLatest (2026): $5,415 · +4.9% YoY. Source: county tax records.
Cash-flow waterfall
monthlySold comps — $/sqft
last 12 mo · ≤1 miLoading sold comps…