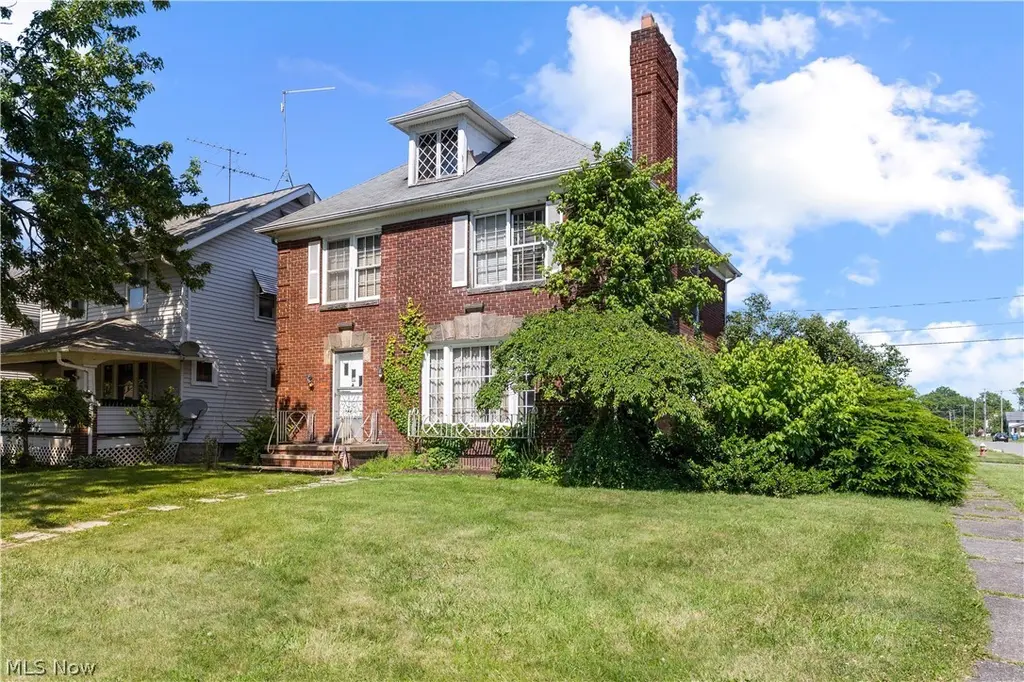
959 Allison Ave · Lorain, OH
Flood risk 1/10 · Minimal
- FEMA flood zone
- X (unshaded)
- Chance of flooding over 30 yrs
- 0.0%
- Est. flood insurance / yr
- $507 – $1,088
Fire risk 1/10 · Minimal
- Est. fire insurance / yr
- $713 – $1,323
Heat risk 3/10 · Minor
- Hot days now (above 98°F)
- 7 days/yr
- Hot days in 30 yrs
- 17 days/yr
Wind risk 1/10 · Minimal
- Chance of severe wind over 30 yrs
- —
Air-quality risk 2/10 · Minimal
- Unhealthy air days now
- 2 days/yr
- Unhealthy air days in 30 yrs
- 2 days/yr
Risk factors via First Street. Map © Google.
Why this score? — see what drove the B grade
The composite is a weighted blend of 9 inputs, each scored 0–100. Each bar is that input's sub-score; the figure is the points it added to the 100-point composite (weight × sub-score).
- Cash flow +28.7/30.0
- ARV discount +15.0/15.0
- DSCR +10.0/10.0
- 1% rule +7.7/10.0
- Rent growth +3.5/5.0
- Livability +3.4/5.0
- Condition / age +2.5/5.0
- Schools +1.6/10.0
- Appreciation +0.0/10.0
$120,000
🖨 Deal sheet 📄 Offer letter ✓ Due diligence
Listing remarks
Unlimited potential for your renovation! A TRUE DIAMOND IN THE ROUGH. Loaded with character and charm throughout! ALL BRICK colonial with a brick 2 car garage nestled in the Lakeview Park neighborhood. HALF BATH on the main level! Full bath up with original vintage tile and charm from days gone by! Huge rooms! Crown molding, archways, built-ins, unique staircase, fireplace! Rounded window in the breakfast nook would also be an adorable mini sunroom for your plants. Basement was finished with larger windows and knotty pine paneling. Kitchen has been removed and ready for you to design and replace with your preferences. BEING SOLD AS-IS, SELLER WILL MAKE NO REPAIRS. CASH OR RENOVATION LOAN F
Key facts
- Half bath
- Brick garage
- Full bath
Tags
Property features AI
Exterior
- Parking: Detached 2-car garage
- Utilities: Public water service; Public sewer service
- Home design: 2-story home; Brick construction; Asphalt/fiberglass roof
- Construction: Built in public-record year (source: public records)
- Exterior features: Public water; Public sewer
Interior
- Bathrooms: One full bathroom; One half bathroom; One main-level bathroom
- Heating & cooling: Forced air heating; Gas heating
- Interior features: Full, unfinished basement; One fireplace; 7 total rooms
Neighborhood map
What this means for you Summary
Snapshot
- This is a 3-bed/1.5-bath single-family listed at $120k.
Deal economics
- At list price, monthly cash flow is $398 ($5k/yr) — positive.
- The deal already cash-flows at list — no discount required.
- Meets the 1% rule at list price ($2k rent vs $120k).
- Cap rate 10.3% vs local median 5.9% in Lorain — top-decile yield for the area; either an underpriced asset or a hidden risk that comps aren't pricing in. Stress-test before assuming the spread holds.
Location & tenants
- Location reads 67/100 on livability (#595 in OH) — a middle-class / working-renter tenant base. Strengths: cost of living A+, housing A+; Watch: schools C-, amenities D, health & safety D.
- Lorain City (suburban): math 13% / reading 26% proficiency, ranked #633 of 656 in OH (top 96%) — low school quality limits family demand, transient renter base, plan for 1-2y turnover; 80% free/reduced lunch — lower-income household profile, screen leases tightly.
- Market conditions: Rents rising fast (+4.1%/yr); 129 active listings in the ZIP; 14 comparable units currently listed for rent nearby; rentals lingering (median 44d on market — plan ~5-8 weeks vacancy on turnover, expect pricing pressure); 50% of comp listings sitting > 30 days — soft ceiling on asking rent; 1,098 units permitted in Lorain County in 2024 (20 in 5+ unit buildings).
- This rent runs 41% of the median local income ($45k/yr) — at the standard rent-burdened threshold; future hikes will face affordability resistance.
Forward outlook
- Local home prices are declining (-3.0%/yr); year-one equity from $830 of loan paydown is wiped out by about $4k of value loss. Plan a longer hold.
- At projected returns (-3.0% appreciation + 4.1% rent growth), your $34k cash investment doubles in ~8 years — after that, you're playing with house money.
Negotiation context
- Only 14 days on market — expect competitive offers; lowballing is unlikely to land.
Risks & watch-outs
- Watch-outs: built in 1940 — expect roof / HVAC / electrical / plumbing capex.
Questions for the listing agent
- Built in 1940 — when were the roof, HVAC, electrical panel, plumbing, and water heater last replaced?
- Is there a deadline driving the sale (1031 exchange, divorce, estate, relocation)? That informs how much negotiation room exists.
- Crime grade is F in this area — have there been break-ins, vandalism, or insurance claims at this property in the last 3 years? What carrier currently insures it and at what premium?
- What's the average days-on-market for RENTAL listings here right now (not sales)? A rising rental-DOM trend means longer vacancies and softer asking-rent achievability than the comps imply.
- What's the recent tenant-quality profile in this submarket — average credit score on applications, eviction rate, late-payment / NSF rate, and stable-employment percentage? A property-management company in the area should have these aggregated.
- How much new for-sale + rental construction is in the pipeline within 1–3 miles? Heavy new supply typically softens prices + rents 12–24 months out; constrained supply supports both.
Investment metrics
- 1% rule
- 1.27% ✓
- Cap rate
- 10.27%
- Cash-on-cash
- 14.20%
- DSCR
- 1.63
- GRM
- 6.5
CMA / ARV
- ARV (on-the-fly)
- $230,336
- Comps found
- 12
Show comp detail 12 sales within ~0.75 mi
| Address | Dist | Beds/Ba | Sqft | Sold | Price | $/sf | Match |
|---|---|---|---|---|---|---|---|
| 1507 S Lakeview Blvd | 0.22mi | 3/1.0 | 1,952 (+3%) | 11mo | $245,000 | $126 | 72 |
| 1502 S Lakeview Blvd | 0.25mi | 3/1.5 | 1,968 (+4%) | 12mo | $240,000 | $122 | 71 |
| 858 Allison Ave | 0.08mi | 3/2.0 | 1,650 (-13%) | 6mo | $230,000 | $139 | 68 |
| 1329 W 7th St | 0.20mi | 4/1.0 (+1) | 1,750 (-7%) | 5mo | $140,000 | $80 | 67 |
| 1123 W 6th St | 0.46mi | 4/3.0 (+1) | 1,828 (-3%) | 2mo | $244,900 | $134 | 60 |
| 1349 W 2nd | 0.41mi | 4/2.0 (+1) | 2,000 (+6%) | 12mo | $285,000 | $143 | 54 |
| 1348 W Erie Ave | 0.38mi | 4/1.5 (+1) | 2,096 (+11%) | 7mo | $299,900 | $143 | 53 |
| 1604 W 23rd St | 0.74mi | 4/2.0 (+1) | 1,780 (-6%) | 3mo | $91,500 | $51 | 47 |
| 404 Brownell Ave | 0.41mi | 4/2.5 (+1) | 1,715 (-9%) | 14mo | $143,000 | $83 | 45 |
| 2109 W 13th St | 0.52mi | 4/2.0 (+1) | 1,643 (-13%) | 3mo | $140,000 | $85 | 44 |
| 1122 W 17th St | 0.46mi | 4/2.0 (+1) | 1,665 (-12%) | 10mo | $74,000 | $44 | 44 |
| 911 7th Ct | 0.65mi | 3/1.0 | 1,690 (-10%) | 9mo | $140,000 | $83 | 42 |
Match score weights: distance 35% · size 25% · config 20% · recency 20%. Top-matched comps best support the ARV.
Projected returns pro-forma
-3.0% appreciation · 4.09% rent growth · sell at horizon
- IRR
- 5.7%
- Equity multiple
- 1.23×
- Total profit
- $7,583
- Equity at exit
- $17,892
- IRR
- 16.1%
- Equity multiple
- 2.38×
- Total profit
- $46,360
- Equity at exit
- $10,375
Cash invested: $33,600 (down + closing). Projections, not guarantees.
Landlord ↔ Tenant lean methodology
- Overall (STATE)
- 73 Landlord-Friendly
- State Ohio
- 73 Landlord-Friendly · R+6
- County
- — inherits STATE
- City
- — inherits STATE
ZIP-level market 44052
- Home prices YoY
- -28.1%
- Rents YoY
- 4.1%
- Active inventory
- 129
- Price-to-rent
- 6.5×
Monthly cashflow live
- Estimated rent
- $1,528 high interval (Pro) →
- Mortgage (P&I)
- −$629
- Tax from tax record
- −$130 /mo · $1,558/yr
- Insurance
- −$50
- HOA
- −$0
- Vacancy / Maint / Mgmt
- −$321
- Net cashflow
- $398
Break-even live
UW: 25.0% down · 7.5% · 30yr · 1.5% tax · 5.0% vac · 8.0% maint · 8.0% mgmt
Financing live
Cash to close
- Down payment
- $30,000
- Closing costs
- $3,600
- Reserves months
- —
- Total cash needed
- —
Loan-product check · same deal, 3 products live
Conventional
25% down · 7.5% · 30yr
- Down + closing
- —
- Monthly P&I
- —
- Monthly cashflow
- —
- DSCR
- —
- Eligible?
- —
Personal DTI + credit; lowest rate.
DSCR
20% down · 8.5% · 30yr
- Down + closing
- —
- Monthly P&I
- —
- Monthly cashflow
- —
- DSCR
- —
- Eligible?
- —
No personal income docs; deal must DSCR.
Hard money
10% down · 12.0% · 12mo
- Down + closing
- —
- Monthly P&I
- —
- Monthly cashflow
- —
- DSCR
- —
- Eligible?
- —
Short-term bridge; refi at stabilization.
Rent comps 14 comps
| Address | Beds | Baths | Sqft | Rent | $/sqft | DOM | Units | Dist |
|---|---|---|---|---|---|---|---|---|
| 1413 W 12th St Lorain, OH | 4.0 | 1.5 | 1725 | $1,700 | $0.99 | 43d | 1 | 0.18mi |
| 1322 Brownell Ave Lorain, OH | 4.0 | 1.0 | 1571 | $1,570 | $1.00 | 43d | 1 | 0.25mi |
| 1220 W Erie Ave Lorain, OH | 2.0 | 2.0 | 1458 | $1,050 | $0.72 | 1d | 1 | 0.51mi |
| 1220 W 19th St Lorain, OH | 4.0 | 1.0 | 1492 | $1,550 | $1.04 | 23d | 1 | 0.52mi |
| 1037 Washington Ave Lorain, OH | 4.0 | 2.0 | 1567 | $1,600 | $1.02 | 17d | 1 | 0.59mi |
| 1028 W 5th St Lorain, OH | 3.0 | 2.0 | 1250 | $1,650 | $1.32 | 43d | 1 | 0.59mi |
| 760 W 9th St Lorain, OH | 4.0 | 2.0 | 1987 | $1,600 | $0.81 | 43d | 1 | 0.66mi |
| 220 Hamilton Ave Lorain, OH | 2.0 | 1.0 | 1848 | $950 | $0.51 | 21d | 1 | 0.67mi |
| 930 W 18th St Lorain, OH | 4.0 | 1.0 | 1344 | $1,450 | $1.08 | 43d | 1 | 0.73mi |
| 1906 N Leavitt Rd Unit 1496120P Lorain, OH | 3.0 | 2.0 | 1517 | $5,246 | $3.46 | 2d | 1 | 0.80mi |
| 1703 Oakdale Ave Lorain, OH | 3.0 | 1.0 | 1237 | $1,300 | $1.05 | 2d | 1 | 0.93mi |
| 1512 Lexington Ave Lorain, OH | 2.0 | 1.0 | 2476 | $1,150 | $0.46 | 43d | 1 | 0.99mi |
| 704 W 21st St Lorain, OH | 4.0 | 1.0 | 1410 | $1,450 | $1.03 | 23d | 1 | 1.03mi |
| 128 W 22nd St Lorain, OH | 3.0 | 1.0 | 1402 | $1,470 | $1.05 | 43d | 1 | 1.34mi |
Listing history 11 events
-
2026-06-18days on market $120,000 Active 14 DOM
-
2026-06-17price $120,000 Active 13 DOM
-
2026-06-17days on market $140,000 Active 13 DOM
-
2026-06-16days on market $140,000 Active 12 DOM
-
2026-06-15days on market $140,000 Active 11 DOM
-
2026-06-13days on market $140,000 Active 9 DOM
-
2026-06-13days on market $140,000 Active 8 DOM
-
2026-06-09days on market $140,000 Active 5 DOM
-
2026-06-08days on market $140,000 Active 4 DOM
-
2026-06-07remarks 699-char remark
-
2026-06-07$140,000 Active 3 DOM
ⓘ Source: listings_history table (triggers on properties + properties_extension) + one-shot
backfill from property_details.listing_events for pre-trigger history.
Tax reassessment forecast OH · Partial reset (capped growth)
- Current annual tax
- $1,558 · $130/mo
- Projected year-2 tax
- $1,715 · $143/mo
- Expected delta
- +$157/yr (+$13/mo · 10.1%)
ⓘ Screening estimate from a state-policy table — verify with the county assessor before closing.
Climate risk First Street
- Flood 1/10 Low FEMA zone X (unshaded) · 0% chance over 30 yrs
- Wildfire 1/10 Low
- Heat 3/10 Moderate 7 d/yr ≥98°F today · 17 d/yr by 30 yrs out
- Wind 1/10 Low
- Air quality 2/10 Low 2 unhealthy d/yr today · 2 by 30 yrs out
Nearby sold comps map
Loading sold comps map…
Walkable amenities ~0.75 mi
Loading nearby amenities…
Taxation est. · year 1
- Rental income
- $18,330
- − Mortgage interest
- −$6,722
- − Property taxes
- −$1,558
- − Insurance
- −$600
- − Repairs & maintenance
- −$1,466
- − Management
- −$1,466
- − Depreciation
- −$3,491
- Taxable income
- $3,027
- Est. tax owed @ 24.0%
- −$726
- After-tax cash flow
- $4,045/yr
For passive investors: Depreciation is non-cash, so a rental often shows a tax loss while cash-flowing — sheltering income. Rental losses are passive: they offset passive income freely, and up to $25,000/yr can offset ordinary (W-2) income if you actively participate and your MAGI is under $100k (phasing out to $0 by $150k); unused losses carry forward. On sale, claimed depreciation is recaptured at up to 25%, and gains may owe capital-gains tax (a 1031 exchange can defer both). Figures are a year-1 estimate at your 24.0% rate — not tax advice; consult a CPA.
Schools (NCES district)
- District
- Lorain City
- NCES district ID
- 3904426
- Math proficiency
- 13% ▼ -24.00%
- Reading proficiency
- 26% ▼ -10.00%
- Median HH income
- $32,823
- Composite
- 15.81/100
- National rank
- #9266
- State rank
- #633 of 656 in OH
Livability — Lorain
- Score
- 67/100
- State rank
- #595
- US rank
- #10183
Category grades
Schools grade is shown separately in the Schools card above.
Census & demographics
- Census place
- Lorain, OH
- County
- Lorain County · 219,437 people
- City population
- 69,409
- Metro
- Cleveland-Elyria, OH
- Population (ZIP)
- 28,282
- Household income
- $45,023
- Rent vs Own
- Severe rent burden
- 1423.0
Population outlook (Lorain County) Hauer SSP2
- Today (2025)
- 314,924 people
- By 2030
- 317,546 · +0.8%
- By 2040
- 317,962 · +1.0%
- By 2050
- 312,872 · -0.7%
- By 2075
- 301,806 · -4.2%
- By 2100
- 278,271 · -11.6%
Race, ethnicity, and origin ACS 2023
- Neighborhood character
- Diverse neighborhood (Simpson 0.66)
- Race & ethnicity
- White 49% Hispanic / Latino 24% Black 21% Two or more races 16%
- Hispanic origin (detail)
- Mexican 5% Puerto Rican 17%
- Common ancestry
- Romanian 6% Lithuanian 1% Iranian 1%
- Foreign-born
- 3% · Canada, Vietnam
- Languages at home
- 84% English-only · Spanish 14%
Political lean MEDSL · Lorain
- 2024 margin
- Lean R (+5.7) · D 46.7% · R 52.4%
- 2008→2024 swing
- -23.6pp toward R · 2008: 17.9pp · 2024: -5.7pp
- All cycles
- 2024: R+5.7 2020: R+2.5 2016: R+0.3 2012: D+14.4 2008: D+17.9
Not yet ingested
- Civics
- —
Market trends
- HPI YoY
- ▼ -73.23%
- Current HPI
- 186.9657
- Rent YoY
- ▲ 4.09%
- Metro
- Cleveland-Elyria, OH
- State GDP YoY
- ▲ 1.98%
- F500 in state
- 48
Industry mix (Fortune 500 HQ in OH)
| Industry | F500 HQs | Revenue |
|---|---|---|
| Insurance | 3 | $145B |
|
||
| Industrial Machinery | 3 | $49B |
|
||
| Financial Services | 3 | $24B |
|
||
| Consumer Goods | 2 | $93B |
|
||
| Aerospace / Defense | 2 | $47B |
|
||
| Utilities | 2 | $33B |
|
||
Price history
1 event — show timeline
- 2026-06-04 Listed $140,000 MLSNOW
Property tax history
+2.1%/yrLatest (2025): $1,558 · -27.0% YoY. Source: county tax records.
Cash-flow waterfall
monthlySold comps — $/sqft
last 12 mo · ≤1 miLoading sold comps…