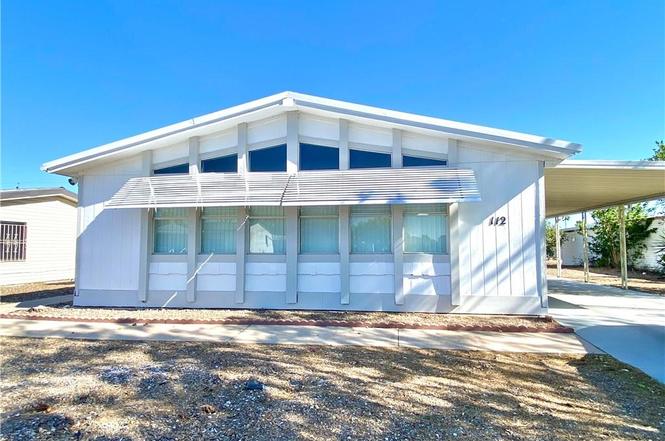
112 Buckboard Dr · Mission, TX
Flood risk 1/10 · Minimal
- FEMA flood zone
- X
- Chance of flooding over 30 yrs
- 0.0%
- Est. flood insurance / yr
- $507 – $1,088
Fire risk 1/10 · Minimal
- Est. fire insurance / yr
- $1,222 – $2,270
Heat risk 9/10 · Severe
- Hot days now (above 111°F)
- 7 days/yr
- Hot days in 30 yrs
- 22 days/yr
Wind risk 8/10 · Major
- Chance of severe wind over 30 yrs
- 98.0%
Air-quality risk 2/10 · Minimal
- Unhealthy air days now
- 1 days/yr
- Unhealthy air days in 30 yrs
- 2 days/yr
Risk factors via First Street. Map © Google.
Why this score? — see what drove the C grade
The composite is a weighted blend of 9 inputs, each scored 0–100. Each bar is that input's sub-score; the figure is the points it added to the 100-point composite (weight × sub-score).
- Cash flow +24.3/30.0
- DSCR +7.8/10.0
- 1% rule +7.6/10.0
- ARV discount +7.3/15.0
- Livability +3.8/5.0
- Rent growth +2.5/5.0
- Condition / age +2.5/5.0
- Schools +1.7/10.0
- Appreciation +0.0/10.0
$119,900
🖨 Deal sheet (PDF) 📄 Offer letter ✓ Due diligence
Listing remarks
Spectacular open and airy living space in this 28' x 52' Palm Harbor mobile home, which comes fully furnished and move-in ready. The nicely designed kitchen offers plenty of counter and cabinet space, along with a pantry, and sits just off the dining room with an open view into the spacious living room—perfect for entertaining. This home has been beautifully updated with fresh interior and exterior paint, updated flooring, a new hot water heater, HVAC system, light fixtures, ceiling fans, faucets, refrigerator, washer, dryer and window blinds and drapes. Enjoy oversized bedrooms with walk-in closets and spacious bathrooms. The primary suite features a step-in shower and double vanity.
Key facts
- Pantry
- Updated flooring
- 6,777 sq ft lot
Tags
Property features AI
Finance
- Other: Living area source: HidalgoCAD
- Financial info: Escrow amount noted
- HOA & community: Mandatory POA/association (Wagon City South); Association fee $400 annually; Community pool; Senior community
Exterior
- Parking: 1 total parking space; 1 covered space; 1-car carport; Attached parking; garage faces front (no garage spaces)
- Security: Smoke detector(s)
- Utilities: Public water; City sewer; Cable available; Electric utilities
- Home design: Single-family property; Own lot
- Construction: Metal roof; Pillar/post/pier foundation; Other construction materials; Building area approximately 1,456
- Exterior features: Covered patio; Alley access; Paved road
Interior
- Kitchen: Stove/Range; Refrigerator; Microwave; Electric water heater
- Bedrooms: Master bedroom with walk-in closet
- Flooring: Laminate
- Bathrooms: 2 full bathrooms
- Heating & cooling: Central heating (electric); Central air conditioning (electric)
- Interior features: Ceiling fan(s); Built-in features; Countertops (other); Walk-in closet(s); Window coverings (vertical blinds and other); Smoke detector(s)
- Laundry & utility: Washer and dryer included; Dedicated laundry area
Neighborhood map
What this means for you Summary
Snapshot
- This is a 2-bed/1.0-bath manufactured listed at $120k.
Deal economics
- At list price, monthly cash flow is $240 ($3k/yr) — positive.
- The deal already cash-flows at list — no discount required.
- Meets the 1% rule at list price ($2k rent vs $120k).
- Recommended offer: $116k (3.0% below list) — sets the bar for market timing.
- Cap rate 8.7% vs local median 3.5% in Mission — top-decile yield for the area; either an underpriced asset or a hidden risk that comps aren't pricing in. Stress-test before assuming the spread holds.
Location & tenants
- Location reads 75/100 on livability (#148 in TX, #4,155 nationally) — a middle-class / working-renter tenant base. Strengths: cost of living A+, housing A+, health & safety A+; Watch: amenities F, commute F, employment D-.
- Mission CISD (urban): math 15% / reading 28% proficiency, ranked #775 of 826 in TX (top 94%) — low school quality limits family demand, transient renter base, plan for 1-2y turnover; 78% free/reduced lunch — lower-income household profile, screen leases tightly.
- Zoned schools: Mims El (math 32% / reading 32%, grade F, #2,268 of 4,322 statewide, top 55%, 697 students, 65% FRL); Mission J H (math 13% / reading 26%, grade F, #1,445 of 1,662 statewide, top 88%, 680 students, 78% FRL); Mission H S (math 18% / reading 28%, grade F, #1,348 of 1,632 statewide, top 83%, 2,218 students, 91% FRL) — zoned schools at 78% FRL track the district average.
- Market conditions: 477 active listings in the ZIP; 25 comparable units currently listed for rent nearby; rentals at typical pace (median 25d on market — plan ~3-4 weeks tenant-placement turnaround); 48% of comp listings sitting > 30 days — soft ceiling on asking rent; 7,378 units permitted in Hidalgo County in 2024 (641 in 5+ unit buildings).
- This rent runs 35% of the median local income ($52k/yr) — at the standard rent-burdened threshold; future hikes will face affordability resistance.
Forward outlook
- Local home prices are declining (-3.0%/yr); year-one equity from $829 of loan paydown is wiped out by about $4k of value loss. Plan a longer hold.
- Hidalgo County population projected at +28% by 2050 — long-run rental-demand tailwind backs the buy-and-hold thesis.
Negotiation context
- It's been on market 55 days — a 3% lower offer ($116k) is reasonable based on typical stale-listing flexibility.
Risks & watch-outs
- Climate carrying-cost: severe wind risk, 98% chance of damaging wind over 30y; extreme-heat days projected 7→22/yr by 2055 (HVAC capex compounding) — expect insurance premiums to compound above CPI over the hold.
Questions for the listing agent
- It's been on market 55 days. Have you received any prior offers? Is the seller open to a 3% concession, seller financing, or rate buy-down credit?
- What does the HOA fee cover, when was the last increase, and are there any pending special assessments or reserve-fund shortfalls?
- Is there a deadline driving the sale (1031 exchange, divorce, estate, relocation)? That informs how much negotiation room exists.
- What's the average days-on-market for RENTAL listings here right now (not sales)? A rising rental-DOM trend means longer vacancies and softer asking-rent achievability than the comps imply.
- What's the recent tenant-quality profile in this submarket — average credit score on applications, eviction rate, late-payment / NSF rate, and stable-employment percentage? A property-management company in the area should have these aggregated.
- How much new for-sale + rental construction is in the pipeline within 1–3 miles? Heavy new supply typically softens prices + rents 12–24 months out; constrained supply supports both.
Investment metrics
- 1% rule
- 1.26% ✓
- Cap rate
- 8.70%
- Cash-on-cash
- 8.60%
- DSCR
- 1.38
- GRM
- 6.6
CMA / ARV
- ARV (on-the-fly)
- $119,392
- Comps found
- 6
Show comp detail 6 sales within ~0.75 mi
| Address | Dist | Beds/Ba | Sqft | Sold | Price | $/sf | Match |
|---|---|---|---|---|---|---|---|
| 112 Buckboard Dr | 0.00mi | 2/2.0 | 1,456 (0%) | 0mo | $119,900 | $82 | 96 |
| 209 Buckboard Dr | 0.09mi | 2/2.0 | 1,568 (+8%) | 3mo | $85,000 | $54 | 76 |
| 213 Buckboard Dr | 0.11mi | 3/2.0 (+1) | 1,530 (+5%) | 2mo | $139,900 | $91 | 75 |
| 201 Stage Coach Dr | 0.12mi | 2/2.0 | 1,344 (-8%) | 9mo | $110,000 | $82 | 70 |
| 219 Bundle Wagon Dr | 0.25mi | 2/2.0 | 1,252 (-14%) | 4mo | $79,900 | $64 | 58 |
| 108 Covered Wagon Dr | 0.14mi | 3/2.0 (+1) | 1,656 (+14%) | 14mo | $99,000 | $60 | 50 |
Match score weights: distance 35% · size 25% · config 20% · recency 20%. Top-matched comps best support the ARV.
Projected returns pro-forma
-3.0% appreciation · 3.0% rent growth · sell at horizon
- IRR
- -3.2%
- Equity multiple
- 0.88×
- Total profit
- $-4,014
- Equity at exit
- $17,877
- IRR
- 6.6%
- Equity multiple
- 1.50×
- Total profit
- $16,632
- Equity at exit
- $10,367
Cash invested: $33,572 (down + closing). Projections, not guarantees.
Landlord ↔ Tenant lean methodology
- Overall (STATE)
- 87 Strongly Landlord-Friendly
- State Texas
- 87 Strongly Landlord-Friendly · R+5
- County
- — inherits STATE
- City
- — inherits STATE
ZIP-level market 78574
- Home prices YoY
- -16.1%
- Active inventory
- 477
- Price-to-rent
- 6.6×
Monthly cashflow live
- Estimated rent
- $1,512 high interval (Pro) →
- Mortgage (P&I)
- −$629
- Tax from tax record
- −$242 /mo · $2,908/yr
- Insurance
- −$50
- HOA
- −$33
- Vacancy / Maint / Mgmt
- −$318
- Net cashflow
- $240
Break-even live
Sensitivity live
| Price | -10% $308 | -5% $274 | +0% $240 | +5% $207 | +10% $173 |
|---|---|---|---|---|---|
| Rent | -10% $121 | -5% $181 | +0% $240 | +5% $300 | +10% $360 |
| Rate | -1.0pp $301 | -0.5pp $271 | base $240 | +0.5pp $209 | +1.0pp $178 |
UW: 25.0% down · 7.5% · 30yr · 1.5% tax · 5.0% vac · 8.0% maint · 8.0% mgmt
Financing live
Cash to close
- Down payment
- $29,975
- Closing costs
- $3,597
- Reserves months
- —
- Total cash needed
- —
Loan-product check · same deal, 3 products live
Conventional
25% down · 7.5% · 30yr
- Down + closing
- —
- Monthly P&I
- —
- Monthly cashflow
- —
- DSCR
- —
- Eligible?
- —
Personal DTI + credit; lowest rate.
DSCR
20% down · 8.5% · 30yr
- Down + closing
- —
- Monthly P&I
- —
- Monthly cashflow
- —
- DSCR
- —
- Eligible?
- —
No personal income docs; deal must DSCR.
Hard money
10% down · 12.0% · 12mo
- Down + closing
- —
- Monthly P&I
- —
- Monthly cashflow
- —
- DSCR
- —
- Eligible?
- —
Short-term bridge; refi at stabilization.
Rent comps 25 comps
| Address | Beds | Baths | Sqft | Rent | $/sqft | DOM | Units | Dist |
|---|---|---|---|---|---|---|---|---|
| 702 W 25th St Mission, TX | 3.0 | 2.0 | 1375 | $1,650 | $1.20 | 20d | 1 | 0.53mi |
| 607 Alameda Dr Mission, TX | 3.0 | 2.5 | 1731 | $2,200 | $1.27 | 46d | 1 | 0.53mi |
| 3209 Black Oak Ln Mission, TX | 3.0 | 2.5 | 1672 | $1,700 | $1.02 | 16d | 1 | 0.59mi |
| 2008 N Cummings Ave Mission, TX | 3.0 | 2.0 | 1012 | $1,300 | $1.28 | 45d | 1 | 0.71mi |
| 2002 Thornton St Mission, TX | 3.0 | 2.0 | 1374 | $1,300 | $0.95 | 45d | 1 | 0.77mi |
| 3401 N Mayberry Rd Mission, TX | 3.0 | 2.0 | 1150 | $961 | $0.84 | 45d | 1 | 0.88mi |
| 707 Palmer Rd Unit 2 Mission, TX | 1.0 | 1.0 | 960 | $900 | $0.94 | 16d | 1 | 0.89mi |
| 707 Palmer Rd Unit 3 Mission, TX | 3.0 | 2.0 | 960 | $1,350 | $1.41 | 16d | 1 | 0.89mi |
| 712 Palmer Rd Unit 1 Mission, TX | 2.0 | 2.0 | 960 | $1,100 | $1.15 | 16d | 1 | 0.94mi |
| 1809 Ramirez St Unit 2 Mission, TX | 3.0 | 2.0 | 1033 | $1,300 | $1.26 | 45d | 1 | 1.14mi |
| 221 W 14th St Mission, TX | 3.0 | 2.0 | 1290 | $1,100 | $0.85 | 45d | 1 | 1.16mi |
| 1400 N Dunlap Ave Mission, TX | 2.0 | 1.0 | 1068 | $800 | $0.75 | 20d | 1 | 1.17mi |
| 1827 Highland Park Ave Unit 1 Mission, TX | 2.0 | 2.0 | 1300 | $1,200 | $0.92 | 45d | 1 | 1.19mi |
| 1801 Highland Park Ave Mission, TX | 2.0 | 2.0 | 1173 | $1,500 | $1.28 | 20d | 1 | 1.25mi |
| 1707 Highland Park Ave Unit 4-B Mission, TX | 2.0 | 2.0 | 1336 | $1,200 | $0.90 | 16d | 1 | 1.26mi |
| 1006 Fairway Dr Mission, TX | 2.0 | 2.0 | 1072 | $1,100 | $1.03 | 45d | 1 | 1.31mi |
| 2903 Estevan St #4 Mission, TX | 3.0 | 2.0 | 1056 | $1,399 | $1.32 | 20d | 1 | 1.33mi |
| 2905 Estevan St #3 Mission, TX | 2.0 | 2.0 | 1044 | $1,300 | $1.25 | 25d | 1 | 1.33mi |
| 2903 Estevan St #3 Mission, TX | 3.0 | 2.0 | 1044 | $1,400 | $1.34 | 16d | 1 | 1.33mi |
| 2905 Estevan St #4 Mission, TX | 3.0 | 2.0 | 1044 | $1,300 | $1.25 | 45d | 1 | 1.33mi |
| 3006 Gabriel St Mission, TX | 3.0 | 2.0 | 1433 | $1,600 | $1.12 | 45d | 1 | 1.33mi |
| 3102 Gabriel St Mission, TX | 3.0 | 2.0 | 1370 | $1,800 | $1.31 | 45d | 1 | 1.34mi |
| 1805 Ramirez St Unit 4 Mission, TX | 3.0 | 2.0 | 1020 | $1,095 | $1.07 | 45d | 1 | 1.43mi |
| 1804 Ramirez St Unit 1 Mission, TX | 3.0 | 2.0 | 1020 | $1,250 | $1.23 | 25d | 1 | 1.45mi |
| 7102 N 56th Ln Unit 1 Mission, TX | 2.0 | 2.0 | 980 | $1,075 | $1.10 | 22d | 1 | 1.45mi |
HOA detail
- Monthly dues
- $33 · $396/yr
- Likely covers
- water
Listing history 4 events
-
2026-05-07status Pending
-
2026-04-28historical Option
-
2026-03-12$119,900 Active
-
2002-04-10soldstatus
ⓘ Source: listings_history table (triggers on properties + properties_extension) + one-shot
backfill from property_details.listing_events for pre-trigger history.
Tax reassessment forecast TX · Resets to sale price
- Current annual tax
- $2,908 · $242/mo
- Projected year-2 tax
- $2,908 · $242/mo
- Expected delta
- $0/yr ($0/mo · 0.0%)
ⓘ Screening estimate from a state-policy table — verify with the county assessor before closing.
Climate risk First Street
- Flood 1/10 Low FEMA zone X · 0% chance over 30 yrs
- Wildfire 1/10 Low
- Heat 9/10 Extreme 7 d/yr ≥111°F today · 22 d/yr by 30 yrs out
- Wind 8/10 Severe 98% chance of damaging wind over 30 yrs
- Air quality 2/10 Low 1 unhealthy d/yr today · 2 by 30 yrs out
Nearby sold comps map
Loading sold comps map…
Walkable amenities ~0.75 mi
Loading nearby amenities…
Taxation est. · year 1
- Rental income
- $18,144
- − Mortgage interest
- −$6,716
- − Property taxes
- −$2,908
- − Insurance
- −$600
- − Repairs & maintenance
- −$1,452
- − Management
- −$1,452
- − HOA
- −$396
- − Depreciation
- −$3,488
- Taxable income
- $1,134
- Est. tax owed @ 24.0%
- −$272
- After-tax cash flow
- $2,613/yr
For passive investors: Depreciation is non-cash, so a rental often shows a tax loss while cash-flowing — sheltering income. Rental losses are passive: they offset passive income freely, and up to $25,000/yr can offset ordinary (W-2) income if you actively participate and your MAGI is under $100k (phasing out to $0 by $150k); unused losses carry forward. On sale, claimed depreciation is recaptured at up to 25%, and gains may owe capital-gains tax (a 1031 exchange can defer both). Figures are a year-1 estimate at your 24.0% rate — not tax advice; consult a CPA.
Schools (NCES district)
- District
- Mission CISD
- NCES district ID
- 4831040
- Math proficiency
- 15% ▼ -35.00%
- Reading proficiency
- 28% ▼ -15.00%
- Median HH income
- $32,855
- Composite
- 17.47/100
- National rank
- #9061
- State rank
- #775 of 826 in TX
Livability — Mission
- Score
- 75/100
- State rank
- #148
- US rank
- #4155
Category grades
Schools grade is shown separately in the Schools card above.
Census & demographics
- Census place
- Mission, TX
- County
- Hidalgo County · 623,128 people
- City population
- 78,024
- Metro
- McAllen-Edinburg-Mission, TX
- Population (ZIP)
- 62,456
- Household income
- $52,393
- Rent vs Own
- Severe rent burden
- 803.0
Population outlook (Hidalgo County) Hauer SSP2
- Today (2025)
- 955,232 people
- By 2030
- 1,009,774 · +5.7%
- By 2040
- 1,120,332 · +17.3%
- By 2050
- 1,225,036 · +28.2%
- By 2075
- 1,439,189 · +50.7%
- By 2100
- 1,533,429 · +60.5%
Race, ethnicity, and origin ACS 2023
- Neighborhood character
- Predominantly Hispanic (97%)
- Race & ethnicity
- Hispanic / Latino 97% Two or more races 62% White 2%
- Hispanic origin (detail)
- Mexican 93%
- Foreign-born
- 33% · Canada
- Languages at home
- 12% English-only · Spanish 87%
Political lean MEDSL · Hidalgo
- 2024 margin
- Toss-up / Even · D 48.1% · R 51.0%
- 2008→2024 swing
- -41.6pp toward R · 2008: 38.7pp · 2024: -2.9pp
- All cycles
- 2024: R+2.9 2020: D+17.1 2016: D+40.5 2012: D+41.8 2008: D+38.7
Not yet ingested
- Civics
- —
Market trends
- HPI YoY
- ▼ -44.13%
- Current HPI
- 230.3323
- Rent YoY
- —
- Metro
- McAllen-Edinburg-Mission, TX
- State GDP YoY
- ▲ 3.95%
- F500 in state
- 110
Industry mix (Fortune 500 HQ in TX)
| Industry | F500 HQs | Revenue |
|---|---|---|
| Energy | 16 | $1,198B |
|
||
| Technology | 5 | $198B |
|
||
| Engineering / Construction | 4 | $72B |
|
||
| Energy Services | 3 | $60B |
|
||
| Utilities | 3 | $41B |
|
||
| Healthcare | 2 | $330B |
|
||
Price history
4 events — show timeline
- 2026-05-07 Pending — MCALLENMLS
- 2026-04-28 Contingent — MCALLENMLS
- 2026-03-12 Listed $119,900 MCALLENMLS
- 2002-04-10 Sold (Public Records) — Public Records
Property tax history
+8.1%/yrLatest (2025): $2,908 · +20.0% YoY. Source: county tax records.
Cash-flow waterfall
monthlySold comps — $/sqft
last 12 mo · ≤1 miLoading sold comps…