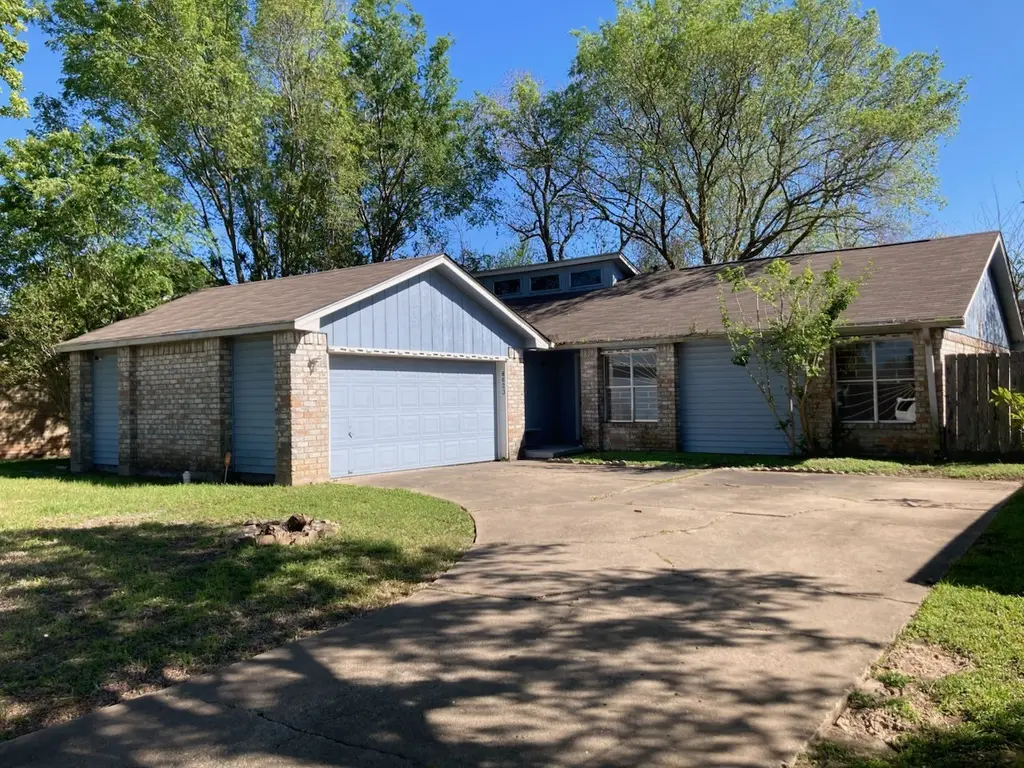
8623 Quail Hills Dr · Houston, TX
Flood risk 4/10 · Minor
- FEMA flood zone
- X (unshaded)
- Chance of flooding over 30 yrs
- 0.21%
- Est. flood insurance / yr
- $507 – $1,088
Fire risk 2/10 · Minimal
- Est. fire insurance / yr
- $1,222 – $2,270
Heat risk 9/10 · Severe
- Hot days now (above 110°F)
- 7 days/yr
- Hot days in 30 yrs
- 23 days/yr
Wind risk 9/10 · Severe
- Chance of severe wind over 30 yrs
- 99.0%
Air-quality risk 3/10 · Minor
- Unhealthy air days now
- 2 days/yr
- Unhealthy air days in 30 yrs
- 3 days/yr
Risk factors via First Street. Map © Google.
Why this score? — see what drove the C grade
The composite is a weighted blend of 9 inputs, each scored 0–100. Each bar is that input's sub-score; the figure is the points it added to the 100-point composite (weight × sub-score).
- Cash flow +14.9/30.0
- ARV discount +14.8/15.0
- 1% rule +5.0/10.0
- Appreciation +4.7/10.0
- DSCR +4.6/10.0
- Schools +4.5/10.0
- Livability +3.7/5.0
- Rent growth +2.6/5.0
- Condition / age +2.5/5.0
$195,000
🖨 Deal sheet (PDF) 📄 Offer letter ✓ Due diligence
Listing remarks MLS
** Reduction to account for personal touches ** Charming, bright, open floorplan. Beautiful entry opens to large spacious family room with cozy corner fireplace and high ceilings. Nice formal dining room, perfect for hosting holiday family dinners. Great kitchen with eat-in bar and separate breakfast area. Large master and secondary bedrooms. New luxury wood plank vinyl flooring in entry, hallway, and bedrooms. Large tiles in living areas and kitchen Backyard pergola and fenced yard. Attached swing double-car garage offers additional garage and driveway spacing. Appliances to remain in home. Community parks with walking trails nearby. Close to shopping, dining, and entertainment options. Welcome home!
Key facts
- Breakfast nook
- Fenced yard
- Open floorplan
Tags
Neighborhood map
What this means for you Summary
Snapshot
- This is a 3-bed/3.0-bath single-family listed at $195k.
Deal economics
- At list price, monthly cash flow is $57 ($681/yr) — positive.
- The deal already cash-flows at list — no discount required.
- Meets the 1% rule at list price ($2k rent vs $195k).
- Recommended offer: $183k (6.0% below list) — sets the bar for market timing.
- Cap rate 6.6% vs local median 3.2% in Houston — top-decile yield for the area; either an underpriced asset or a hidden risk that comps aren't pricing in. Stress-test before assuming the spread holds.
Location & tenants
- Location reads 74/100 on livability (#184 in TX, #4,771 nationally) — a middle-class / working-renter tenant base. Strengths: amenities A+, cost of living A+, housing A+; Watch: crime F.
- Fort Bend ISD (suburban): math 44% / reading 53% proficiency, ranked #140 of 826 in TX (top 17%) — families likely to look elsewhere, expect single-tenant / working-renter base with shorter leases.
- Zoned schools: Edgar Glover Jr El (math 42% / reading 37%, grade F, #1,545 of 4,322 statewide, top 38%, 380 students, 87% FRL); Missouri City Middle (math 19% / reading 35%, grade F, #1,177 of 1,662 statewide, top 72%, 963 students, 88% FRL); Thurgood Marshall H S (math 11% / reading 30%, grade F, #1,389 of 1,632 statewide, top 86%, 1,542 students, 82% FRL) — zoned schools average 86% FRL vs 35% district-wide (51 pts higher); higher-poverty schools than district average — tighter screening recommended.
- Zoned-school proficiency averages 29% at this address vs 48% district-wide (-20 pts) — the specific schools serving this property underperform the Fort Bend ISD average; the district grade overstates school quality for this exact location.
- Market conditions: Rents flat; 188 active listings in the ZIP; 10 comparable units currently listed for rent nearby; rentals at typical pace (median 23d on market — plan ~3-4 weeks tenant-placement turnaround); 12,093 units permitted in Fort Bend County in 2024 (815 in 5+ unit buildings).
- This rent runs 31% of the median local income ($75k/yr) — at the standard rent-burdened threshold; future hikes will face affordability resistance.
Forward outlook
- In year one you build about $273 of equity ($1k loan paydown + $-1k appreciation (-0.6% local appreciation)).
- Fort Bend County population projected at +75% by 2050 — long-run rental-demand tailwind backs the buy-and-hold thesis.
Negotiation context
- It's been on market 76 days — a 6% lower offer ($183k) is reasonable based on typical stale-listing flexibility.
- 2 sale attempts since 23y ago; this cycle's ask has dropped $13k (6%) from the opening price — seller is motivated, your offer sets the floor, not the list.
Risks & watch-outs
- Climate carrying-cost: severe wind risk, 99% chance of damaging wind over 30y; extreme-heat days projected 7→23/yr by 2055 (HVAC capex compounding) — expect insurance premiums to compound above CPI over the hold.
Questions for the listing agent
- It's been on market 76 days. Have you received any prior offers? Is the seller open to a 6% concession, seller financing, or rate buy-down credit?
- Built in 1978 — when were the roof, HVAC, electrical panel, plumbing, and water heater last replaced?
- What does the HOA fee cover, when was the last increase, and are there any pending special assessments or reserve-fund shortfalls?
- Why hasn't it sold? Are there any deal-killer items the seller is aware of (foundation, flood, title, zoning, code violations)?
- Is there a deadline driving the sale (1031 exchange, divorce, estate, relocation)? That informs how much negotiation room exists.
- Schools are D-rated, which usually means shorter tenancies and higher turnover. Who's the typical renter profile here, and what's been the actual vacancy rate?
- Crime grade is F in this area — have there been break-ins, vandalism, or insurance claims at this property in the last 3 years? What carrier currently insures it and at what premium?
- What's the average days-on-market for RENTAL listings here right now (not sales)? A rising rental-DOM trend means longer vacancies and softer asking-rent achievability than the comps imply.
- What's the recent tenant-quality profile in this submarket — average credit score on applications, eviction rate, late-payment / NSF rate, and stable-employment percentage? A property-management company in the area should have these aggregated.
- How much new for-sale + rental construction is in the pipeline within 1–3 miles? Heavy new supply typically softens prices + rents 12–24 months out; constrained supply supports both.
Investment metrics
- 1% rule
- 1.00% ✓
- Cap rate
- 6.64%
- Cash-on-cash
- 1.25%
- DSCR
- 1.06
- GRM
- 8.3
CMA / ARV
- ARV (median comp)
- $232,826
- List price
- $195,000
- Delta
- -16.25%
- Verdict
- UNDERPRICED
- Comps
- 20 within 1.0 mi
Show comp detail 12 sales within ~0.75 mi
| Address | Dist | Beds/Ba | Sqft | Sold | Price | $/sf | Match |
|---|---|---|---|---|---|---|---|
| 1410 Gentle Bend Dr | 0.42mi | 3/2.0 | 1,638 (-1%) | 1mo | $244,900 | $150 | 75 |
| 16718 Running Quail Ct | 0.37mi | 3/2.0 | 1,686 (+2%) | 1mo | $235,000 | $139 | 74 |
| 16610 Quail Prairie Dr | 0.40mi | 3/2.0 | 1,644 (-0%) | 4mo | $239,500 | $146 | 74 |
| 1222 New Tree Ln | 0.57mi | 3/2.5 | 1,644 (-0%) | 3mo | $169,900 | $103 | 69 |
| 1223 Gentle Bend Dr | 0.59mi | 3/2.5 | 1,693 (+3%) | 3mo | $249,900 | $148 | 63 |
| 2603 Lazy Spring Ct | 0.32mi | 3/2.0 | 1,488 (-10%) | 3mo | $230,000 | $155 | 62 |
| 8434 Quail Crest Dr | 0.55mi | 3/2.0 | 1,560 (-5%) | 3mo | $239,500 | $154 | 59 |
| 16711 Running Quail Ct | 0.35mi | 4/2.0 (+1) | 1,500 (-9%) | 3mo | $210,000 | $140 | 57 |
| 2507 Rittenmore Dr | 0.68mi | 4/2.0 (+1) | 1,568 (-5%) | 1mo | $235,000 | $150 | 50 |
| 2211 N Heatherwood Dr | 0.60mi | 3/2.0 | 1,805 (+10%) | 5mo | $268,900 | $149 | 48 |
| 2422 Doverglen Dr | 0.51mi | 4/2.5 (+1) | 1,848 (+12%) | 1mo | $249,000 | $135 | 48 |
| 2435 Buttonhill Dr | 0.67mi | 3/2.0 | 1,420 (-14%) | 3mo | $195,000 | $137 | 39 |
Match score weights: distance 35% · size 25% · config 20% · recency 20%. Top-matched comps best support the ARV.
Projected returns pro-forma
-0.55% appreciation · 0.34% rent growth · sell at horizon
- IRR
- -5.0%
- Equity multiple
- 0.78×
- Total profit
- $-12,070
- Equity at exit
- $51,308
- IRR
- -1.0%
- Equity multiple
- 0.91×
- Total profit
- $-5,149
- Equity at exit
- $57,579
Cash invested: $54,600 (down + closing). Projections, not guarantees.
Landlord ↔ Tenant lean methodology
- Overall (STATE)
- 87 Strongly Landlord-Friendly
- State Texas
- 87 Strongly Landlord-Friendly · R+5
- County
- — inherits STATE
- City
- — inherits STATE
ZIP-level market 77489
- Home prices YoY
- -0.2%
- Rents YoY
- 0.3%
- Active inventory
- 188
- Price-to-rent
- 8.3×
Monthly cashflow live
- Estimated rent
- $1,956 high interval (Pro) →
- Mortgage (P&I)
- −$1,023
- Tax from tax record
- −$350 /mo · $4,206/yr
- Insurance
- −$81
- HOA
- −$34
- Vacancy / Maint / Mgmt
- −$411
- Net cashflow
- $57
Break-even live
Sensitivity live
| Price | -10% $167 | -5% $112 | +0% $57 | +5% $2 | +10% $-54 |
|---|---|---|---|---|---|
| Rent | -10% $-98 | -5% $-21 | +0% $57 | +5% $134 | +10% $211 |
| Rate | -1.0pp $155 | -0.5pp $106 | base $57 | +0.5pp $6 | +1.0pp $-45 |
UW: 25.0% down · 7.5% · 30yr · 1.5% tax · 5.0% vac · 8.0% maint · 8.0% mgmt
Financing live
Cash to close
- Down payment
- $48,750
- Closing costs
- $5,850
- Reserves months
- —
- Total cash needed
- —
Loan-product check · same deal, 3 products live
Conventional
25% down · 7.5% · 30yr
- Down + closing
- —
- Monthly P&I
- —
- Monthly cashflow
- —
- DSCR
- —
- Eligible?
- —
Personal DTI + credit; lowest rate.
DSCR
20% down · 8.5% · 30yr
- Down + closing
- —
- Monthly P&I
- —
- Monthly cashflow
- —
- DSCR
- —
- Eligible?
- —
No personal income docs; deal must DSCR.
Hard money
10% down · 12.0% · 12mo
- Down + closing
- —
- Monthly P&I
- —
- Monthly cashflow
- —
- DSCR
- —
- Eligible?
- —
Short-term bridge; refi at stabilization.
Rent comps 10 comps
| Address | Beds | Baths | Sqft | Rent | $/sqft | DOM | Units | Dist |
|---|---|---|---|---|---|---|---|---|
| 16310 Setter Ct Missouri City, TX | 3.0 | 2.0 | 1672 | $1,700 | $1.02 | 45d | 1 | 0.42mi |
| 1215 New Tree Ln Missouri City, TX | 3.0 | 2.0 | 1323 | $1,725 | $1.30 | 14d | 1 | 0.57mi |
| 712 Beechbend Dr Missouri City, TX | 4.0 | 2.5 | 2245 | $2,250 | $1.00 | 22d | 1 | 0.68mi |
| 1806 Courtside Place Dr Missouri City, TX | 4.0 | 2.5 | 1974 | $1,915 | $0.97 | 14d | 1 | 0.79mi |
| 1919 Doliver Cir Missouri City, TX | 3.0 | 2.0 | 1515 | $2,000 | $1.32 | 45d | 1 | 0.89mi |
| 2026 Summer Place Dr Missouri City, TX | 3.0 | 2.0 | 1837 | $1,861 | $1.01 | 22d | 1 | 0.95mi |
| 15823 Baybriar Dr Missouri City, TX | 3.0 | 2.0 | 1335 | $1,641 | $1.23 | 7d | 1 | 1.08mi |
| 17318 Edgehaven Dr Missouri City, TX | 3.0 | 2.0 | 1448 | $1,695 | $1.17 | 22d | 1 | 1.10mi |
| 15703 Baybriar Dr Missouri City, TX | 3.0 | 2.0 | 1252 | $1,615 | $1.29 | 21d | 1 | 1.21mi |
| 507 Whippoorwill Dr Missouri City, TX | 3.0 | 2.0 | 1970 | $1,925 | $0.98 | 45d | 1 | 1.30mi |
HOA detail
- Monthly dues
- $34 · $408/yr
Listing history 19 events
-
2026-06-21days on market $195,000 Active 76 DOM
-
2026-06-18days on market $195,000 Active 73 DOM
-
2026-06-17days on market $195,000 Active 72 DOM
-
2026-06-16days on market $195,000 Active 71 DOM
-
2026-06-15days on market $195,000 Active 70 DOM
-
2026-06-13days on market $195,000 Active 68 DOM
-
2026-06-09days on market $195,000 Active 64 DOM
-
2026-06-07days on market $195,000 Active 62 DOM
-
2026-06-04days on market $195,000 Active 59 DOM
-
2026-06-03days on market $195,000 Active 58 DOM
-
2026-06-02days on market $195,000 Active 57 DOM
-
2026-06-01days on market $195,000 Active 56 DOM
-
2026-05-31days on market $195,000 Active 55 DOM
-
2026-05-06price $195,000 711-char remark
Show marketing remark (711 chars)
** Reduction to account for personal touches ** Charming, bright, open floorplan. Beautiful entry opens to large spacious family room with cozy corner fireplace and high ceilings. Nice formal dining room, perfect for hosting holiday family dinners. Great kitchen with eat-in bar and separate breakfast area. Large master and secondary bedrooms. New luxury wood plank vinyl flooring in entry, hallway, and bedrooms. Large tiles in living areas and kitchen Backyard pergola and fenced yard. Attached swing double-car garage offers additional garage and driveway spacing. Appliances to remain in home. Community parks with walking trails nearby. Close to shopping, dining, and entertainment options. Welcome home!
-
2026-04-06$208,000 Active 711-char remark
Show marketing remark (711 chars)
** Reduction to account for personal touches ** Charming, bright, open floorplan. Beautiful entry opens to large spacious family room with cozy corner fireplace and high ceilings. Nice formal dining room, perfect for hosting holiday family dinners. Great kitchen with eat-in bar and separate breakfast area. Large master and secondary bedrooms. New luxury wood plank vinyl flooring in entry, hallway, and bedrooms. Large tiles in living areas and kitchen Backyard pergola and fenced yard. Attached swing double-car garage offers additional garage and driveway spacing. Appliances to remain in home. Community parks with walking trails nearby. Close to shopping, dining, and entertainment options. Welcome home!
-
2004-05-24soldstatus
-
2003-10-31historical
-
2003-08-31$99,900
-
1995-10-04soldstatus
ⓘ Source: listings_history table (triggers on properties + properties_extension) + one-shot
backfill from property_details.listing_events for pre-trigger history.
Tax reassessment forecast TX · Resets to sale price
- Current annual tax
- $4,206 · $350/mo
- Projected year-2 tax
- $4,206 · $350/mo
- Expected delta
- $0/yr ($0/mo · 0.0%)
ⓘ Screening estimate from a state-policy table — verify with the county assessor before closing.
Climate risk First Street
- Flood 4/10 Moderate FEMA zone X (unshaded) · 21% chance over 30 yrs
- Wildfire 2/10 Low
- Heat 9/10 Extreme 7 d/yr ≥110°F today · 23 d/yr by 30 yrs out
- Wind 9/10 Extreme 99% chance of damaging wind over 30 yrs
- Air quality 3/10 Moderate 2 unhealthy d/yr today · 3 by 30 yrs out
Nearby sold comps map
Loading sold comps map…
Walkable amenities ~0.75 mi
Loading nearby amenities…
Taxation est. · year 1
- Rental income
- $23,469
- − Mortgage interest
- −$10,923
- − Property taxes
- −$4,206
- − Insurance
- −$975
- − Repairs & maintenance
- −$1,878
- − Management
- −$1,878
- − HOA
- −$408
- − Depreciation
- −$5,673
- Taxable loss
- −$2,470
- Est. tax savings @ 24.0%
- +$593
- After-tax cash flow
- $1,274/yr
For passive investors: Depreciation is non-cash, so a rental often shows a tax loss while cash-flowing — sheltering income. Rental losses are passive: they offset passive income freely, and up to $25,000/yr can offset ordinary (W-2) income if you actively participate and your MAGI is under $100k (phasing out to $0 by $150k); unused losses carry forward. On sale, claimed depreciation is recaptured at up to 25%, and gains may owe capital-gains tax (a 1031 exchange can defer both). Figures are a year-1 estimate at your 24.0% rate — not tax advice; consult a CPA.
Schools (NCES district)
- District
- Fort Bend ISD
- NCES district ID
- 4819650
- Math proficiency
- 44% ▼ -15.00%
- Reading proficiency
- 53% ▼ -4.00%
- Median HH income
- $82,360
- Composite
- 44.61/100
- National rank
- #2779
- State rank
- #140 of 826 in TX
Livability — Houston
- Score
- 74/100
- State rank
- #184
- US rank
- #4771
Category grades
Schools grade is shown separately in the Schools card above.
Census & demographics
- Census place
- Houston, TX
- County
- Fort Bend County · 836,777 people
- City population
- 3,226,434
- Metro
- Houston-The Woodlands-Sugar Land, TX
- Population (ZIP)
- 39,292
- Household income
- $74,689
- Rent vs Own
- Severe rent burden
- 1121.0
Population outlook (Fort Bend County) Hauer SSP2
- Today (2025)
- 1,004,526 people
- By 2030
- 1,153,104 · +14.8%
- By 2040
- 1,453,718 · +44.7%
- By 2050
- 1,753,781 · +74.6%
- By 2075
- 2,455,772 · +144.5%
- By 2100
- 2,930,528 · +191.7%
Race, ethnicity, and origin ACS 2023
- Neighborhood character
- Majority Black (60%)
- Race & ethnicity
- Black 60% Hispanic / Latino 29% Two or more races 13% White 4% Asian 3%
- Hispanic origin (detail)
- Mexican 17%
- Foreign-born
- 16% · Canada, Vietnam
- Languages at home
- 73% English-only · Spanish 22% Vietnamese 1% Other Asian/Pacific 1%
Political lean MEDSL · Fort Bend
- 2024 margin
- Toss-up / Even · D 49.5% · R 47.9% · Other 2.6%
- 2008→2024 swing
- +4.0pp toward D · 2008: -2.4pp · 2024: 1.6pp
- All cycles
- 2024: D+1.6 2020: D+10.6 2016: D+6.6 2012: R+6.8 2008: R+2.4
Not yet ingested
- Civics
- —
Market trends
- HPI YoY
- ▼ -0.55%
- Current HPI
- 288.1306
- Rent YoY
- ▲ 0.34%
- Metro
- Houston-The Woodlands-Sugar Land, TX
- State GDP YoY
- ▲ 3.95%
- F500 in state
- 110
Industry mix (Fortune 500 HQ in TX)
| Industry | F500 HQs | Revenue |
|---|---|---|
| Energy | 16 | $1,198B |
|
||
| Technology | 5 | $198B |
|
||
| Engineering / Construction | 4 | $72B |
|
||
| Energy Services | 3 | $60B |
|
||
| Utilities | 3 | $41B |
|
||
| Healthcare | 2 | $330B |
|
||
Price history
+95.2% since first listed6 events — show timeline
- 2026-05-06 Price Changed $195,000 HARMLS
- 2026-04-06 Listed $208,000 HARMLS
- 2004-05-24 Sold (Public Records) — Public Records
- 2003-10-31 Listing Removed — HARMLS
- 2003-08-31 Listed $99,900 HARMLS
- 1995-10-04 Sold (Public Records) — Public Records
Property tax history
+3.5%/yrLatest (2025): $4,206 · -7.5% YoY. Source: county tax records.
Cash-flow waterfall
monthlySold comps — $/sqft
last 12 mo · ≤1 miLoading sold comps…