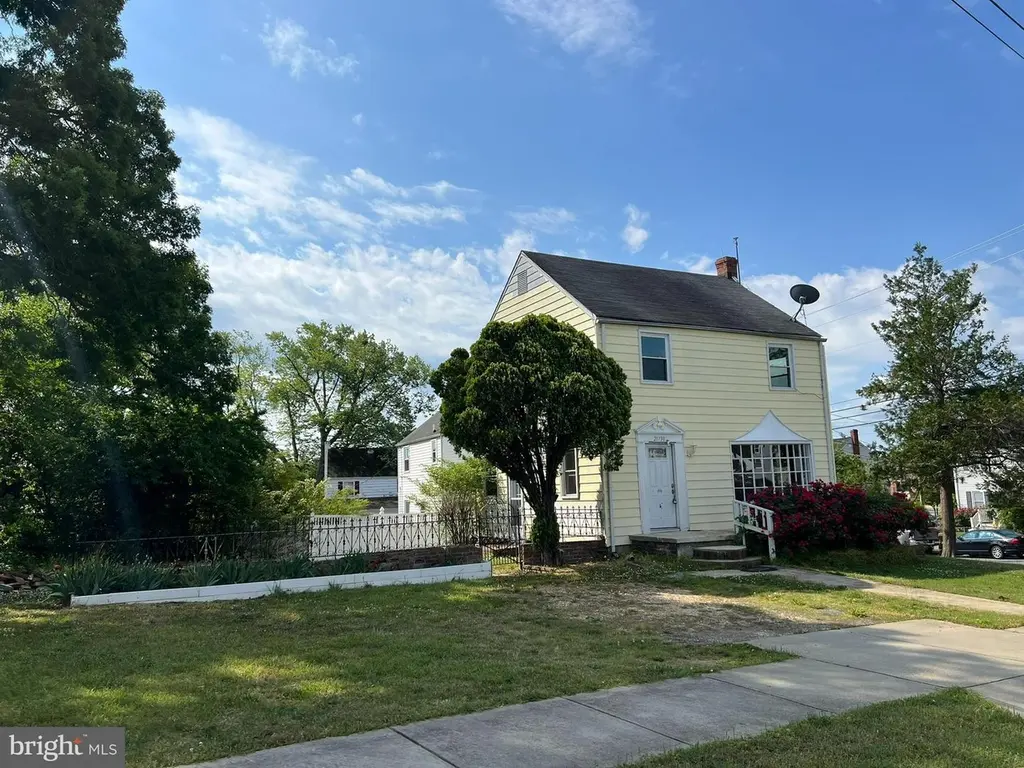
21730 Gambier Pl · Lexington Park, MD
Flood risk 1/10 · Minimal
- FEMA flood zone
- X (unshaded)
- Chance of flooding over 30 yrs
- 0.0%
- Est. flood insurance / yr
- $473 – $860
Fire risk 4/10 · Minor
- Est. fire insurance / yr
- $755 – $1,403
Heat risk 9/10 · Severe
- Hot days now (above 100°F)
- 7 days/yr
- Hot days in 30 yrs
- 17 days/yr
Wind risk 6/10 · Moderate
- Chance of severe wind over 30 yrs
- 67.0%
Air-quality risk 2/10 · Minimal
- Unhealthy air days now
- 1 days/yr
- Unhealthy air days in 30 yrs
- 2 days/yr
Risk factors via First Street. Map © Google.
Why this score? — see what drove the D grade
The composite is a weighted blend of 9 inputs, each scored 0–100. Each bar is that input's sub-score; the figure is the points it added to the 100-point composite (weight × sub-score).
- Cash flow +17.2/30.0
- DSCR +5.3/10.0
- 1% rule +3.7/10.0
- Appreciation +3.2/10.0
- Livability +3.1/5.0
- Schools +3.0/10.0
- Rent growth +2.6/5.0
- Condition / age +2.5/5.0
- ARV discount +1.2/15.0
$244,900
🖨 Deal sheet (PDF) 📄 Offer letter ✓ Due diligence
Key facts
- 6,370 sq ft lot
- Built 1945
- Listed 37 days
Property features AI
Finance
- Other: Fee simple ownership; Not in a federal flood zone; Ground rent paid annually
Exterior
- Parking: Driveway; On-street parking
- Utilities: Public water; Public sewer; Electric hot water
- Home design: Detached property; Bay/Bow windows
- Construction: Cement siding; Concrete perimeter foundation; Shingle roof; Built (year per assessor)
- Exterior features: Sidewalks; Decorative fencing; Corner lot
Interior
- Kitchen: Refrigerator; Gas oven/range
- Bedrooms: 3 bedrooms on the upper level
- Flooring: Hardwood floors
- Bathrooms: 1 full bathroom; 1 half bathroom
- Heating & cooling: Forced air heating (oil); Central air conditioning
- Interior features: Tub shower; Ceiling fans; Dining area; Wood floors
- Laundry & utility: Washer in unit (basement); Dryer in unit (basement)
Neighborhood map
What this means for you Summary
Snapshot
- This is a 3-bed/1.0-bath single-family listed at $245k.
Deal economics
- At list price, monthly cash flow is $173 ($2k/yr) — positive.
- The deal already cash-flows at list — no discount required.
- To meet the 1% rule (rent ≥ 1% of price), the offer needs to be $213k (13.1% below list).
- Recommended offer: $213k (13.1% below list) — sets the bar for 1% rule.
- Cap rate 7.1% vs local median 4.0% in Lexington Park — top-decile yield for the area; either an underpriced asset or a hidden risk that comps aren't pricing in. Stress-test before assuming the spread holds.
Location & tenants
- Location reads 61/100 on livability (#331 in MD) — a middle-class / working-renter tenant base. Strengths: employment A+, housing A; Watch: crime F, amenities F, commute F.
- St. Mary'S County Public Schools (rural): math 23% / reading 38% proficiency, ranked #8 of 24 in MD (top 33%) — families likely to look elsewhere, expect single-tenant / working-renter base with shorter leases.
- Zoned schools: Lexington Park Elementary (math 30% / reading 29%, grade F, #201 of 860 statewide, top 25%, 398 students, 83% FRL); Spring Ridge Middle (math 15% / reading 39%, grade F, #81 of 225 statewide, top 38%, 987 students, 60% FRL); Great Mills High (math 42% / reading 55%, grade D, #111 of 222 statewide, top 50%, 1,779 students, 55% FRL) — zoned schools average 66% FRL vs 28% district-wide (38 pts higher); higher-poverty schools than district average — tighter screening recommended.
- Market conditions: Rents flat; 94 active listings in the ZIP; solid renter incomes; 265 units permitted in St. Mary's County in 2024 (0 in 5+ unit buildings).
Forward outlook
- Local home prices are declining (-3.0%/yr); year-one equity from $2k of loan paydown is wiped out by about $7k of value loss. Plan a longer hold.
- St. Mary's County population projected at +16% by 2050 — long-run rental-demand tailwind backs the buy-and-hold thesis.
Negotiation context
- It's been on market 38 days — a 3% lower offer ($238k) is reasonable based on typical stale-listing flexibility.
- 2 sale attempts since 3y ago; this cycle's ask has dropped $14k (5%) from the opening price — seller is motivated, your offer sets the floor, not the list.
Risks & watch-outs
- Watch-outs: built in 1945 — expect roof / HVAC / electrical / plumbing capex.
- Climate carrying-cost: major wind risk, 67% chance of damaging wind over 30y; extreme-heat days projected 7→17/yr by 2055 (HVAC capex compounding) — expect insurance premiums to compound above CPI over the hold.
Questions for the listing agent
- It's been on market 38 days. Have you received any prior offers? Is the seller open to a 13% concession, seller financing, or rate buy-down credit?
- Built in 1945 — when were the roof, HVAC, electrical panel, plumbing, and water heater last replaced?
- Is there a deadline driving the sale (1031 exchange, divorce, estate, relocation)? That informs how much negotiation room exists.
- Schools are D-rated, which usually means shorter tenancies and higher turnover. Who's the typical renter profile here, and what's been the actual vacancy rate?
- Crime grade is F in this area — have there been break-ins, vandalism, or insurance claims at this property in the last 3 years? What carrier currently insures it and at what premium?
- The area grade is low — what's the realistic commute time and amenity access for the typical tenant pool here? Any planned neighborhood developments (good or bad) we should know about?
- What's the average days-on-market for RENTAL listings here right now (not sales)? A rising rental-DOM trend means longer vacancies and softer asking-rent achievability than the comps imply.
- What's the recent tenant-quality profile in this submarket — average credit score on applications, eviction rate, late-payment / NSF rate, and stable-employment percentage? A property-management company in the area should have these aggregated.
- How much new for-sale + rental construction is in the pipeline within 1–3 miles? Heavy new supply typically softens prices + rents 12–24 months out; constrained supply supports both.
Investment metrics
- 1% rule
- 0.87% ✗
- Cap rate
- 7.14%
- Cash-on-cash
- 3.02%
- DSCR
- 1.13
- GRM
- 9.6
CMA / ARV
- ARV (median comp)
- $215,030
- List price
- $244,900
- Delta
- 13.89%
- Verdict
- OVERPRICED
- Comps
- 20 within 1.0 mi
Show comp detail 8 sales within ~0.75 mi
| Address | Dist | Beds/Ba | Sqft | Sold | Price | $/sf | Match |
|---|---|---|---|---|---|---|---|
| 21684 Saratoga Dr | 0.31mi | 3/1.0 | 1,100 (0%) | 12mo | $190,000 | $173 | 75 |
| 21676 N Essex Dr | 0.23mi | 3/1.0 | 1,100 (0%) | 17mo | $190,000 | $173 | 75 |
| 21722 Cabot Pl | 0.22mi | 3/2.0 | 1,100 (0%) | 14mo | $275,000 | $250 | 74 |
| 46446 Midway Dr | 0.52mi | 3/2.0 | 1,100 (0%) | 10mo | $235,500 | $214 | 64 |
| 46468 Midway Dr | 0.49mi | 3/1.0 | 1,100 (0%) | 24mo | $182,000 | $165 | 58 |
| 46436 Franklin Rd | 0.54mi | 3/2.0 | 1,080 (-2%) | 23mo | $235,000 | $218 | 48 |
| 22024 Fox Ridge Rd | 0.65mi | 3/2.0 | 1,176 (+7%) | 8mo | $340,000 | $289 | 47 |
| 46460 Franklin Rd | 0.50mi | 3/2.0 | 1,170 (+6%) | 23mo | $215,000 | $184 | 43 |
Match score weights: distance 35% · size 25% · config 20% · recency 20%. Top-matched comps best support the ARV.
Projected returns pro-forma
-3.0% appreciation · 0.49% rent growth · sell at horizon
- IRR
- -14.1%
- Equity multiple
- 0.50×
- Total profit
- $-34,003
- Equity at exit
- $36,515
- IRR
- -9.6%
- Equity multiple
- 0.47×
- Total profit
- $-36,229
- Equity at exit
- $21,174
Cash invested: $68,572 (down + closing). Projections, not guarantees.
Landlord ↔ Tenant lean methodology
- Overall (STATE)
- 27 Tenant-Leaning
- State Maryland
- 27 Tenant-Leaning · D+14
- County
- — inherits STATE
- City
- — inherits STATE
ZIP-level market 20653
- Home prices YoY
- -1.4%
- Rents YoY
- 0.5%
- Active inventory
- 94
- Price-to-rent
- 9.6×
Monthly cashflow live
- Estimated rent
- $2,129 medium interval (Pro) →
- Mortgage (P&I)
- −$1,284
- Tax from tax record
- −$122 /mo · $1,470/yr
- Insurance
- −$102
- HOA
- −$0
- Vacancy / Maint / Mgmt
- −$447
- Net cashflow
- $173
Break-even live
Sensitivity live
| Price | -10% $311 | -5% $242 | +0% $173 | +5% $103 | +10% $34 |
|---|---|---|---|---|---|
| Rent | -10% $5 | -5% $89 | +0% $173 | +5% $257 | +10% $341 |
| Rate | -1.0pp $296 | -0.5pp $235 | base $173 | +0.5pp $109 | +1.0pp $45 |
UW: 25.0% down · 7.5% · 30yr · 1.5% tax · 5.0% vac · 8.0% maint · 8.0% mgmt
Financing live
Cash to close
- Down payment
- $61,225
- Closing costs
- $7,347
- Reserves months
- —
- Total cash needed
- —
Loan-product check · same deal, 3 products live
Conventional
25% down · 7.5% · 30yr
- Down + closing
- —
- Monthly P&I
- —
- Monthly cashflow
- —
- DSCR
- —
- Eligible?
- —
Personal DTI + credit; lowest rate.
DSCR
20% down · 8.5% · 30yr
- Down + closing
- —
- Monthly P&I
- —
- Monthly cashflow
- —
- DSCR
- —
- Eligible?
- —
No personal income docs; deal must DSCR.
Hard money
10% down · 12.0% · 12mo
- Down + closing
- —
- Monthly P&I
- —
- Monthly cashflow
- —
- DSCR
- —
- Eligible?
- —
Short-term bridge; refi at stabilization.
Listing history 20 events
-
2026-06-21days on market $244,900 Active 38 DOM
-
2026-06-19days on market $244,900 Active 36 DOM
-
2026-06-18days on market $244,900 Active 35 DOM
-
2026-06-17days on market $244,900 Active 34 DOM
-
2026-06-16days on market $244,900 Active 33 DOM
-
2026-06-15days on market $244,900 Active 32 DOM
-
2026-06-14days on market $244,900 Active 30 DOM
-
2026-06-12days on market $244,900 Active 29 DOM
-
2026-06-09days on market $244,900 Active 26 DOM
-
2026-06-08days on market $244,900 Active 25 DOM
-
2026-06-07days on market $244,900 Active 24 DOM
-
2026-06-05pricedays on market $244,900 Active 21 DOM
-
2026-06-02days on market $259,000 Active 19 DOM
-
2026-06-01days on market $259,000 Active 18 DOM
-
2026-05-31days on market $259,000 Active 17 DOM
-
2026-05-30days on market $259,000 Active 16 DOM
-
2026-05-14$259,000 Active
-
2023-07-11historical
-
2023-06-09$160,000 Active
-
2023-05-19historical
ⓘ Source: listings_history table (triggers on properties + properties_extension) + one-shot
backfill from property_details.listing_events for pre-trigger history.
Tax reassessment forecast MD · Partial reset (capped growth)
- Current annual tax
- $1,470 · $122/mo
- Projected year-2 tax
- $2,069 · $172/mo
- Expected delta
- +$600/yr (+$50/mo · 40.8%)
ⓘ Screening estimate from a state-policy table — verify with the county assessor before closing.
Climate risk First Street
- Flood 1/10 Low FEMA zone X (unshaded) · 0% chance over 30 yrs
- Wildfire 4/10 Moderate
- Heat 9/10 Extreme 7 d/yr ≥100°F today · 17 d/yr by 30 yrs out
- Wind 6/10 Major 67% chance of damaging wind over 30 yrs
- Air quality 2/10 Low 1 unhealthy d/yr today · 2 by 30 yrs out
Nearby sold comps map
Loading sold comps map…
Walkable amenities ~0.75 mi
Loading nearby amenities…
Taxation est. · year 1
- Rental income
- $25,543
- − Mortgage interest
- −$13,718
- − Property taxes
- −$1,470
- − Insurance
- −$1,224
- − Repairs & maintenance
- −$2,043
- − Management
- −$2,043
- − Depreciation
- −$7,124
- Taxable loss
- −$2,080
- Est. tax savings @ 24.0%
- +$499
- After-tax cash flow
- $2,573/yr
For passive investors: Depreciation is non-cash, so a rental often shows a tax loss while cash-flowing — sheltering income. Rental losses are passive: they offset passive income freely, and up to $25,000/yr can offset ordinary (W-2) income if you actively participate and your MAGI is under $100k (phasing out to $0 by $150k); unused losses carry forward. On sale, claimed depreciation is recaptured at up to 25%, and gains may owe capital-gains tax (a 1031 exchange can defer both). Figures are a year-1 estimate at your 24.0% rate — not tax advice; consult a CPA.
Schools (NCES district)
- District
- St. Mary'S County Public Schools
- NCES district ID
- 2400600
- Math proficiency
- 23% ▼ -23.00%
- Reading proficiency
- 38% ▼ -12.00%
- Median HH income
- $83,240
- Composite
- 29.74/100
- National rank
- #6444
- State rank
- #8 of 24 in MD
Livability — Lexington Park
- Score
- 61/100
- State rank
- #331
- US rank
- #17418
Category grades
Schools grade is shown separately in the Schools card above.
Census & demographics
- Census place
- Lexington Park, MD
- County
- Saint Marys County · 48,152 people
- City population
- 26,852
- Metro
- California-Lexington Park, MD
- Population (ZIP)
- 26,852
- Household income
- $103,048
- Rent vs Own
- Severe rent burden
- 1571.0
Population outlook (St. Mary's County) Hauer SSP2
- Today (2025)
- 123,125 people
- By 2030
- 128,374 · +4.3%
- By 2040
- 137,305 · +11.5%
- By 2050
- 143,065 · +16.2%
- By 2075
- 153,408 · +24.6%
- By 2100
- 151,790 · +23.3%
Race, ethnicity, and origin ACS 2023
- Neighborhood character
- Diverse neighborhood (Simpson 0.63)
- Race & ethnicity
- White 54% Black 28% Two or more races 11% Hispanic / Latino 6% Asian 4%
- Hispanic origin (detail)
- Mexican 3% Puerto Rican 1%
- Common ancestry
- Romanian 2% Slovak 2% Italian 1%
- Foreign-born
- 6% · Canada, Jamaica
- Languages at home
- 92% English-only · Spanish 3% Tagalog/Filipino 3% Other Asian/Pacific 1%
Political lean MEDSL · St. Mary's
- 2024 margin
- R (+17.2) · D 40.2% · R 57.4% · Other 2.4%
- 2008→2024 swing
- -4.4pp toward R · 2008: -12.8pp · 2024: -17.2pp
- All cycles
- 2024: R+17.2 2020: R+13.8 2016: R+24.6 2012: R+16.1 2008: R+12.8
Not yet ingested
- Civics
- —
Market trends
- HPI YoY
- ▼ -3.67%
- Current HPI
- 256.5435
- Rent YoY
- ▲ 0.49%
- Metro
- California-Lexington Park, MD
- State GDP YoY
- ▲ 2.97%
- F500 in state
- 12
Industry mix (Fortune 500 HQ in MD)
| Industry | F500 HQs | Revenue |
|---|---|---|
| Aerospace / Defense | 1 | $71B |
|
||
| Utilities | 1 | $25B |
|
||
| Hotels | 1 | $24B |
|
||
| Consumer Goods | 1 | $7B |
|
||
| Real Estate | 1 | $6B |
|
||
| Chemicals | 1 | $2B |
|
||
Price history
+53.1% since first listed5 events — show timeline
- 2026-06-04 Price Changed $244,900 BRIGHT MLS
- 2026-05-14 Listed $259,000 BRIGHT MLS
- 2023-07-11 Listing Removed — BRIGHT MLS
- 2023-06-09 Listed $160,000 BRIGHT MLS
- 2023-05-19 Coming Soon — BRIGHT MLS
Property tax history
+4.1%/yrLatest (2025): $1,470 · +13.6% YoY. Source: county tax records.
Cash-flow waterfall
monthlySold comps — $/sqft
last 12 mo · ≤1 miLoading sold comps…