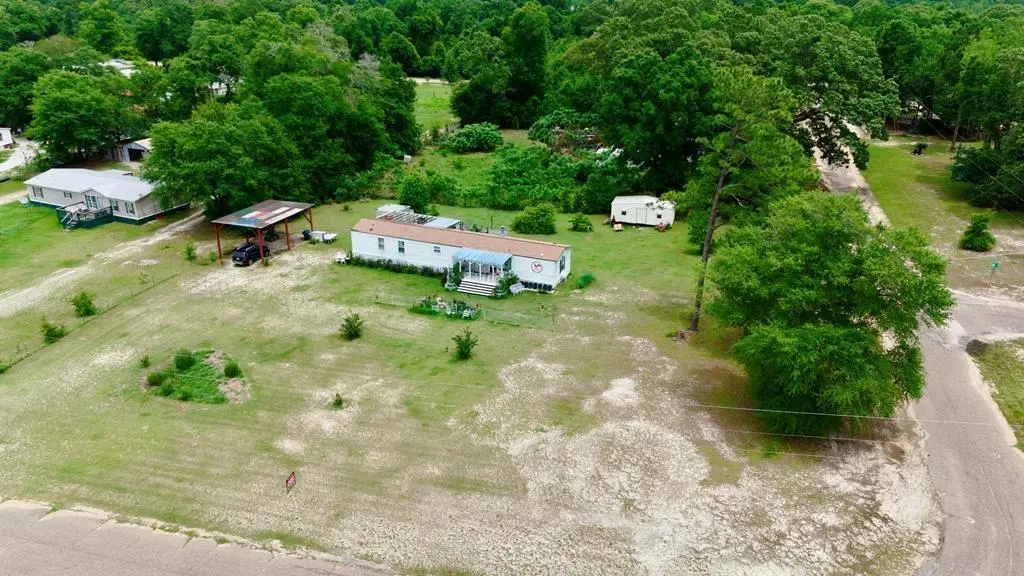
151 Clover St · Malone, FL
Flood risk 1/10 · Minimal
- FEMA flood zone
- X (unshaded)
- Chance of flooding over 30 yrs
- 0.0%
- Est. flood insurance / yr
- $507 – $1,088
Fire risk 3/10 · Minor
- Est. fire insurance / yr
- $916 – $1,700
Heat risk 8/10 · Major
- Hot days now (above 108°F)
- 7 days/yr
- Hot days in 30 yrs
- 19 days/yr
Wind risk 8/10 · Major
- Chance of severe wind over 30 yrs
- 99.0%
Air-quality risk 3/10 · Minor
- Unhealthy air days now
- 2 days/yr
- Unhealthy air days in 30 yrs
- 4 days/yr
Risk factors via First Street. Map © Google.
Why this score? — see what drove the B grade
The composite is a weighted blend of 9 inputs, each scored 0–100. Each bar is that input's sub-score; the figure is the points it added to the 100-point composite (weight × sub-score).
- Cash flow +30.0/30.0
- DSCR +10.0/10.0
- 1% rule +7.7/10.0
- ARV discount +7.5/15.0
- Appreciation +7.1/10.0
- Livability +3.3/5.0
- Schools +3.1/10.0
- Rent growth +2.5/5.0
- Condition / age +2.5/5.0
$89,900
🖨 Deal sheet 📄 Offer letter ✓ Due diligence
Listing remarks
Welcome to country living at its finest! Located at 151 Clover Street in Gordon, this charming 1999 Fleetwood Westfield 16x76 mobile home is full of farmhouse character and priced under $90K! Sitting on a spacious corner lot with approximately 0.92 acres, this 3 bedroom, 2 bathroom home offers the perfect blend of comfort, charm, and peaceful country living. From the moment you arrive, you'll fall in love with the adorable front porch — the perfect place to sit and enjoy beautiful Alabama sunsets. The property also features a spacious backyard, covered carport, detached RV carport, and an RV hookup already in place, making it ideal for guests, travelers, or extra storage. Inside, the
Key facts
- Adorable front porch
- Spacious backyard
- Covered carport
Tags
Property features AI
Exterior
- Parking: Attached carport; Detached carport; RV access/parking; Has attached garage
- Utilities: Well (see remarks); Septic tank
- Home design: Residential manufactured/modular home
- Construction: Metal siding
- Exterior features: Deck; Porch; On waterfront
Interior
- Kitchen: Refrigerator
- Flooring: Other
- Bathrooms: 2 full bathrooms
- Interior features: Wood-burning fireplace (1); Electric water heater; Refrigerator
- Laundry & utility: Electric water heater
Neighborhood map
What this means for you Summary
Snapshot
- This is a 3-bed/2.0-bath manufactured listed at $90k.
Deal economics
- At list price, monthly cash flow is $365 ($4k/yr) — positive.
- The deal already cash-flows at list — no discount required.
- Meets the 1% rule at list price ($1k rent vs $90k).
- Recommended offer: $89k (1.5% below list) — sets the bar for market timing.
Location & tenants
- Location reads 66/100 on livability (#628 in FL) — a middle-class / working-renter tenant base. Strengths: cost of living A+, housing A+, crime A; Watch: employment D+, health & safety D, amenities F.
- Houston County (rural): math 25% / reading 49% proficiency, ranked #38 of 129 in AL (top 30%) — families likely to look elsewhere, expect single-tenant / working-renter base with shorter leases.
- Zoned schools: Ashford Elementary School (math 21% / reading 51%, grade F, #286 of 627 statewide, top 46%, 625 students, 68% FRL); Ashford Middle School (293 students, 67% FRL); Ashford High School (math 9% / reading 32%, grade F, #159 of 305 statewide, top 53%, 399 students, 62% FRL).
- Market conditions: 463 units permitted in Houston County in 2024 (96 in 5+ unit buildings).
Forward outlook
- In year one you build about $4k of equity ($622 loan paydown + $4k appreciation (4.3% local appreciation)).
- Houston County population projected at +7% by 2050 — modest demand growth; plan on rents tracking national, not racing it.
- At projected returns (4.3% appreciation + 3.0% rent growth), your $25k cash investment doubles in ~3 years — after that, you're playing with house money.
- By year 8, paydown + projected appreciation supports a ~$33k cash-out refi (75% LTV) — recoverable capital for the next deal without selling this one.
Negotiation context
- It's been on market 21 days — a 2% lower offer ($89k) is reasonable based on typical stale-listing flexibility.
- 5 sale attempts since 14y ago with the ask held roughly flat each time — persistent listings suggest the price (not the market) is what's stuck; bring a comps-based counter.
- Current owner paid $53k; list at $90k implies a 70% gain — meaningful room to come down on a strong offer.
Risks & watch-outs
- Climate carrying-cost: severe wind risk, 99% chance of damaging wind over 30y; extreme-heat days projected 7→19/yr by 2055 (HVAC capex compounding) — expect insurance premiums to compound above CPI over the hold.
Questions for the listing agent
- Is there a deadline driving the sale (1031 exchange, divorce, estate, relocation)? That informs how much negotiation room exists.
- Schools are D-rated, which usually means shorter tenancies and higher turnover. Who's the typical renter profile here, and what's been the actual vacancy rate?
- What's the average days-on-market for RENTAL listings here right now (not sales)? A rising rental-DOM trend means longer vacancies and softer asking-rent achievability than the comps imply.
- What's the recent tenant-quality profile in this submarket — average credit score on applications, eviction rate, late-payment / NSF rate, and stable-employment percentage? A property-management company in the area should have these aggregated.
- How much new for-sale + rental construction is in the pipeline within 1–3 miles? Heavy new supply typically softens prices + rents 12–24 months out; constrained supply supports both.
Investment metrics
- 1% rule
- 1.27% ✓
- Cap rate
- 11.17%
- Cash-on-cash
- 17.42%
- DSCR
- 1.78
- GRM
- 6.6
CMA / ARV
No comps found within radius.
Projected returns pro-forma
4.28% appreciation · 3.0% rent growth · sell at horizon
- IRR
- 26.5%
- Equity multiple
- 2.60×
- Total profit
- $40,323
- Equity at exit
- $47,082
- IRR
- 26.0%
- Equity multiple
- 5.12×
- Total profit
- $103,591
- Equity at exit
- $78,229
Cash invested: $25,172 (down + closing). Projections, not guarantees.
Landlord ↔ Tenant lean methodology
- Overall (STATE)
- 87 Strongly Landlord-Friendly
- State Florida
- 87 Strongly Landlord-Friendly · R+3
- County
- — inherits STATE
- City
- — inherits STATE
ZIP-level market 36343
- Home prices YoY
- 3.5%
- Price-to-rent
- 6.6×
Monthly cashflow live
- Estimated rent
- $1,138 medium interval (Pro) →
- Mortgage (P&I)
- −$471
- Tax from tax record
- −$25 /mo · $295/yr
- Insurance
- −$37
- HOA
- −$0
- Vacancy / Maint / Mgmt
- −$239
- Net cashflow
- $365
Break-even live
UW: 25.0% down · 7.5% · 30yr · 1.5% tax · 5.0% vac · 8.0% maint · 8.0% mgmt
Financing live
Cash to close
- Down payment
- $22,475
- Closing costs
- $2,697
- Reserves months
- —
- Total cash needed
- —
Loan-product check · same deal, 3 products live
Conventional
25% down · 7.5% · 30yr
- Down + closing
- —
- Monthly P&I
- —
- Monthly cashflow
- —
- DSCR
- —
- Eligible?
- —
Personal DTI + credit; lowest rate.
DSCR
20% down · 8.5% · 30yr
- Down + closing
- —
- Monthly P&I
- —
- Monthly cashflow
- —
- DSCR
- —
- Eligible?
- —
No personal income docs; deal must DSCR.
Hard money
10% down · 12.0% · 12mo
- Down + closing
- —
- Monthly P&I
- —
- Monthly cashflow
- —
- DSCR
- —
- Eligible?
- —
Short-term bridge; refi at stabilization.
Listing history 21 events
-
2026-06-19days on market $89,900 Active 21 DOM
-
2026-06-18days on market $89,900 Active 20 DOM
-
2026-06-17days on market $89,900 Active 19 DOM
-
2026-06-16days on market $89,900 Active 18 DOM
-
2026-06-15days on market $89,900 Active 17 DOM
-
2026-06-14days on market $89,900 Active 15 DOM
-
2026-06-12days on market $89,900 Active 14 DOM
-
2026-06-09days on market $89,900 Active 11 DOM
-
2026-06-08days on market $89,900 Active 10 DOM
-
2026-06-07days on market $89,900 Active 9 DOM
-
2026-06-05days on market $89,900 Active 6 DOM
-
2026-06-03days on market $89,900 Active 5 DOM
-
2026-06-02days on market $89,900 Active 4 DOM
-
2026-06-01days on market $89,900 Active 3 DOM
-
2026-05-31days on market $89,900 Active 2 DOM
-
2026-05-29$89,900 Active
-
2024-02-27$105,000 Active
-
2023-07-31$105,000 Active
-
2023-05-25soldstatus $53,000
-
2012-08-29$48,000
-
2012-08-29$48,000
ⓘ Source: listings_history table (triggers on properties + properties_extension) + one-shot
backfill from property_details.listing_events for pre-trigger history.
Tax reassessment forecast FL · Resets to sale price
- Current annual tax
- $295 · $25/mo
- Projected year-2 tax
- $746 · $62/mo
- Expected delta
- +$451/yr (+$38/mo · 152.6%)
ⓘ Screening estimate from a state-policy table — verify with the county assessor before closing.
Climate risk First Street
- Flood 1/10 Low FEMA zone X (unshaded) · 0% chance over 30 yrs
- Wildfire 3/10 Moderate
- Heat 8/10 Severe 7 d/yr ≥108°F today · 19 d/yr by 30 yrs out
- Wind 8/10 Severe 99% chance of damaging wind over 30 yrs
- Air quality 3/10 Moderate 2 unhealthy d/yr today · 4 by 30 yrs out
Nearby sold comps map
Loading sold comps map…
Walkable amenities ~0.75 mi
Loading nearby amenities…
Taxation est. · year 1
- Rental income
- $13,654
- − Mortgage interest
- −$5,036
- − Property taxes
- −$295
- − Insurance
- −$450
- − Repairs & maintenance
- −$1,092
- − Management
- −$1,092
- − Depreciation
- −$2,615
- Taxable income
- $3,073
- Est. tax owed @ 24.0%
- −$738
- After-tax cash flow
- $3,647/yr
For passive investors: Depreciation is non-cash, so a rental often shows a tax loss while cash-flowing — sheltering income. Rental losses are passive: they offset passive income freely, and up to $25,000/yr can offset ordinary (W-2) income if you actively participate and your MAGI is under $100k (phasing out to $0 by $150k); unused losses carry forward. On sale, claimed depreciation is recaptured at up to 25%, and gains may owe capital-gains tax (a 1031 exchange can defer both). Figures are a year-1 estimate at your 24.0% rate — not tax advice; consult a CPA.
Schools (NCES district)
- District
- Houston County
- NCES district ID
- 0101770
- Math proficiency
- 25% ▼ -33.00%
- Reading proficiency
- 49% ▼ -1.00%
- Median HH income
- $40,530
- Composite
- 31.01/100
- National rank
- #6092
- State rank
- #38 of 129 in AL
Livability — Malone
- Score
- 66/100
- State rank
- #628
- US rank
- #12226
Category grades
Schools grade is shown separately in the Schools card above.
Census & demographics
- Population (ZIP)
- 1,469
Population outlook (Houston County) Hauer SSP2
- Today (2025)
- 110,280 people
- By 2030
- 112,668 · +2.2%
- By 2040
- 116,149 · +5.3%
- By 2050
- 117,805 · +6.8%
- By 2075
- 118,577 · +7.5%
- By 2100
- 110,940 · +0.6%
Race, ethnicity, and origin ACS 2023
- Neighborhood character
- Predominantly White (65%)
- Race & ethnicity
- White 65% Black 30% Two or more races 3%
- Common ancestry
- Slovak 1% Romanian 1%
- Foreign-born
- 0%
- Languages at home
- 99% English-only · Spanish 1%
Political lean MEDSL · Houston
- 2024 margin
- Solid R (+47.8) · D 25.7% · R 73.5%
- 2008→2024 swing
- -7.0pp toward R · 2008: -40.8pp · 2024: -47.8pp
- All cycles
- 2024: R+47.8 2020: R+42.7 2016: R+47.6 2012: R+40.3 2008: R+40.8
Not yet ingested
- Civics
- —
Market trends
- HPI YoY
- ▲ 4.28%
- Current HPI
- 128.417
- Rent YoY
- —
- Metro
- —
- State GDP YoY
- ▲ 3.28%
- F500 in state
- 36
Industry mix (Fortune 500 HQ in FL)
| Industry | F500 HQs | Revenue |
|---|---|---|
| Industrial Technology | 2 | $29B |
|
||
| Insurance | 2 | $17B |
|
||
| Retail | 1 | $60B |
|
||
| Technology Distribution | 1 | $58B |
|
||
| Homebuilding | 1 | $35B |
|
||
| Technology Manufacturing | 1 | $35B |
|
||
Price history
+87.3% since first listed6 events — show timeline
- 2026-05-29 Listed $89,900 SAMLS
- 2024-02-27 Listed $105,000 SAMLS
- 2023-07-31 Listed $105,000 SAMLS
- 2023-05-25 Sold (Public Records) $53,000 Public Records
- 2012-08-29 Listed $48,000 MAAR
- 2012-08-29 Listed $48,000 WBR
Property tax history
+11.5%/yrLatest (2025): $295 · -8.6% YoY. Source: county tax records.
Cash-flow waterfall
monthlySold comps — $/sqft
last 12 mo · ≤1 miLoading sold comps…