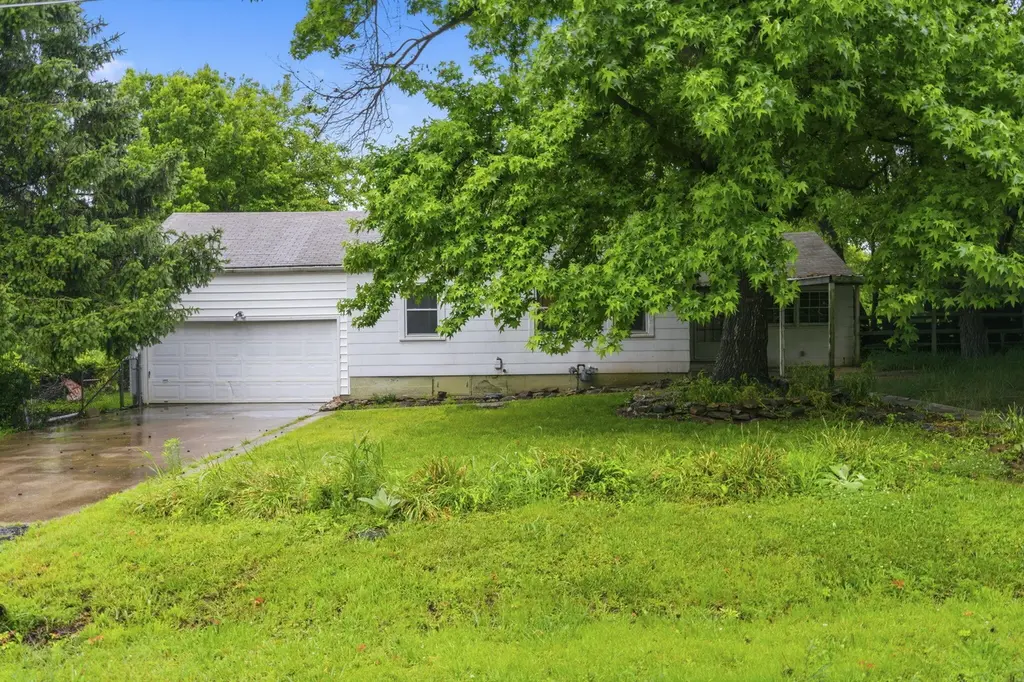
731 S Old Orchard Ave · Springfield, MO
Flood risk 1/10 · Minimal
- FEMA flood zone
- X (unshaded)
- Chance of flooding over 30 yrs
- 0.0%
- Est. flood insurance / yr
- $507 – $1,088
Fire risk 1/10 · Minimal
- Est. fire insurance / yr
- $1,054 – $1,958
Heat risk 5/10 · Moderate
- Hot days now (above 104°F)
- 7 days/yr
- Hot days in 30 yrs
- 18 days/yr
Wind risk 2/10 · Minimal
- Chance of severe wind over 30 yrs
- 0.0%
Air-quality risk 2/10 · Minimal
- Unhealthy air days now
- 2 days/yr
- Unhealthy air days in 30 yrs
- 2 days/yr
Risk factors via First Street. Map © Google.
Why this score? — see what drove the C+ grade
The composite is a weighted blend of 9 inputs, each scored 0–100. Each bar is that input's sub-score; the figure is the points it added to the 100-point composite (weight × sub-score).
- Cash flow +20.7/30.0
- ARV discount +15.0/15.0
- DSCR +6.6/10.0
- 1% rule +4.6/10.0
- Livability +3.8/5.0
- Rent growth +3.7/5.0
- Schools +3.2/10.0
- Condition / age +2.5/5.0
- Appreciation +0.0/10.0
$120,000
🖨 Deal sheet 📄 Offer letter ✓ Due diligence
Listing remarks MLS
Dont miss this cute little home that needs to be brought back to its former glory. This house has 3 bedrooms, an attached 2 car garage, hardwood floors, central heat and air, and is located in a great area. Selling as-is. Call today for your private showing!
Key facts
- Hardwood flooring
- Shed
- Central heat and air
Tags
Property features AI
Exterior
- Parking: Detached or attached garage (2-car); Driveway, paved; garage faces front
- Security: Storm doors
- Utilities: Public water; Public sewer
- Home design: Single-family residence; One story
- Construction: Fiber cement exterior; Asphalt roof
- Exterior features: Enclosed front porch; Storm door(s); Chain link full fencing; Shed(s) on the property; Asphalt road frontage; Corner lot with few trees and generally level terrain
Interior
- Kitchen: Electric oven; Free-standing electric oven
- Bedrooms: One-level bedroom(s)
- Flooring: Carpet; Wood; Laminate
- Bathrooms: 1 full bathroom
- Heating & cooling: Central heating (electric); Central air conditioning
- Interior features: High-speed internet available; Laminate countertops
- Laundry & utility: Washer and dryer located on the main level
Neighborhood map
What this means for you Summary
Snapshot
- This is a 2-bed/1.0-bath single-family listed at $120k.
Deal economics
- At list price, monthly cash flow is $162 ($2k/yr) — positive.
- The deal already cash-flows at list — no discount required.
- To meet the 1% rule (rent ≥ 1% of price), the offer needs to be $116k (3.7% below list).
- Recommended offer: $116k (3.7% below list) — sets the bar for 1% rule.
- Cap rate 7.9% vs local median 4.6% in Springfield — top-decile yield for the area; either an underpriced asset or a hidden risk that comps aren't pricing in. Stress-test before assuming the spread holds.
Location & tenants
- Location reads 75/100 on livability (#57 in MO, #4,121 nationally) — a middle-class / working-renter tenant base. Strengths: commute A+, cost of living A+, housing A+; Watch: crime F, employment F.
- Springfield R-XII (urban): math 32% / reading 46% proficiency, ranked #174 of 324 in MO (top 54%) — families likely to look elsewhere, expect single-tenant / working-renter base with shorter leases.
- Zoned schools: Bingham Elem. (math 27% / reading 37%, grade F, #761 of 1,115 statewide, top 72%, 422 students, 78% FRL); Hickory Hills Middle (math 31% / reading 44%, grade F, #215 of 391 statewide, top 56%, 414 students, 46% FRL); Glendale High (math 21% / reading 55%, grade F, #290 of 521 statewide, top 56%, 1,307 students, 33% FRL).
- Market conditions: Rents rising fast (+4.8%/yr); 512 active listings in the ZIP; 27 comparable units currently listed for rent nearby; rentals at typical pace (median 24d on market — plan ~3-4 weeks tenant-placement turnaround); 44% of comp listings sitting > 30 days — soft ceiling on asking rent; 1,302 units permitted in Greene County in 2024 (250 in 5+ unit buildings).
Forward outlook
- Local home prices are declining (-3.0%/yr); year-one equity from $830 of loan paydown is wiped out by about $4k of value loss. Plan a longer hold.
- Greene County population projected at +25% by 2050 — long-run rental-demand tailwind backs the buy-and-hold thesis.
Negotiation context
- It's been on market 16 days — a 2% lower offer ($118k) is reasonable based on typical stale-listing flexibility.
- 4 sale attempts since 18y ago with the ask held roughly flat each time — persistent listings suggest the price (not the market) is what's stuck; bring a comps-based counter.
Risks & watch-outs
- Watch-outs: built in 1937 — expect roof / HVAC / electrical / plumbing capex.
- Climate carrying-cost: extreme-heat days projected 7→18/yr by 2055 (HVAC capex compounding) — expect insurance premiums to compound above CPI over the hold.
Questions for the listing agent
- Built in 1937 — when were the roof, HVAC, electrical panel, plumbing, and water heater last replaced?
- Is there a deadline driving the sale (1031 exchange, divorce, estate, relocation)? That informs how much negotiation room exists.
- Crime grade is F in this area — have there been break-ins, vandalism, or insurance claims at this property in the last 3 years? What carrier currently insures it and at what premium?
- What's the average days-on-market for RENTAL listings here right now (not sales)? A rising rental-DOM trend means longer vacancies and softer asking-rent achievability than the comps imply.
- What's the recent tenant-quality profile in this submarket — average credit score on applications, eviction rate, late-payment / NSF rate, and stable-employment percentage? A property-management company in the area should have these aggregated.
- How much new for-sale + rental construction is in the pipeline within 1–3 miles? Heavy new supply typically softens prices + rents 12–24 months out; constrained supply supports both.
Investment metrics
- 1% rule
- 0.96% ✗
- Cap rate
- 7.91%
- Cash-on-cash
- 5.78%
- DSCR
- 1.26
- GRM
- 8.6
CMA / ARV
- ARV (on-the-fly)
- $163,660
- Comps found
- 12
Show comp detail 12 sales within ~0.75 mi
| Address | Dist | Beds/Ba | Sqft | Sold | Price | $/sf | Match |
|---|---|---|---|---|---|---|---|
| 2829 E Monroe Terrace Ter | 0.12mi | 2/1.0 | 1,001 (+2%) | 6mo | $169,900 | $170 | 85 |
| 2710 E Horning St | 0.30mi | 3/1.0 (+1) | 960 (-2%) | 1mo | $159,900 | $167 | 77 |
| 2822 E Cherry St | 0.21mi | 3/1.0 (+1) | 1,048 (+7%) | 4mo | $140,000 | $134 | 70 |
| 1104 S Bruce Ave | 0.72mi | 2/1.0 | 984 (+0%) | 2mo | $175,000 | $178 | 64 |
| 2431 E Cherry St | 0.43mi | 3/1.0 (+1) | 1,014 (+4%) | 7mo | $154,900 | $153 | 63 |
| 1231 S Lone Pine Ave | 0.71mi | 2/2.0 | 950 (-3%) | 1mo | $189,900 | $200 | 57 |
| 201 S Meadowview Ave | 0.59mi | 3/1.5 (+1) | 1,064 (+9%) | 6mo | $179,900 | $169 | 47 |
| 1111 S Lone Pine Ave | 0.58mi | 3/2.0 (+1) | 1,050 (+7%) | 10mo | $170,000 | $162 | 44 |
| 1304 S Meadowview Ave | 0.72mi | 3/2.0 (+1) | 1,050 (+7%) | 7mo | $210,000 | $200 | 40 |
| 2502 E Cedar Ln | 0.73mi | 2/1.0 | 1,112 (+14%) | 6mo | $165,000 | $148 | 39 |
| 2435 E Catalpa St | 0.65mi | 3/2.0 (+1) | 1,104 (+13%) | 7mo | $165,000 | $149 | 33 |
| 1053 S Bruce Ave | 0.68mi | 3/1.5 (+1) | 1,100 (+12%) | 10mo | $164,900 | $150 | 33 |
Match score weights: distance 35% · size 25% · config 20% · recency 20%. Top-matched comps best support the ARV.
Projected returns pro-forma
-3.0% appreciation · 4.82% rent growth · sell at horizon
- IRR
- -5.5%
- Equity multiple
- 0.79×
- Total profit
- $-7,019
- Equity at exit
- $17,892
- IRR
- 6.0%
- Equity multiple
- 1.48×
- Total profit
- $16,210
- Equity at exit
- $10,375
Cash invested: $33,600 (down + closing). Projections, not guarantees.
Landlord ↔ Tenant lean methodology
- Overall (STATE)
- 81 Strongly Landlord-Friendly
- State Missouri
- 81 Strongly Landlord-Friendly · R+10
- County
- — inherits STATE
- City
- — inherits STATE
ZIP-level market 65802
- Home prices YoY
- -31.9%
- Rents YoY
- 4.8%
- Active inventory
- 512
- Price-to-rent
- 8.6×
Monthly cashflow live
- Estimated rent
- $1,156 high interval (Pro) →
- Mortgage (P&I)
- −$629
- Tax from tax record
- −$72 /mo · $868/yr
- Insurance
- −$50
- HOA
- −$0
- Vacancy / Maint / Mgmt
- −$243
- Net cashflow
- $162
Break-even live
UW: 25.0% down · 7.5% · 30yr · 1.5% tax · 5.0% vac · 8.0% maint · 8.0% mgmt
Financing live
Cash to close
- Down payment
- $30,000
- Closing costs
- $3,600
- Reserves months
- —
- Total cash needed
- —
Loan-product check · same deal, 3 products live
Conventional
25% down · 7.5% · 30yr
- Down + closing
- —
- Monthly P&I
- —
- Monthly cashflow
- —
- DSCR
- —
- Eligible?
- —
Personal DTI + credit; lowest rate.
DSCR
20% down · 8.5% · 30yr
- Down + closing
- —
- Monthly P&I
- —
- Monthly cashflow
- —
- DSCR
- —
- Eligible?
- —
No personal income docs; deal must DSCR.
Hard money
10% down · 12.0% · 12mo
- Down + closing
- —
- Monthly P&I
- —
- Monthly cashflow
- —
- DSCR
- —
- Eligible?
- —
Short-term bridge; refi at stabilization.
Rent comps 27 comps
| Address | Beds | Baths | Sqft | Rent | $/sqft | DOM | Units | Dist |
|---|---|---|---|---|---|---|---|---|
| 3080 E Cherry St Unit H104-ADA Springfield, MO | 3.0 | 2.0 | 1030 | $1,565 | $1.52 | 43d | 1 | 0.41mi |
| 3080 E Cherry St Unit G308 Springfield, MO | 2.0 | 2.0 | 730 | $1,245 | $1.71 | 43d | 1 | 0.41mi |
| 3080 E Cherry St Unit D312 Springfield, MO | 2.0 | 2.0 | 730 | $1,125 | $1.54 | 23d | 1 | 0.41mi |
| 3080 E Cherry St Unit F104-ADA Springfield, MO | 3.0 | 2.0 | 1030 | $1,500 | $1.46 | 23d | 1 | 0.41mi |
| 2323 E Cherry St Springfield, MO | 2.0 | 1.5 | 750 | $1,195 | $1.59 | 13d | 1 | 0.59mi |
| 2323 E Cherry St Springfield, MO | 2.0 | 1.5 | 750 | $1,195 | $1.59 | 23d | 1 | 0.59mi |
| 1302 S Estate Ave Springfield, MO | 2.0 | 1.0 | 768 | $1,100 | $1.43 | 23d | 1 | 0.79mi |
| 2154 E Cairo St Springfield, MO | 3.0 | 2.0 | 1100 | $1,395 | $1.27 | 43d | 1 | 0.86mi |
| 504 N Patterson Ave Apt C Springfield, MO | 2.0 | 1.0 | 760 | $725 | $0.95 | 43d | 1 | 0.89mi |
| 3455 E Lombard St Springfield, MO | 2.0 | 2.0 | 828 | $905 | $1.09 | 43d | 1 | 0.91mi |
| 3501 E Lombard St Springfield, MO | 1.0–3.0 | 1.0–2.0 | 800 | $905 | $1.13 | 43d | 1 | 0.93mi |
| 3440 E Lombard St Unit 110 Springfield, MO | 2.0 | 1.5 | 900 | $875 | $0.97 | 43d | 1 | 0.93mi |
| 3440 E Lombard St Unit 129 Springfield, MO | 2.0 | 1.5 | 900 | $875 | $0.97 | 23d | 1 | 0.93mi |
| 2013 E Cherry St Springfield, MO | 1.0 | 1.0 | 740 | $1,200 | $1.62 | 23d | 1 | 0.97mi |
| 1225 S Ingram Mill Rd Springfield, MO | 1.0–2.0 | 1.0–2.0 | 1150 | $2,345 | $2.04 | 13d | 4 | 0.98mi |
| 908 S Crutcher Ave Unit B Springfield, MO | 1.0 | 1.0 | 750 | $915 | $1.22 | 23d | 1 | 1.04mi |
| 928 S Crutcher Ave Unit C Springfield, MO | 1.0 | 1.0 | 600 | $650 | $1.08 | 43d | 1 | 1.04mi |
| 861 S Crutcher Ave Springfield, MO | 2.0 | 1.0 | 650 | $695 | $1.07 | 13d | 1 | 1.08mi |
| 2146 E Bennett St Unit 0 Springfield, MO | 2.0 | 1.0 | 1009 | $895 | $0.89 | 43d | 1 | 1.09mi |
| 1834 E Monroe St Springfield, MO | 2.0 | 1.0 | 792 | $895 | $1.13 | 43d | 1 | 1.14mi |
| 2072 E Bennett St Springfield, MO | 1.0–2.0 | 1.0 | 750 | $935 | $1.25 | 43d | 5 | 1.16mi |
| 2831 E University St Springfield, MO | 2.0 | 1.0 | 950 | $1,195 | $1.26 | 13d | 1 | 1.22mi |
| 2831 E University St Springfield, MO | 2.0 | 1.0 | 975 | $1,095 | $1.12 | 23d | 1 | 1.22mi |
| 2942 E Stanford St Apt B Springfield, MO | 2.0 | 1.0 | 784 | $750 | $0.96 | 23d | 1 | 1.22mi |
| 2020 E Bennett St Springfield, MO | 1.0–2.0 | 1.0 | 743 | $930 | $1.25 | 43d | 6 | 1.24mi |
| 726 S Kentwood Ave Springfield, MO | 2.0 | 1.0 | 1116 | $1,295 | $1.16 | 13d | 1 | 1.27mi |
| 2149 E Sunshine St Springfield, MO | 1.0–2.0 | 1.0–1.5 | 671 | $1,453 | $2.17 | 13d | 20 | 1.34mi |
Listing history 19 events
-
2026-06-18days on market $120,000 Active 16 DOM
-
2026-06-17days on market $120,000 Active 15 DOM
-
2026-06-16days on market $120,000 Active 14 DOM
-
2026-06-15days on market $120,000 Active 13 DOM
-
2026-06-14days on market $120,000 Active 11 DOM
-
2026-06-10days on market $120,000 Active 8 DOM
-
2026-06-09days on market $120,000 Active 7 DOM
-
2026-06-08days on market $120,000 Active 6 DOM
-
2026-06-07statusdays on market $120,000 Active 5 DOM
-
2026-05-22$120,000 Active
-
2023-06-16soldstatus Closed 258-char remark
Show marketing remark (258 chars)
Dont miss this cute little home that needs to be brought back to its former glory. This house has 3 bedrooms, an attached 2 car garage, hardwood floors, central heat and air, and is located in a great area. Selling as-is. Call today for your private showing!
-
2023-05-20status Pending 258-char remark
Show marketing remark (258 chars)
Dont miss this cute little home that needs to be brought back to its former glory. This house has 3 bedrooms, an attached 2 car garage, hardwood floors, central heat and air, and is located in a great area. Selling as-is. Call today for your private showing!
-
2023-05-18status Active 258-char remark
Show marketing remark (258 chars)
Dont miss this cute little home that needs to be brought back to its former glory. This house has 3 bedrooms, an attached 2 car garage, hardwood floors, central heat and air, and is located in a great area. Selling as-is. Call today for your private showing!
-
2023-05-18price $84,000 258-char remark
Show marketing remark (258 chars)
Dont miss this cute little home that needs to be brought back to its former glory. This house has 3 bedrooms, an attached 2 car garage, hardwood floors, central heat and air, and is located in a great area. Selling as-is. Call today for your private showing!
-
2023-04-29status Pending 258-char remark
Show marketing remark (258 chars)
Dont miss this cute little home that needs to be brought back to its former glory. This house has 3 bedrooms, an attached 2 car garage, hardwood floors, central heat and air, and is located in a great area. Selling as-is. Call today for your private showing!
-
2023-04-28$89,997 Active 258-char remark
Show marketing remark (258 chars)
Dont miss this cute little home that needs to be brought back to its former glory. This house has 3 bedrooms, an attached 2 car garage, hardwood floors, central heat and air, and is located in a great area. Selling as-is. Call today for your private showing!
-
2008-10-27soldstatus
-
2008-03-17$67,500
-
2004-04-27soldstatus
ⓘ Source: listings_history table (triggers on properties + properties_extension) + one-shot
backfill from property_details.listing_events for pre-trigger history.
Tax reassessment forecast MO · Resets to sale price
- Current annual tax
- $868 · $72/mo
- Projected year-2 tax
- $1,164 · $97/mo
- Expected delta
- +$296/yr (+$25/mo · 34.0%)
ⓘ Screening estimate from a state-policy table — verify with the county assessor before closing.
Climate risk First Street
- Flood 1/10 Low FEMA zone X (unshaded) · 0% chance over 30 yrs
- Wildfire 1/10 Low
- Heat 5/10 Major 7 d/yr ≥104°F today · 18 d/yr by 30 yrs out
- Wind 2/10 Low 0% chance of damaging wind over 30 yrs
- Air quality 2/10 Low 2 unhealthy d/yr today · 2 by 30 yrs out
Nearby sold comps map
Loading sold comps map…
Walkable amenities ~0.75 mi
Loading nearby amenities…
Taxation est. · year 1
- Rental income
- $13,874
- − Mortgage interest
- −$6,722
- − Property taxes
- −$868
- − Insurance
- −$600
- − Repairs & maintenance
- −$1,110
- − Management
- −$1,110
- − Depreciation
- −$3,491
- Taxable loss
- −$27
- Est. tax savings @ 24.0%
- +$6
- After-tax cash flow
- $1,947/yr
For passive investors: Depreciation is non-cash, so a rental often shows a tax loss while cash-flowing — sheltering income. Rental losses are passive: they offset passive income freely, and up to $25,000/yr can offset ordinary (W-2) income if you actively participate and your MAGI is under $100k (phasing out to $0 by $150k); unused losses carry forward. On sale, claimed depreciation is recaptured at up to 25%, and gains may owe capital-gains tax (a 1031 exchange can defer both). Figures are a year-1 estimate at your 24.0% rate — not tax advice; consult a CPA.
Schools (NCES district)
- District
- Springfield R-XII
- NCES district ID
- 2928860
- Math proficiency
- 32% ▼ -2.00%
- Reading proficiency
- 46% ▼ -3.00%
- Median HH income
- $37,886
- Composite
- 32.45/100
- National rank
- #5717
- State rank
- #174 of 324 in MO
Livability — Springfield
- Score
- 75/100
- State rank
- #57
- US rank
- #4121
Category grades
Schools grade is shown separately in the Schools card above.
Census & demographics
- Census place
- Springfield, MO
- County
- Greene County · 244,327 people
- City population
- 223,044
- Metro
- Springfield, MO
- Population (ZIP)
- 46,739
- Household income
- $55,019
- Rent vs Own
- Severe rent burden
- 1818.0
Population outlook (Greene County) Hauer SSP2
- Today (2025)
- 319,054 people
- By 2030
- 335,135 · +5.0%
- By 2040
- 366,186 · +14.8%
- By 2050
- 397,431 · +24.6%
- By 2075
- 477,035 · +49.5%
- By 2100
- 520,828 · +63.2%
Race, ethnicity, and origin ACS 2023
- Neighborhood character
- Predominantly White (81%)
- Race & ethnicity
- White 81% Two or more races 8% Hispanic / Latino 5% Black 4% Asian 2%
- Common ancestry
- Slovak 2% Lithuanian 2% Italian 2%
- Foreign-born
- 3% · Canada, Vietnam
- Languages at home
- 95% English-only · Spanish 2% Vietnamese 1% Other Indo-European 1%
Political lean MEDSL · Greene
- 2024 margin
- Strong R (+20.8) · D 38.9% · R 59.7% · Other 1.4%
- 2008→2024 swing
- -5.0pp toward R · 2008: -15.8pp · 2024: -20.8pp
- All cycles
- 2024: R+20.8 2020: R+20.1 2016: R+27.4 2012: R+24.4 2008: R+15.8
Not yet ingested
- Civics
- —
Market trends
- HPI YoY
- ▼ -99.72%
- Current HPI
- 212.9826
- Rent YoY
- ▲ 4.82%
- Metro
- Springfield, MO
- State GDP YoY
- ▲ 1.84%
- F500 in state
- 20
Industry mix (Fortune 500 HQ in MO)
| Industry | F500 HQs | Revenue |
|---|---|---|
| Healthcare | 1 | $163B |
|
||
| Insurance | 1 | $21B |
|
||
| Industrial Technology | 1 | $17B |
|
||
| Retail | 1 | $16B |
|
||
| Industrial Distribution | 1 | $10B |
|
||
| Utilities | 1 | $9B |
|
||
Price history
+77.8% since first listed10 events — show timeline
- 2026-05-22 Listed $120,000 SOMO
- 2023-06-16 Sold (MLS) — SOMO
- 2023-05-20 Pending — SOMO
- 2023-05-18 Relisted — SOMO
- 2023-05-18 Price Changed $84,000 SOMO
- 2023-04-29 Pending — SOMO
- 2023-04-28 Listed $89,997 SOMO
- 2008-10-27 Sold (Public Records) — Public Records
- 2008-03-17 Listed $67,500 SOMO
- 2004-04-27 Sold (Public Records) — Public Records
Property tax history
+3.5%/yrLatest (2025): $868 · -0.5% YoY. Source: county tax records.
Cash-flow waterfall
monthlySold comps — $/sqft
last 12 mo · ≤1 miLoading sold comps…