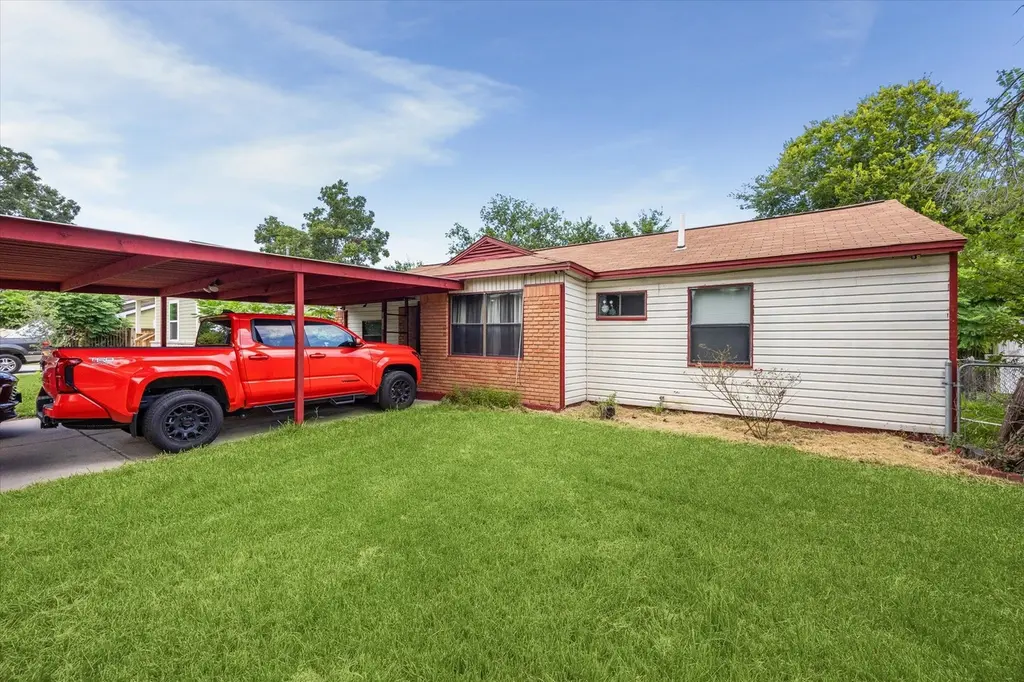
10109 Chesterfield Dr · Houston, TX
Flood risk 3/10 · Minor
- FEMA flood zone
- X (shaded)
- Chance of flooding over 30 yrs
- 0.1%
- Est. flood insurance / yr
- $507 – $1,088
Fire risk 1/10 · Minimal
- Est. fire insurance / yr
- $1,222 – $2,270
Heat risk 9/10 · Severe
- Hot days now (above 109°F)
- 6 days/yr
- Hot days in 30 yrs
- 19 days/yr
Wind risk 9/10 · Severe
- Chance of severe wind over 30 yrs
- 99.0%
Air-quality risk 2/10 · Minimal
- Unhealthy air days now
- 2 days/yr
- Unhealthy air days in 30 yrs
- 2 days/yr
Risk factors via First Street. Map © Google.
Why this score? — see what drove the C+ grade
The composite is a weighted blend of 9 inputs, each scored 0–100. Each bar is that input's sub-score; the figure is the points it added to the 100-point composite (weight × sub-score).
- Cash flow +15.4/30.0
- ARV discount +15.0/15.0
- Appreciation +10.0/10.0
- 1% rule +5.3/10.0
- DSCR +4.7/10.0
- Rent growth +3.7/5.0
- Livability +3.7/5.0
- Schools +2.7/10.0
- Condition / age +2.5/5.0
$140,000
🖨 Deal sheet 📄 Offer letter ✓ Due diligence
Listing remarks MLS
10109 Chesterfield Dr is located in Blueridge subdivision in Harris County. Scroll to see the property features, tax value, mortgage calculator, nearby schools. Don’t miss out on a grate opportunity to call this your home.
Key facts
- 5,998 sq ft lot
- Built 1955
- Listed 238 days
Neighborhood map
What this means for you Summary
Snapshot
- This is a 3-bed/2.0-bath single-family listed at $140k.
Deal economics
- At list price, monthly cash flow is $54 ($651/yr) — positive.
- The deal already cash-flows at list — no discount required.
- Meets the 1% rule at list price ($1k rent vs $140k).
- Recommended offer: $123k (12.0% below list) — sets the bar for market timing.
- Cap rate 6.8% vs local median 3.2% in Houston — top-decile yield for the area; either an underpriced asset or a hidden risk that comps aren't pricing in. Stress-test before assuming the spread holds.
Location & tenants
- Location reads 74/100 on livability (#184 in TX, #4,771 nationally) — a middle-class / working-renter tenant base. Strengths: amenities A+, cost of living A+, housing A+; Watch: schools D, crime F.
- Houston ISD (urban): math 27% / reading 35% proficiency, ranked #593 of 826 in TX (top 72%) — families likely to look elsewhere, expect single-tenant / working-renter base with shorter leases; 71% free/reduced lunch — lower-income household profile, screen leases tightly.
- Market conditions: Rents rising fast (+4.8%/yr); 312 active listings in the ZIP; 17 comparable units currently listed for rent nearby; rentals at typical pace (median 18d on market — plan ~3-4 weeks tenant-placement turnaround); lower-income renter base — watch delinquency; 29,883 units permitted in Harris County in 2024 (8,621 in 5+ unit buildings).
- At $1,447/mo this rent would consume 46% of the median local household income ($37k/yr) (locally 1446% of renters already pay >50% of income on rent) — very limited rent-growth headroom before tenants either downsize or default.
Forward outlook
- In year one you build about $15k of equity ($968 loan paydown + $14k appreciation (10.0% local appreciation)).
- Harris County population projected at +47% by 2050 — long-run rental-demand tailwind backs the buy-and-hold thesis.
- At projected returns (10.0% appreciation + 4.8% rent growth), your $39k cash investment doubles in ~3 years — after that, you're playing with house money.
- By year 3, paydown + projected appreciation supports a ~$38k cash-out refi (75% LTV) — recoverable capital for the next deal without selling this one.
Negotiation context
- It's been on market 238 days — a 12% lower offer ($123k) is reasonable based on typical stale-listing flexibility.
- 6 sale attempts since 6y ago; this cycle's ask has dropped $23k (14%) from the opening price — seller is motivated, your offer sets the floor, not the list.
Risks & watch-outs
- Watch-outs: property tax is 2.5% of price; built in 1955 — expect roof / HVAC / electrical / plumbing capex.
- Climate carrying-cost: severe wind risk, 99% chance of damaging wind over 30y; extreme-heat days projected 6→19/yr by 2055 (HVAC capex compounding) — expect insurance premiums to compound above CPI over the hold.
Questions for the listing agent
- It's been on market 238 days. Have you received any prior offers? Is the seller open to a 12% concession, seller financing, or rate buy-down credit?
- Built in 1955 — when were the roof, HVAC, electrical panel, plumbing, and water heater last replaced?
- Property tax is high relative to price — has the assessment been appealed recently, and will the sale trigger a re-assessment?
- Why hasn't it sold? Are there any deal-killer items the seller is aware of (foundation, flood, title, zoning, code violations)?
- Is there a deadline driving the sale (1031 exchange, divorce, estate, relocation)? That informs how much negotiation room exists.
- Schools are D-rated, which usually means shorter tenancies and higher turnover. Who's the typical renter profile here, and what's been the actual vacancy rate?
- Crime grade is F in this area — have there been break-ins, vandalism, or insurance claims at this property in the last 3 years? What carrier currently insures it and at what premium?
- What's the average days-on-market for RENTAL listings here right now (not sales)? A rising rental-DOM trend means longer vacancies and softer asking-rent achievability than the comps imply.
- What's the recent tenant-quality profile in this submarket — average credit score on applications, eviction rate, late-payment / NSF rate, and stable-employment percentage? A property-management company in the area should have these aggregated.
- How much new for-sale + rental construction is in the pipeline within 1–3 miles? Heavy new supply typically softens prices + rents 12–24 months out; constrained supply supports both.
Investment metrics
- 1% rule
- 1.03% ✓
- Cap rate
- 6.76%
- Cash-on-cash
- 1.66%
- DSCR
- 1.07
- GRM
- 8.1
CMA / ARV
- ARV (median comp)
- $180,974
- List price
- $140,000
- Delta
- -22.64%
- Verdict
- UNDERPRICED
- Comps
- 20 within 1.0 mi
Show comp detail 12 sales within ~0.75 mi
| Address | Dist | Beds/Ba | Sqft | Sold | Price | $/sf | Match |
|---|---|---|---|---|---|---|---|
| 10205 Sierra Dr | 0.11mi | 3/1.0 | 1,151 (+4%) | 3mo | $120,000 | $104 | 82 |
| 10006 Chesterfield Dr | 0.07mi | 3/1.0 | 1,170 (+6%) | 3mo | $125,000 | $107 | 80 |
| 3138 Sunbeam St | 0.26mi | 3/1.0 | 1,091 (-1%) | 7mo | $109,900 | $101 | 76 |
| 3334 Dulcrest St | 0.31mi | 3/1.0 | 1,122 (+2%) | 3mo | $90,000 | $80 | 76 |
| 10209 Cathedral Dr | 0.15mi | 3/1.5 | 1,244 (+13%) | 3mo | $180,000 | $145 | 67 |
| 10014 Sierra Dr | 0.14mi | 4/2.0 (+1) | 1,243 (+13%) | 2mo | $185,000 | $149 | 66 |
| 10611 Leitrim Way | 0.65mi | 3/1.0 | 1,105 (+0%) | 0mo | $159,900 | $145 | 65 |
| 3034 Corksie St | 0.36mi | 3/2.0 | 1,225 (+11%) | 0mo | $219,900 | $180 | 65 |
| 3018 Elpyco St | 0.46mi | 4/2.0 (+1) | 1,215 (+10%) | 1mo | $187,000 | $154 | 56 |
| 9321 Cathedral Dr | 0.53mi | 3/1.0 | 1,204 (+9%) | 4mo | $159,000 | $132 | 53 |
| 10818 Carlton Dr | 0.60mi | 3/1.0 | 1,246 (+13%) | 2mo | $175,999 | $141 | 45 |
| 11018 Long Gate | 0.74mi | 3/1.5 | 1,242 (+12%) | 2mo | $130,000 | $105 | 41 |
Match score weights: distance 35% · size 25% · config 20% · recency 20%. Top-matched comps best support the ARV.
Projected returns pro-forma
10.0% appreciation · 4.77% rent growth · sell at horizon
- IRR
- 26.2%
- Equity multiple
- 3.10×
- Total profit
- $82,419
- Equity at exit
- $126,123
- IRR
- 23.5%
- Equity multiple
- 7.27×
- Total profit
- $245,905
- Equity at exit
- $271,989
Cash invested: $39,200 (down + closing). Projections, not guarantees.
Landlord ↔ Tenant lean methodology
- Overall (STATE)
- 87 Strongly Landlord-Friendly
- State Texas
- 87 Strongly Landlord-Friendly · R+5
- County
- — inherits STATE
- City
- — inherits STATE
ZIP-level market 77051
- Home prices YoY
- 9.7%
- Rents YoY
- 4.8%
- Active inventory
- 312
- Price-to-rent
- 8.1×
Monthly cashflow live
- Estimated rent
- $1,447 high interval (Pro) →
- Mortgage (P&I)
- −$734
- Tax from tax record
- −$296 /mo · $3,556/yr
- Insurance
- −$58
- HOA
- −$0
- Vacancy / Maint / Mgmt
- −$304
- Net cashflow
- $54
Break-even live
UW: 25.0% down · 7.5% · 30yr · 1.5% tax · 5.0% vac · 8.0% maint · 8.0% mgmt
Financing live
Cash to close
- Down payment
- $35,000
- Closing costs
- $4,200
- Reserves months
- —
- Total cash needed
- —
Loan-product check · same deal, 3 products live
Conventional
25% down · 7.5% · 30yr
- Down + closing
- —
- Monthly P&I
- —
- Monthly cashflow
- —
- DSCR
- —
- Eligible?
- —
Personal DTI + credit; lowest rate.
DSCR
20% down · 8.5% · 30yr
- Down + closing
- —
- Monthly P&I
- —
- Monthly cashflow
- —
- DSCR
- —
- Eligible?
- —
No personal income docs; deal must DSCR.
Hard money
10% down · 12.0% · 12mo
- Down + closing
- —
- Monthly P&I
- —
- Monthly cashflow
- —
- DSCR
- —
- Eligible?
- —
Short-term bridge; refi at stabilization.
Rent comps 17 comps
| Address | Beds | Baths | Sqft | Rent | $/sqft | DOM | Units | Dist |
|---|---|---|---|---|---|---|---|---|
| 10510 Cathedral Dr Houston, TX | 3.0 | 1.0 | 887 | $1,300 | $1.47 | 43d | 1 | 0.28mi |
| 4112 Grassmere St Houston, TX | 2.0 | 1.0 | 711 | $700 | $0.98 | 10d | 1 | 0.46mi |
| 9414 Heno St Unit 13 Houston, TX | 2.0 | 1.0 | 824 | $900 | $1.09 | 24d | 1 | 0.51mi |
| 4205 Grassmere St Houston, TX | 2.0 | 1.0 | 824 | $900 | $1.09 | 24d | 1 | 0.52mi |
| 2910 Reed Rd Houston, TX | 1.0–3.0 | 1.0–2.0 | 967 | $1,280 | $1.32 | 1d | 5 | 0.78mi |
| 4205 Phlox St Unit 2 BEDROOM 6 Houston, TX | 2.0 | 1.0 | 736 | $860 | $1.17 | 18d | 1 | 0.85mi |
| 4207 Phlox St Houston, TX | 2.0 | 1.0 | 736 | $962 | $1.31 | 1d | 1 | 0.87mi |
| 2889 Reed Rd Houston, TX | 1.0–2.0 | 1.0–2.0 | 997 | $1,648 | $1.65 | 2d | 2 | 0.96mi |
| 4326 Larkspur St Unit 3 Houston, TX | 2.0 | 1.0 | 800 | $1,200 | $1.50 | 16d | 1 | 1.01mi |
| 2725 Reed Rd Houston, TX | 1.0–3.0 | 1.0–2.5 | 911 | $975 | $1.07 | 43d | 1 | 1.05mi |
| 4322 Groton Dr Houston, TX | 3.0 | 1.0 | 858 | $1,395 | $1.63 | 43d | 1 | 1.08mi |
| 11819 Leitrim Way Houston, TX | 3.0 | 1.0 | 1476 | $1,150 | $0.78 | 5d | 1 | 1.31mi |
| 4810 Wilmington St Unit A Houston, TX | 3.0 | 2.0 | 1165 | $1,650 | $1.42 | 43d | 1 | 1.34mi |
| 4723 Mallow St Houston, TX | 3.0 | 2.5 | 1472 | $1,850 | $1.26 | 5d | 1 | 1.37mi |
| 4526 Knoxville St Unit A Houston, TX | 3.0 | 2.5 | 1474 | $1,775 | $1.20 | 14d | 1 | 1.39mi |
| 3137 W Bellfort Ave Houston, TX | 2.0 | 2.0 | 1164 | $1,802 | $1.55 | 43d | 1 | 1.40mi |
| 4918 Wilmington St Unit A Houston, TX | 3.0 | 3.0 | 1300 | $2,100 | $1.62 | 43d | 1 | 1.47mi |
Listing history 28 events
-
2026-02-19price $140,000 228-char remark
Show marketing remark (228 chars)
10109 Chesterfield Dr is located in Blueridge subdivision in Harris County. Scroll to see the property features, tax value, mortgage calculator, nearby schools. Don’t miss out on a grate opportunity to call this your home.
-
2026-02-06price $145,000 228-char remark
Show marketing remark (228 chars)
10109 Chesterfield Dr is located in Blueridge subdivision in Harris County. Scroll to see the property features, tax value, mortgage calculator, nearby schools. Don’t miss out on a grate opportunity to call this your home.
-
2025-12-15price $150,000 228-char remark
Show marketing remark (228 chars)
10109 Chesterfield Dr is located in Blueridge subdivision in Harris County. Scroll to see the property features, tax value, mortgage calculator, nearby schools. Don’t miss out on a grate opportunity to call this your home.
-
2025-11-26price $160,000 228-char remark
Show marketing remark (228 chars)
10109 Chesterfield Dr is located in Blueridge subdivision in Harris County. Scroll to see the property features, tax value, mortgage calculator, nearby schools. Don’t miss out on a grate opportunity to call this your home.
-
2025-09-28$163,000 Active 228-char remark
Show marketing remark (228 chars)
10109 Chesterfield Dr is located in Blueridge subdivision in Harris County. Scroll to see the property features, tax value, mortgage calculator, nearby schools. Don’t miss out on a grate opportunity to call this your home.
-
2024-07-23historical
-
2024-07-01price $159,999
-
2024-06-01$169,999 Active
-
2024-06-01historical
-
2024-05-04price $179,000
-
2024-03-25$184,999 Active
-
2023-01-17historical
-
2022-12-26price $184,900
-
2022-12-05price $209,000
-
2022-11-08$220,000 Active
-
2022-10-26historical
-
2022-05-24historical
-
2021-10-14$220,000 Active
-
2020-12-29soldstatus
-
2020-09-21soldstatus
-
2020-07-29status Pending
-
2020-07-28soldstatus Sold
-
2020-07-22status Option Pending
-
2020-06-01price $125,000
-
2020-04-29price $130,000
-
2020-03-20$136,000 Active
-
2020-01-09soldstatus
-
1988-01-02soldstatus
ⓘ Source: listings_history table (triggers on properties + properties_extension) + one-shot
backfill from property_details.listing_events for pre-trigger history.
Tax reassessment forecast TX · Resets to sale price
- Current annual tax
- $3,556 · $296/mo
- Projected year-2 tax
- $3,556 · $296/mo
- Expected delta
- $0/yr ($0/mo · 0.0%)
ⓘ Screening estimate from a state-policy table — verify with the county assessor before closing.
Climate risk First Street
- Flood 3/10 Moderate FEMA zone X (shaded) · 10% chance over 30 yrs
- Wildfire 1/10 Low
- Heat 9/10 Extreme 6 d/yr ≥109°F today · 19 d/yr by 30 yrs out
- Wind 9/10 Extreme 99% chance of damaging wind over 30 yrs
- Air quality 2/10 Low 2 unhealthy d/yr today · 2 by 30 yrs out
Nearby sold comps map
Loading sold comps map…
Walkable amenities ~0.75 mi
Loading nearby amenities…
Taxation est. · year 1
- Rental income
- $17,363
- − Mortgage interest
- −$7,842
- − Property taxes
- −$3,556
- − Insurance
- −$700
- − Repairs & maintenance
- −$1,389
- − Management
- −$1,389
- − Depreciation
- −$4,073
- Taxable loss
- −$1,586
- Est. tax savings @ 24.0%
- +$381
- After-tax cash flow
- $1,031/yr
For passive investors: Depreciation is non-cash, so a rental often shows a tax loss while cash-flowing — sheltering income. Rental losses are passive: they offset passive income freely, and up to $25,000/yr can offset ordinary (W-2) income if you actively participate and your MAGI is under $100k (phasing out to $0 by $150k); unused losses carry forward. On sale, claimed depreciation is recaptured at up to 25%, and gains may owe capital-gains tax (a 1031 exchange can defer both). Figures are a year-1 estimate at your 24.0% rate — not tax advice; consult a CPA.
Schools (NCES district)
- District
- Houston ISD
- NCES district ID
- 4823640
- Math proficiency
- 27% ▼ -18.00%
- Reading proficiency
- 35% ▼ -6.00%
- Median HH income
- $46,054
- Composite
- 26.63/100
- National rank
- #7173
- State rank
- #593 of 826 in TX
Livability — Houston
- Score
- 74/100
- State rank
- #184
- US rank
- #4771
Category grades
Schools grade is shown separately in the Schools card above.
Census & demographics
- Census place
- Houston, TX
- County
- Harris County · 4,702,590 people
- City population
- 3,226,434
- Metro
- Houston-The Woodlands-Sugar Land, TX
- Population (ZIP)
- 19,795
- Household income
- $37,415
- Rent vs Own
- Severe rent burden
- 1446.0
Population outlook (Harris County) Hauer SSP2
- Today (2025)
- 5,571,493 people
- By 2030
- 6,089,821 · +9.3%
- By 2040
- 7,142,806 · +28.2%
- By 2050
- 8,185,864 · +46.9%
- By 2075
- 10,574,329 · +89.8%
- By 2100
- 12,109,958 · +117.4%
Race, ethnicity, and origin ACS 2023
- Neighborhood character
- Predominantly Black (77%)
- Race & ethnicity
- Black 77% Hispanic / Latino 16% Two or more races 11% White 3%
- Hispanic origin (detail)
- Mexican 6% Puerto Rican 1%
- Foreign-born
- 8% · Canada, China
- Languages at home
- 88% English-only · Spanish 10%
Political lean MEDSL · Harris
- 2024 margin
- Lean D (+5.5) · D 52.0% · R 46.4% · Other 1.6%
- 2008→2024 swing
- +3.9pp toward D · 2008: 1.6pp · 2024: 5.5pp
- All cycles
- 2024: D+5.5 2020: D+13.3 2016: D+12.4 2012: D+0.1 2008: D+1.6
Not yet ingested
- Civics
- —
Market trends
- HPI YoY
- ▲ 16.02%
- Current HPI
- 180.4283
- Rent YoY
- ▲ 4.77%
- Metro
- Houston-The Woodlands-Sugar Land, TX
- State GDP YoY
- ▲ 3.95%
- F500 in state
- 110
Industry mix (Fortune 500 HQ in TX)
| Industry | F500 HQs | Revenue |
|---|---|---|
| Energy | 16 | $1,198B |
|
||
| Technology | 5 | $198B |
|
||
| Engineering / Construction | 4 | $72B |
|
||
| Energy Services | 3 | $60B |
|
||
| Utilities | 3 | $41B |
|
||
| Healthcare | 2 | $330B |
|
||
Price history
+2.9% since first listed28 events — show timeline
- 2026-02-19 Price Changed $140,000 HARMLS
- 2026-02-06 Price Changed $145,000 HARMLS
- 2025-12-15 Price Changed $150,000 HARMLS
- 2025-11-26 Price Changed $160,000 HARMLS
- 2025-09-28 Listed $163,000 HARMLS
- 2024-07-23 Listing Removed — HARMLS
- 2024-07-01 Price Changed $159,999 HARMLS
- 2024-06-01 Listing Removed — HARMLS
- 2024-06-01 Listed $169,999 HARMLS
- 2024-05-04 Price Changed $179,000 HARMLS
- 2024-03-25 Listed $184,999 HARMLS
- 2023-01-17 Listing Removed — HARMLS
- 2022-12-26 Price Changed $184,900 HARMLS
- 2022-12-05 Price Changed $209,000 HARMLS
- 2022-11-08 Listed $220,000 HARMLS
- 2022-10-26 Coming Soon — HARMLS
- 2022-05-24 Listing Removed — HARMLS
- 2021-10-14 Listed $220,000 HARMLS
- 2020-12-29 Sold (Public Records) — Public Records
- 2020-09-21 Sold (Public Records) — Public Records
- 2020-07-29 Pending — HARMLS
- 2020-07-28 Sold (MLS) — HARMLS
- 2020-07-22 Pending — HARMLS
- 2020-06-01 Price Changed $125,000 HARMLS
- 2020-04-29 Price Changed $130,000 HARMLS
- 2020-03-20 Listed $136,000 HARMLS
- 2020-01-09 Sold (Public Records) — Public Records
- 1988-01-02 Sold (Public Records) — Public Records
Property tax history
+9.4%/yrLatest (2025): $3,556 · +1.6% YoY. Source: county tax records.
Cash-flow waterfall
monthlySold comps — $/sqft
last 12 mo · ≤1 miLoading sold comps…