 Multi-family
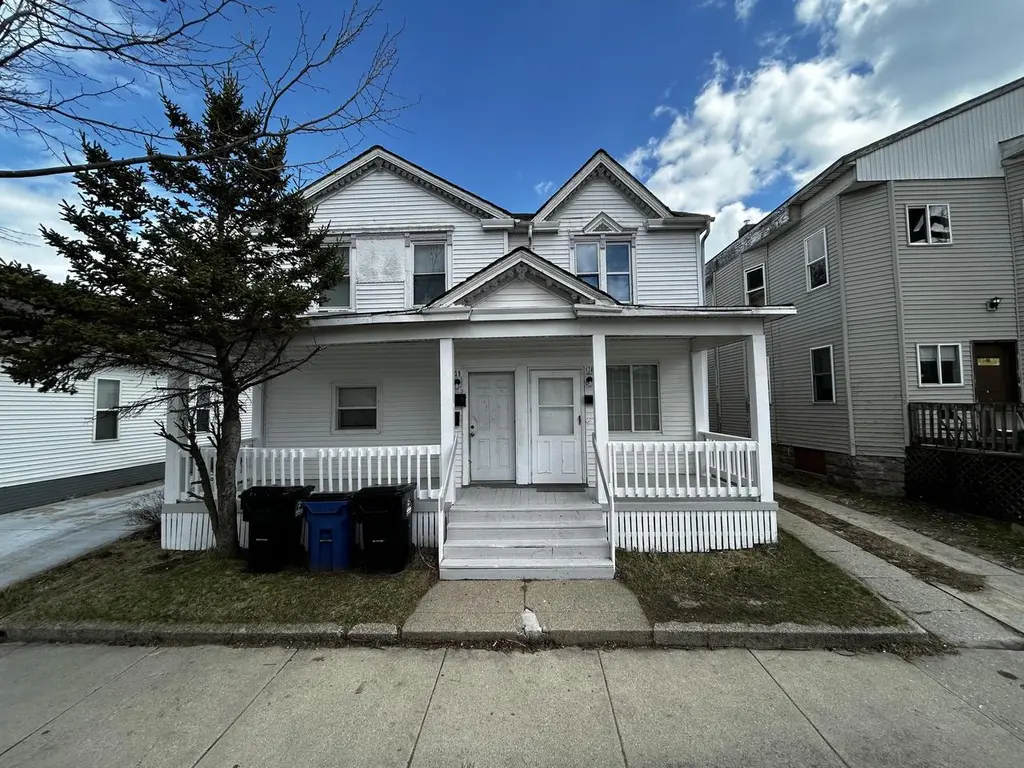
739 Villa St · Racine, WI
Flood risk 1/10 · Minimal
- FEMA flood zone
- X (unshaded)
- Chance of flooding over 30 yrs
- 0.0%
- Est. flood insurance / yr
- $507 – $1,088
Fire risk 1/10 · Minimal
- Est. fire insurance / yr
- $636 – $1,182
Heat risk 2/10 · Minimal
- Hot days now (above 95°F)
- 7 days/yr
- Hot days in 30 yrs
- 13 days/yr
Wind risk 2/10 · Minimal
- Chance of severe wind over 30 yrs
- —
Air-quality risk 3/10 · Minor
- Unhealthy air days now
- 3 days/yr
- Unhealthy air days in 30 yrs
- 3 days/yr
Risk factors via First Street. Map © Google.
Why this score? — see what drove the C- grade
The composite is a weighted blend of 9 inputs, each scored 0–100. Each bar is that input's sub-score; the figure is the points it added to the 100-point composite (weight × sub-score).
- Cash flow +26.2/30.0
- DSCR +8.9/10.0
- 1% rule +7.5/10.0
- Rent growth +4.0/5.0
- Livability +4.0/5.0
- Condition / age +2.5/5.0
- Schools +1.5/10.0
- ARV discount +0.0/15.0
- Appreciation +0.0/10.0
$249,900
🖨 Deal sheet 📄 Offer letter ✓ Due diligence
Multi-family units
County records classify this as Multi-Family (2-4 Unit). Listing-text estimate: 1 unit. estimate disagrees with records
Listing remarks MLS
A Profitable Multifamily Property Just Steps from Downtown Racine and the lake. This property presents an ideal chance to live in one unit while generating cash flow to cover your mortgage. The spacious, updated three-bedroom unit is primed for the next owner or tenant, while the other two units are currently rented and already producing income. This investment opportunity is perfect for the next savvy investor looking to capitalize on a great deal.
Key facts
- Multifamily property
- 4,791 sq ft lot
- Built 1880
Tags
Neighborhood map
What this means for you Summary
Snapshot
- This is a multifamily listed at $250k.
Deal economics
- At list price, monthly cash flow is $641 ($8k/yr) — positive.
- The deal already cash-flows at list — no discount required.
- Meets the 1% rule at list price ($3k rent vs $250k).
- Recommended offer: $242k (3.0% below list) — sets the bar for market timing.
- Cap rate 9.4% vs local median 4.0% in Racine — top-decile yield for the area; either an underpriced asset or a hidden risk that comps aren't pricing in. Stress-test before assuming the spread holds.
Location & tenants
- Location reads 80/100 on livability (#58 in WI, #1,622 nationally) — a professional / high-income tenant draw. Strengths: commute A+, cost of living A+, housing A+; Watch: employment D, schools D-.
- Racine Unified School District (urban): math 12% / reading 20% proficiency, ranked #335 of 342 in WI (top 98%) — low school quality limits family demand, transient renter base, plan for 1-2y turnover.
- Market conditions: Rents rising fast (+5.8%/yr); 91 active listings in the ZIP; 505 units permitted in Racine County in 2024 (287 in 5+ unit buildings).
- At $3,131/mo this rent would consume 63% of the median local household income ($60k/yr) (locally 1164% of renters already pay >50% of income on rent) — very limited rent-growth headroom before tenants either downsize or default.
Forward outlook
- Local home prices are declining (-3.0%/yr); year-one equity from $2k of loan paydown is wiped out by about $7k of value loss. Plan a longer hold.
- Racine County population projected to shrink 7% by 2050 — rents likely to lag national; underwrite the cash flow, not the appreciation.
- At projected returns (-3.0% appreciation + 5.8% rent growth), your $70k cash investment doubles in ~8 years — after that, you're playing with house money.
Negotiation context
- It's been on market 48 days — a 3% lower offer ($242k) is reasonable based on typical stale-listing flexibility.
- 2 sale attempts since 12y ago with the ask held roughly flat each time — persistent listings suggest the price (not the market) is what's stuck; bring a comps-based counter.
- Current owner paid $147k; list at $250k implies a 70% gain — meaningful room to come down on a strong offer.
Risks & watch-outs
- Watch-outs: built in 1880 — expect roof / HVAC / electrical / plumbing capex.
Questions for the listing agent
- It's been on market 48 days. Have you received any prior offers? Is the seller open to a 3% concession, seller financing, or rate buy-down credit?
- Built in 1880 — when were the roof, HVAC, electrical panel, plumbing, and water heater last replaced?
- Is there a deadline driving the sale (1031 exchange, divorce, estate, relocation)? That informs how much negotiation room exists.
- Schools are D-rated, which usually means shorter tenancies and higher turnover. Who's the typical renter profile here, and what's been the actual vacancy rate?
- What's the average days-on-market for RENTAL listings here right now (not sales)? A rising rental-DOM trend means longer vacancies and softer asking-rent achievability than the comps imply.
- What's the recent tenant-quality profile in this submarket — average credit score on applications, eviction rate, late-payment / NSF rate, and stable-employment percentage? A property-management company in the area should have these aggregated.
- How much new apartment / multifamily construction is in the pipeline within 1–3 miles? Heavy new supply (>2% of stock underway) typically softens rents 12–24 months out; light construction supports rent growth.
Investment metrics
- 1% rule
- 1.25% ✓
- Cap rate
- 9.37%
- Cash-on-cash
- 11.00%
- DSCR
- 1.49
- GRM
- 6.7
CMA / ARV
- ARV (median comp)
- $175,580
- List price
- $249,900
- Delta
- 42.33%
- Verdict
- OVERPRICED
- Comps
- 20 within 1.0 mi
Show comp detail 12 sales within ~0.75 mi
| Address | Dist | Beds/Ba | Sqft | Sold | Price | $/sf | Match |
|---|---|---|---|---|---|---|---|
| 932 Center St | 0.24mi | 9/2.0 | 2,900 (-1%) | 21mo | $150,000 | $52 | 69 |
| 1237 Wisconsin Ave #1239 | 0.54mi | —/— | 2,903 (-1%) | 7mo | $145,000 | $50 | 67 |
| 903 Villa St | 0.14mi | 8/3.0 | 3,238 (+10%) | 11mo | $220,000 | $68 | 67 |
| 1120 College Ave | 0.39mi | 6/3.0 | 2,789 (-5%) | 10mo | $75,000 | $27 | 65 |
| 920 Villa St | 0.18mi | 6/2.0 | 3,110 (+6%) | 21mo | $125,000 | $40 | 64 |
| 1129 Park Ave | 0.40mi | 6/2.0 | 3,098 (+6%) | 13mo | $185,000 | $60 | 62 |
| 1033 Pearl St | 0.50mi | 6/2.0 | 2,850 (-3%) | 20mo | $170,000 | $60 | 56 |
| 1301 Center St | 0.56mi | —/— | 3,024 (+3%) | 23mo | $79,900 | $26 | 50 |
| 1615 W 6th St | 0.74mi | 6/2.0 | 2,651 (-10%) | 1mo | $190,000 | $72 | 48 |
| 901 S Memorial Dr | 0.62mi | 4/1.5 | 2,755 (-6%) | 16mo | $71,000 | $26 | 47 |
| 245 N Memorial Dr | 0.60mi | 4/2.0 | 3,186 (+8%) | 20mo | $56,000 | $18 | 41 |
| 1120 13th St | 0.63mi | 4/2.0 | 2,665 (-9%) | 22mo | $80,000 | $30 | 37 |
Match score weights: distance 35% · size 25% · config 20% · recency 20%. Top-matched comps best support the ARV.
Projected returns pro-forma
-3.0% appreciation · 5.84% rent growth · sell at horizon
- IRR
- 3.5%
- Equity multiple
- 1.14×
- Total profit
- $9,659
- Equity at exit
- $37,261
- IRR
- 15.6%
- Equity multiple
- 2.45×
- Total profit
- $101,478
- Equity at exit
- $21,607
Cash invested: $69,972 (down + closing). Projections, not guarantees.
Landlord ↔ Tenant lean methodology
- Overall (STATE)
- 73 Landlord-Friendly
- State Wisconsin
- 73 Landlord-Friendly · R+2
- County
- — inherits STATE
- City
- — inherits STATE
ZIP-level market 53403
- Rents YoY
- 5.8%
- Active inventory
- 91
- Price-to-rent
- 16.5×
Monthly cashflow live
- Estimated rent
- $3,131 high interval (Pro) →
- Mortgage (P&I)
- −$1,311
- Tax from tax record
- −$418 /mo · $5,011/yr
- Insurance
- −$104
- HOA
- −$0
- Vacancy / Maint / Mgmt
- −$658
- Net cashflow
- $641
Break-even live
3-unit breakdown (identical units grouped — click to expand)
| Units | Beds | Baths | Est. rent |
|---|---|---|---|
| 1× unit | 3 | 1 | $1,264 |
| 2× units | 1 | 1 | $1,868 |
| #2 | 1 | 1 | $934 |
| #3 | 1 | 1 | $934 |
| Total (3 units) | $3,131 | ||
UW: 25.0% down · 7.5% · 30yr · 1.5% tax · 5.0% vac · 8.0% maint · 8.0% mgmt
Financing live
Cash to close
- Down payment
- $62,475
- Closing costs
- $7,497
- Reserves months
- —
- Total cash needed
- —
Loan-product check · same deal, 3 products live
Conventional
25% down · 7.5% · 30yr
- Down + closing
- —
- Monthly P&I
- —
- Monthly cashflow
- —
- DSCR
- —
- Eligible?
- —
Personal DTI + credit; lowest rate.
DSCR
20% down · 8.5% · 30yr
- Down + closing
- —
- Monthly P&I
- —
- Monthly cashflow
- —
- DSCR
- —
- Eligible?
- —
No personal income docs; deal must DSCR.
Hard money
10% down · 12.0% · 12mo
- Down + closing
- —
- Monthly P&I
- —
- Monthly cashflow
- —
- DSCR
- —
- Eligible?
- —
Short-term bridge; refi at stabilization.
Listing history 8 events
-
2026-05-07price $249,900 453-char remark
Show marketing remark (453 chars)
A Profitable Multifamily Property Just Steps from Downtown Racine and the lake. This property presents an ideal chance to live in one unit while generating cash flow to cover your mortgage. The spacious, updated three-bedroom unit is primed for the next owner or tenant, while the other two units are currently rented and already producing income. This investment opportunity is perfect for the next savvy investor looking to capitalize on a great deal.
-
2026-04-09$259,900 Active 453-char remark
Show marketing remark (453 chars)
A Profitable Multifamily Property Just Steps from Downtown Racine and the lake. This property presents an ideal chance to live in one unit while generating cash flow to cover your mortgage. The spacious, updated three-bedroom unit is primed for the next owner or tenant, while the other two units are currently rented and already producing income. This investment opportunity is perfect for the next savvy investor looking to capitalize on a great deal.
-
2024-07-10soldstatus $147,000
-
2024-05-24soldstatus $137,000
-
2018-05-08soldstatus $77,500
-
2015-05-28historical 314-char remark
Show marketing remark (314 chars)
NICE 3 FAM WITH RECENT UPDATES. ALL UNITS AVERAGE CONDITION. NEAR DOWNTOWN WHERE LOTS FUN SUMMER EVENTS ARE BEING HELD. PERFECT FOR O/O OR INVESTOR. LOTS PARKING SPACE BACK YARD. OWNER CAN OCCUPY LARGE SPACIOUS LOWER 3 BED WHILE RENTING 2 OTHER UNITS. SHWGS EASILY ARRANGED. BRING IN CASH OFFERS! AGRESSIVE SELLER.
-
2014-09-05$59,000 Active 314-char remark
Show marketing remark (314 chars)
NICE 3 FAM WITH RECENT UPDATES. ALL UNITS AVERAGE CONDITION. NEAR DOWNTOWN WHERE LOTS FUN SUMMER EVENTS ARE BEING HELD. PERFECT FOR O/O OR INVESTOR. LOTS PARKING SPACE BACK YARD. OWNER CAN OCCUPY LARGE SPACIOUS LOWER 3 BED WHILE RENTING 2 OTHER UNITS. SHWGS EASILY ARRANGED. BRING IN CASH OFFERS! AGRESSIVE SELLER.
-
2007-08-07soldstatus $75,000
ⓘ Source: listings_history table (triggers on properties + properties_extension) + one-shot
backfill from property_details.listing_events for pre-trigger history.
Tax reassessment forecast WI · Partial reset (capped growth)
- Current annual tax
- $5,011 · $418/mo
- Projected year-2 tax
- $5,011 · $418/mo
- Expected delta
- $0/yr ($0/mo · 0.0%)
ⓘ Screening estimate from a state-policy table — verify with the county assessor before closing.
Climate risk First Street
- Flood 1/10 Low FEMA zone X (unshaded) · 0% chance over 30 yrs
- Wildfire 1/10 Low
- Heat 2/10 Low 7 d/yr ≥95°F today · 13 d/yr by 30 yrs out
- Wind 2/10 Low
- Air quality 3/10 Moderate 3 unhealthy d/yr today · 3 by 30 yrs out
Nearby sold comps map
Loading sold comps map…
Walkable amenities ~0.75 mi
Loading nearby amenities…
Taxation est. · year 1
- Rental income
- $37,572
- − Mortgage interest
- −$13,998
- − Property taxes
- −$5,011
- − Insurance
- −$1,250
- − Repairs & maintenance
- −$3,006
- − Management
- −$3,006
- − Depreciation
- −$7,270
- Taxable income
- $4,031
- Est. tax owed @ 24.0%
- −$968
- After-tax cash flow
- $6,727/yr
For passive investors: Depreciation is non-cash, so a rental often shows a tax loss while cash-flowing — sheltering income. Rental losses are passive: they offset passive income freely, and up to $25,000/yr can offset ordinary (W-2) income if you actively participate and your MAGI is under $100k (phasing out to $0 by $150k); unused losses carry forward. On sale, claimed depreciation is recaptured at up to 25%, and gains may owe capital-gains tax (a 1031 exchange can defer both). Figures are a year-1 estimate at your 24.0% rate — not tax advice; consult a CPA.
Schools (NCES district)
- District
- Racine Unified School District
- NCES district ID
- 5512360
- Math proficiency
- 12% ▼ -7.00%
- Reading proficiency
- 20% ▬ 0.00%
- Median HH income
- $50,716
- Composite
- 14.64/100
- National rank
- #9405
- State rank
- #335 of 342 in WI
Livability — Racine
- Score
- 80/100
- State rank
- #58
- US rank
- #1622
Category grades
Schools grade is shown separately in the Schools card above.
Census & demographics
- Census place
- Racine, WI
- County
- Racine County · 146,693 people
- City population
- 67,505
- Metro
- Racine, WI
- Population (ZIP)
- 27,009
- Household income
- $59,820
- Rent vs Own
- Severe rent burden
- 1164.0
Population outlook (Racine County) Hauer SSP2
- Today (2025)
- 195,281 people
- By 2030
- 193,725 · -0.8%
- By 2040
- 188,159 · -3.6%
- By 2050
- 181,323 · -7.1%
- By 2075
- 174,342 · -10.7%
- By 2100
- 166,870 · -14.5%
Race, ethnicity, and origin ACS 2023
- Neighborhood character
- Diverse neighborhood (Simpson 0.69)
- Race & ethnicity
- White 42% Black 27% Hispanic / Latino 24% Two or more races 16%
- Hispanic origin (detail)
- Mexican 19% Puerto Rican 3%
- Common ancestry
- Romanian 3% Portuguese 2% Lithuanian 2%
- Foreign-born
- 7% · Canada
- Languages at home
- 84% English-only · Spanish 15%
Political lean MEDSL · Racine
- 2024 margin
- Lean R (+6.2) · D 46.3% · R 52.5% · Other 1.2%
- 2008→2024 swing
- -13.6pp toward R · 2008: 7.4pp · 2024: -6.2pp
- All cycles
- 2024: R+6.2 2020: R+4.1 2016: R+4.4 2012: D+3.6 2008: D+7.4
Not yet ingested
- Civics
- —
Market trends
- HPI YoY
- ▼ -147.08%
- Current HPI
- 191.0012
- Rent YoY
- ▲ 5.84%
- Metro
- Racine, WI
- State GDP YoY
- ▲ 2.10%
- F500 in state
- 20
Industry mix (Fortune 500 HQ in WI)
| Industry | F500 HQs | Revenue |
|---|---|---|
| Industrial Machinery | 4 | $23B |
|
||
| Industrial Technology | 2 | $36B |
|
||
| Insurance | 1 | $36B |
|
||
| Professional Services | 1 | $19B |
|
||
| Utilities | 1 | $9B |
|
||
| Consumer Goods | 1 | $3B |
|
||
Price history
+233.2% since first listed8 events — show timeline
- 2026-05-07 Price Changed $249,900 METROMLS
- 2026-04-09 Listed $259,900 METROMLS
- 2024-07-10 Sold (Public Records) $147,000 Public Records
- 2024-05-24 Sold (Public Records) $137,000 Public Records
- 2018-05-08 Sold (Public Records) $77,500 Public Records
- 2015-05-28 Listing Removed — METROMLS
- 2014-09-05 Listed $59,000 METROMLS
- 2007-08-07 Sold (Public Records) $75,000 Public Records
Property tax history
+5.4%/yrLatest (2025): $5,011 · +34.5% YoY. Source: county tax records.
Cash-flow waterfall
monthlySold comps — $/sqft
last 12 mo · ≤1 miLoading sold comps…