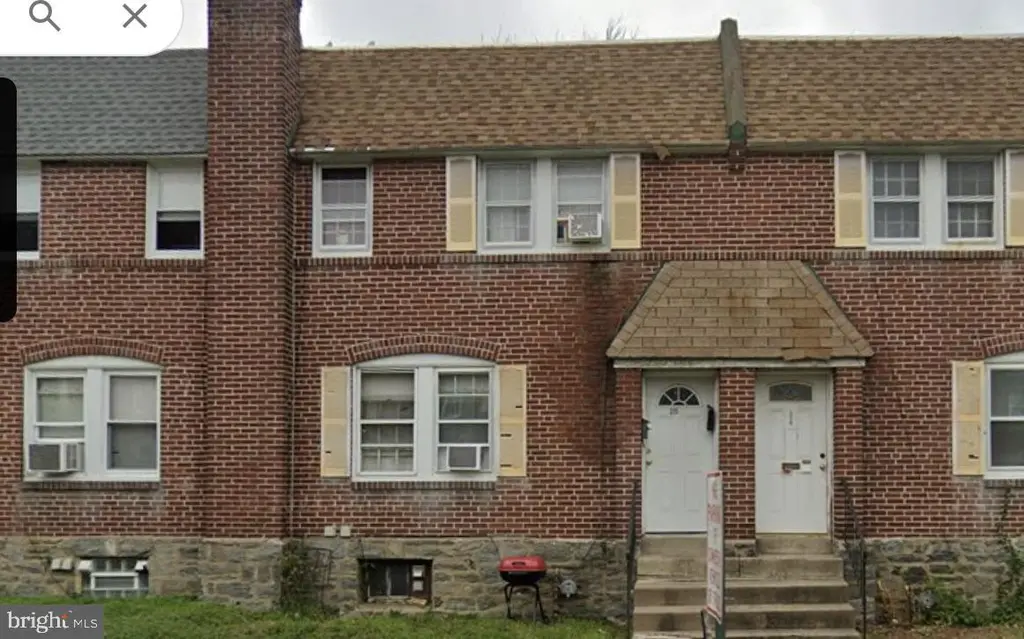
315 E Essex Ave · Upper Darby, PA
Flood risk 1/10 · Minimal
- FEMA flood zone
- X (unshaded)
- Chance of flooding over 30 yrs
- 0.0%
- Est. flood insurance / yr
- $473 – $860
Fire risk 1/10 · Minimal
- Est. fire insurance / yr
- $511 – $949
Heat risk 6/10 · Moderate
- Hot days now (above 103°F)
- 7 days/yr
- Hot days in 30 yrs
- 15 days/yr
Wind risk 6/10 · Moderate
- Chance of severe wind over 30 yrs
- 27.0%
Air-quality risk 4/10 · Minor
- Unhealthy air days now
- 3 days/yr
- Unhealthy air days in 30 yrs
- 6 days/yr
Risk factors via First Street. Map © Google.
Why this score? — see what drove the D grade
The composite is a weighted blend of 9 inputs, each scored 0–100. Each bar is that input's sub-score; the figure is the points it added to the 100-point composite (weight × sub-score).
- ARV discount +12.6/15.0
- Cash flow +10.0/30.0
- Rent growth +4.7/5.0
- 1% rule +3.8/10.0
- DSCR +2.9/10.0
- Livability +2.5/5.0
- Condition / age +2.5/5.0
- Schools +2.4/10.0
- Appreciation +0.0/10.0
$210,000
🖨 Deal sheet 📄 Offer letter ✓ Due diligence
Listing remarks MLS
Attention Investors!!! This is an approved short sale at the listed price. The sale will be subject to final bank approval. Both units are occupied by tenants who are paying on time consistently. Please present offers with proof of funds and/or approval for private financing, or a hard money loan.
Key facts
- 2,178 sq ft lot
- Garage
- Built 1940
Neighborhood map
What this means for you Summary
Snapshot
- This is a 3-bed/2.0-bath townhouse listed at $210k.
Deal economics
- At list price, monthly cash flow is $-127 ($-2k/yr) — negative.
- To cash-flow at today's rent, offer at most $188k (10.6% below list).
- To meet the 1% rule (rent ≥ 1% of price), the offer needs to be $185k (11.9% below list).
- Recommended offer: $185k (12.0% below list) — sets the bar for market timing.
Location & tenants
- Location reads: area grade D — affects rentability + tenant quality, not the cash-flow math above.
- Upper Darby SD (suburban): math 18% / reading 36% proficiency, ranked #453 of 539 in PA (top 84%) — low school quality limits family demand, transient renter base, plan for 1-2y turnover.
- Market conditions: Rents rising fast (+8.9%/yr); 94 active listings in the ZIP; 40 comparable units currently listed for rent nearby; rentals at typical pace (median 24d on market — plan ~3-4 weeks tenant-placement turnaround); 299 units permitted in Delaware County in 2024 (5 in 5+ unit buildings).
- This rent runs 36% of the median local income ($61k/yr) — at the standard rent-burdened threshold; future hikes will face affordability resistance.
Forward outlook
- Local home prices are declining (-3.0%/yr); year-one equity from $1k of loan paydown is wiped out by about $6k of value loss. Plan a longer hold.
Negotiation context
- It's been on market 293 days — a 12% lower offer ($185k) is reasonable based on typical stale-listing flexibility.
- 4 sale attempts since 2y ago; this cycle's ask is 8% above the opening price — seller raised mid-cycle; expect resistance to lowballs.
- Current owner paid $135k; list at $210k implies a 56% gain — meaningful room to come down on a strong offer.
Risks & watch-outs
- Watch-outs: built in 1940 — expect roof / HVAC / electrical / plumbing capex.
- Climate carrying-cost: major wind risk, 27% chance of damaging wind over 30y; extreme-heat days projected 7→15/yr by 2055 (HVAC capex compounding) — expect insurance premiums to compound above CPI over the hold.
Questions for the listing agent
- What do current leases actually rent for vs. the listed asking? Can we see a recent rent roll and the last 12 months of T-12 income?
- It's been on market 293 days. Have you received any prior offers? Is the seller open to a 12% concession, seller financing, or rate buy-down credit?
- Built in 1940 — when were the roof, HVAC, electrical panel, plumbing, and water heater last replaced?
- Why hasn't it sold? Are there any deal-killer items the seller is aware of (foundation, flood, title, zoning, code violations)?
- Is there a deadline driving the sale (1031 exchange, divorce, estate, relocation)? That informs how much negotiation room exists.
- The area grade is low — what's the realistic commute time and amenity access for the typical tenant pool here? Any planned neighborhood developments (good or bad) we should know about?
- What's the average days-on-market for RENTAL listings here right now (not sales)? A rising rental-DOM trend means longer vacancies and softer asking-rent achievability than the comps imply.
- What's the recent tenant-quality profile in this submarket — average credit score on applications, eviction rate, late-payment / NSF rate, and stable-employment percentage? A property-management company in the area should have these aggregated.
- How much new for-sale + rental construction is in the pipeline within 1–3 miles? Heavy new supply typically softens prices + rents 12–24 months out; constrained supply supports both.
Investment metrics
- 1% rule
- 0.88% ✗
- Cap rate
- 5.57%
- Cash-on-cash
- -2.58%
- DSCR
- 0.89
- GRM
- 9.5
CMA / ARV
- ARV (median comp)
- $236,730
- List price
- $210,000
- Delta
- -11.29%
- Verdict
- UNDERPRICED
- Comps
- 20 within 1.0 mi
Show comp detail 12 sales within ~0.75 mi
| Address | Dist | Beds/Ba | Sqft | Sold | Price | $/sf | Match |
|---|---|---|---|---|---|---|---|
| 295 Braddock Ave | 0.43mi | 3/1.5 | 1,418 (-2%) | 2mo | $280,000 | $197 | 74 |
| 40 Lamport Rd | 0.34mi | 3/2.0 | 1,327 (-8%) | 0mo | $174,000 | $131 | 71 |
| 232 Le Carra Dr | 0.19mi | 3/1.5 | 1,278 (-11%) | 0mo | $231,000 | $181 | 70 |
| 205 Wembly Rd | 0.69mi | 3/1.0 | 1,415 (-2%) | 0mo | $197,000 | $139 | 61 |
| 25 Madison Ave | 0.57mi | 3/1.5 | 1,535 (+7%) | 1mo | $285,000 | $186 | 60 |
| 432 Grace Rd | 0.51mi | 4/2.0 (+1) | 1,545 (+7%) | 1mo | $235,000 | $152 | 58 |
| 105 Nyack Ave | 0.57mi | 3/1.5 | 1,322 (-8%) | 0mo | $245,000 | $185 | 58 |
| 200 Wembly Rd | 0.67mi | 3/2.5 | 1,524 (+6%) | 0mo | $165,000 | $108 | 57 |
| 22 Lexington Ave | 0.40mi | 4/1.0 (+1) | 1,308 (-9%) | 1mo | $280,000 | $214 | 56 |
| 212 Huntley Rd | 0.74mi | 3/1.5 | 1,370 (-5%) | 1mo | $210,000 | $153 | 55 |
| 309 Sanford Rd | 0.73mi | 3/1.0 | 1,348 (-6%) | 1mo | $170,000 | $126 | 51 |
| 6866 Clover Ln | 0.67mi | 3/2.0 | 1,278 (-11%) | 1mo | $240,000 | $188 | 49 |
Match score weights: distance 35% · size 25% · config 20% · recency 20%. Top-matched comps best support the ARV.
Projected returns pro-forma
-3.0% appreciation · 8.0% rent growth · sell at horizon
- IRR
- -14.6%
- Equity multiple
- 0.45×
- Total profit
- $-32,193
- Equity at exit
- $31,312
- IRR
- 1.3%
- Equity multiple
- 1.11×
- Total profit
- $6,570
- Equity at exit
- $18,157
Cash invested: $58,800 (down + closing). Projections, not guarantees.
Landlord ↔ Tenant lean methodology
- Overall (STATE)
- 62 Landlord-Friendly
- State Pennsylvania
- 62 Landlord-Friendly · EVEN
- County
- — inherits STATE
- City
- — inherits STATE
ZIP-level market 19050
- Rents YoY
- 8.9%
- Active inventory
- 94
- Price-to-rent
- 9.5×
Monthly cashflow live
- Estimated rent
- $1,851 high interval (Pro) →
- Mortgage (P&I)
- −$1,101
- Tax from tax record
- −$400 /mo · $4,801/yr
- Insurance
- −$88
- HOA
- −$0
- Vacancy / Maint / Mgmt
- −$389
- Net cashflow
- $-127
Break-even live
UW: 25.0% down · 7.5% · 30yr · 1.5% tax · 5.0% vac · 8.0% maint · 8.0% mgmt
Financing live
Cash to close
- Down payment
- $52,500
- Closing costs
- $6,300
- Reserves months
- —
- Total cash needed
- —
Loan-product check · same deal, 3 products live
Conventional
25% down · 7.5% · 30yr
- Down + closing
- —
- Monthly P&I
- —
- Monthly cashflow
- —
- DSCR
- —
- Eligible?
- —
Personal DTI + credit; lowest rate.
DSCR
20% down · 8.5% · 30yr
- Down + closing
- —
- Monthly P&I
- —
- Monthly cashflow
- —
- DSCR
- —
- Eligible?
- —
No personal income docs; deal must DSCR.
Hard money
10% down · 12.0% · 12mo
- Down + closing
- —
- Monthly P&I
- —
- Monthly cashflow
- —
- DSCR
- —
- Eligible?
- —
Short-term bridge; refi at stabilization.
Rent comps 40 comps
| Address | Beds | Baths | Sqft | Rent | $/sqft | DOM | Units | Dist |
|---|---|---|---|---|---|---|---|---|
| 7147 Radbourne Rd Upper Darby, PA | 3.0 | 1.0 | 1096 | $1,850 | $1.69 | 12d | 1 | 0.04mi |
| 110 N Union Ave Lansdowne, PA | 4.0 | 1.5 | 1678 | $2,345 | $1.40 | 20d | 1 | 0.10mi |
| 124 Lexington Ave Unit 2 Lansdowne, PA | 2.0 | 1.0 | 1000 | $1,500 | $1.50 | 2d | 1 | 0.23mi |
| 292 N Wycombe Ave Lansdowne, PA | 2.0 | 1.0 | 1162 | $1,600 | $1.38 | 43d | 1 | 0.32mi |
| 7216 Clinton Rd Upper Darby, PA | 3.0 | 1.0 | 1170 | $1,815 | $1.55 | 1d | 1 | 0.35mi |
| 31 Lamport Rd Upper Darby, PA | 3.0 | 1.0 | 1244 | $1,800 | $1.45 | 5d | 1 | 0.36mi |
| 702 Copley Rd Upper Darby, PA | 3.0 | 1.0 | 1044 | $1,750 | $1.68 | 24d | 1 | 0.39mi |
| 293 Wabash Ave Lansdowne, PA | 3.0 | 1.0 | 1377 | $1,900 | $1.38 | 18d | 1 | 0.39mi |
| 7139 Greenwood Ave Upper Darby, PA | 3.0 | 1.0 | 1064 | $1,600 | $1.50 | 24d | 1 | 0.44mi |
| 7050 Clinton Rd Upper Darby, PA | 2.0 | 1.0 | 977 | $1,550 | $1.59 | 43d | 1 | 0.46mi |
| 317 Barker Ave Lansdowne, PA | 3.0 | 2.0 | 1596 | $2,700 | $1.69 | 23d | 1 | 0.46mi |
| 7116 Seaford Rd Upper Darby, PA | 2.0 | 1.0 | 996 | $1,600 | $1.61 | 43d | 1 | 0.47mi |
| 7111 Greenwood Ave Upper Darby, PA | 3.0 | 1.5 | 1064 | $1,800 | $1.69 | 43d | 1 | 0.49mi |
| 7026 Clinton Rd Upper Darby, PA | 2.0 | 1.5 | 902 | $1,650 | $1.83 | 43d | 1 | 0.49mi |
| 430 Glendale Rd Upper Darby, PA | 3.0 | 1.0 | 1090 | $1,650 | $1.51 | 21d | 1 | 0.56mi |
| 6965 Clinton Rd Upper Darby, PA | 2.0 | 1.0 | 986 | $1,675 | $1.70 | 43d | 1 | 0.57mi |
| 35 Elberon Ave Unit 2 Lansdowne, PA | 2.0 | 1.0 | 900 | $1,695 | $1.88 | 24d | 1 | 0.59mi |
| 5 W Plumstead Ave Unit 1 Lansdowne, PA | 2.0 | 1.0 | 1100 | $1,550 | $1.41 | 24d | 1 | 0.62mi |
| 6927 Guilford Rd Upper Darby, PA | 2.0 | 1.0 | 1182 | $1,495 | $1.26 | 2d | 1 | 0.64mi |
| 228 Bayard Rd Upper Darby, PA | 3.0 | 2.5 | 1600 | $2,095 | $1.31 | 5d | 1 | 0.70mi |
| 6839 Radbourne Rd Upper Darby, PA | 3.0 | 1.5 | 1242 | $1,750 | $1.41 | 24d | 1 | 0.71mi |
| 624 Briarcliff Rd Upper Darby, PA | 3.0 | 1.0 | 1307 | $1,700 | $1.30 | 43d | 1 | 0.74mi |
| 624 Briarcliff Rd Unit MAIN UNIT Upper Darby Township, PA | 3.0 | 1.0 | 1307 | $1,700 | $1.30 | 24d | 1 | 0.74mi |
| 101 W Baltimore Ave Unit H4 Lansdowne, PA | 2.0 | 1.0 | 925 | $1,449 | $1.57 | 21d | 1 | 0.80mi |
| 101 W Baltimore Ave Unit B04 Lansdowne, PA | 2.0 | 1.0 | 925 | $1,469 | $1.59 | 24d | 1 | 0.80mi |
| 619 Baily Rd Lansdowne, PA | 3.0 | 1.0 | 1288 | $1,850 | $1.44 | 18d | 1 | 0.84mi |
| 608 Yeadon Ave Unit 2nd Floor Yeadon, PA | 2.0 | 1.0 | 1000 | $1,400 | $1.40 | 12d | 1 | 0.89mi |
| 608 Yeadon Ave Unit 1st Floor Yeadon, PA | 2.0 | 1.0 | 1000 | $1,400 | $1.40 | 17d | 1 | 0.89mi |
| 217 Sansom St Upper Darby, PA | 2.0 | 1.0 | 1342 | $1,000 | $0.75 | 24d | 1 | 0.99mi |
| 130 Garrett Rd Upper Darby, PA | 2.0 | 1.0 | 675 | $999 | $1.48 | 5d | 2 | 1.03mi |
| 177 Wellington Rd Upper Darby, PA | 3.0 | 2.0 | 1236 | $2,000 | $1.62 | 24d | 1 | 1.11mi |
| 826 Guenther Ave Lansdowne, PA | 2.0 | 1.0–2.0 | 800 | $1,699 | $2.12 | 24d | 1 | 1.19mi |
| 7100 W Chester Pike Upper Darby Township, PA | 1.0–2.0 | 1.0 | 770 | $1,315 | $1.71 | 24d | 5 | 1.20mi |
| 55 N Keystone Ave Upper Darby, PA | 3.0 | 1.0 | 1258 | $1,700 | $1.35 | 43d | 1 | 1.29mi |
| 37 Concord Rd Darby, PA | 3.0 | 1.0 | 1120 | $1,795 | $1.60 | 43d | 1 | 1.29mi |
| 1200 Angora Dr Lansdowne, PA | 3.0 | 1.0 | 1530 | $2,300 | $1.50 | 5d | 1 | 1.30mi |
| 233 S State Rd Unit 2ND Upper Darby Township, PA | 3.0 | 2.0 | 950 | $2,000 | $2.11 | 43d | 1 | 1.31mi |
| 44 Sunshine Rd Upper Darby, PA | 4.0 | 1.0 | 1481 | $1,795 | $1.21 | 21d | 1 | 1.38mi |
| 51 N State Rd Upper Darby, PA | 3.0 | 1.0 | 1244 | $1,595 | $1.28 | 43d | 1 | 1.38mi |
| 10 Oakley Rd Upper Darby, PA | 3.0 | 1.0 | 1476 | $1,895 | $1.28 | 24d | 1 | 1.46mi |
Listing history 24 events
-
2026-06-18days on market $210,000 Active 293 DOM
-
2026-06-17days on market $210,000 Active 292 DOM
-
2026-06-16days on market $210,000 Active 291 DOM
-
2026-06-15days on market $210,000 Active 290 DOM
-
2026-06-13days on market $210,000 Active 288 DOM
-
2026-06-13days on market $210,000 Active 287 DOM
-
2026-06-09days on market $210,000 Active 284 DOM
-
2026-06-08days on market $210,000 Active 283 DOM
-
2026-06-07days on market $210,000 Active 282 DOM
-
2026-06-04days on market $210,000 Active 279 DOM
-
2026-06-03days on market $210,000 Active 278 DOM
-
2026-06-02days on market $210,000 Active 277 DOM
-
2026-06-01days on market $210,000 Active 276 DOM
-
2026-05-31days on market $210,000 Active 275 DOM
-
2026-03-17status Active 298-char remark
Show marketing remark (298 chars)
Attention Investors!!! This is an approved short sale at the listed price. The sale will be subject to final bank approval. Both units are occupied by tenants who are paying on time consistently. Please present offers with proof of funds and/or approval for private financing, or a hard money loan.
-
2026-03-05historical 298-char remark
Show marketing remark (298 chars)
Attention Investors!!! This is an approved short sale at the listed price. The sale will be subject to final bank approval. Both units are occupied by tenants who are paying on time consistently. Please present offers with proof of funds and/or approval for private financing, or a hard money loan.
-
2025-10-11price $210,000 298-char remark
Show marketing remark (298 chars)
Attention Investors!!! This is an approved short sale at the listed price. The sale will be subject to final bank approval. Both units are occupied by tenants who are paying on time consistently. Please present offers with proof of funds and/or approval for private financing, or a hard money loan.
-
2025-10-11status Active 298-char remark
Show marketing remark (298 chars)
Attention Investors!!! This is an approved short sale at the listed price. The sale will be subject to final bank approval. Both units are occupied by tenants who are paying on time consistently. Please present offers with proof of funds and/or approval for private financing, or a hard money loan.
-
2025-06-24status Pending 298-char remark
Show marketing remark (298 chars)
Attention Investors!!! This is an approved short sale at the listed price. The sale will be subject to final bank approval. Both units are occupied by tenants who are paying on time consistently. Please present offers with proof of funds and/or approval for private financing, or a hard money loan.
-
2025-06-17status Active 298-char remark
Show marketing remark (298 chars)
Attention Investors!!! This is an approved short sale at the listed price. The sale will be subject to final bank approval. Both units are occupied by tenants who are paying on time consistently. Please present offers with proof of funds and/or approval for private financing, or a hard money loan.
-
2024-10-24status Pending 298-char remark
Show marketing remark (298 chars)
Attention Investors!!! This is an approved short sale at the listed price. The sale will be subject to final bank approval. Both units are occupied by tenants who are paying on time consistently. Please present offers with proof of funds and/or approval for private financing, or a hard money loan.
-
2024-09-05$195,000 Active 298-char remark
Show marketing remark (298 chars)
Attention Investors!!! This is an approved short sale at the listed price. The sale will be subject to final bank approval. Both units are occupied by tenants who are paying on time consistently. Please present offers with proof of funds and/or approval for private financing, or a hard money loan.
-
2006-06-21soldstatus $135,000
-
1987-01-09soldstatus $55,000
ⓘ Source: listings_history table (triggers on properties + properties_extension) + one-shot
backfill from property_details.listing_events for pre-trigger history.
Tax reassessment forecast PA · Partial reset (capped growth)
- Current annual tax
- $4,801 · $400/mo
- Projected year-2 tax
- $4,801 · $400/mo
- Expected delta
- $0/yr ($0/mo · 0.0%)
ⓘ Screening estimate from a state-policy table — verify with the county assessor before closing.
Climate risk First Street
- Flood 1/10 Low FEMA zone X (unshaded) · 0% chance over 30 yrs
- Wildfire 1/10 Low
- Heat 6/10 Major 7 d/yr ≥103°F today · 15 d/yr by 30 yrs out
- Wind 6/10 Major 27% chance of damaging wind over 30 yrs
- Air quality 4/10 Moderate 3 unhealthy d/yr today · 6 by 30 yrs out
Nearby sold comps map
Loading sold comps map…
Walkable amenities ~0.75 mi
Loading nearby amenities…
Taxation est. · year 1
- Rental income
- $22,213
- − Mortgage interest
- −$11,763
- − Property taxes
- −$4,801
- − Insurance
- −$1,050
- − Repairs & maintenance
- −$1,777
- − Management
- −$1,777
- − Depreciation
- −$6,109
- Taxable loss
- −$5,065
- Est. tax savings @ 24.0%
- +$1,216
- After-tax cash flow
- $-303/yr
For passive investors: Depreciation is non-cash, so a rental often shows a tax loss while cash-flowing — sheltering income. Rental losses are passive: they offset passive income freely, and up to $25,000/yr can offset ordinary (W-2) income if you actively participate and your MAGI is under $100k (phasing out to $0 by $150k); unused losses carry forward. On sale, claimed depreciation is recaptured at up to 25%, and gains may owe capital-gains tax (a 1031 exchange can defer both). Figures are a year-1 estimate at your 24.0% rate — not tax advice; consult a CPA.
Schools (NCES district)
- District
- Upper Darby SD
- NCES district ID
- 4224320
- Math proficiency
- 18% ▼ -8.00%
- Reading proficiency
- 36% ▼ -10.00%
- Median HH income
- $50,341
- Composite
- 23.68/100
- National rank
- #7837
- State rank
- #453 of 539 in PA
Livability — Upper Darby
No livability data for this city. (Only ~50 U.S. cities are tracked.)
Census & demographics
- County
- Delaware County · 399,863 people
- City population
- 41,541
- Metro
- Philadelphia-Camden-Wilmington, PA-NJ-DE-MD
- Population (ZIP)
- 29,373
- Household income
- $60,859
- Rent vs Own
- Severe rent burden
- 1738.0
Population outlook (Delaware County) Hauer SSP2
- Today (2025)
- 577,490 people
- By 2030
- 581,243 · +0.6%
- By 2040
- 584,700 · +1.2%
- By 2050
- 586,581 · +1.6%
- By 2075
- 598,706 · +3.7%
- By 2100
- 590,823 · +2.3%
Race, ethnicity, and origin ACS 2023
- Neighborhood character
- Predominantly Black (67%)
- Race & ethnicity
- Black 67% White 22% Two or more races 5% Hispanic / Latino 5% Asian 2%
- Common ancestry
- Swiss 4% Hispanic 3% Lithuanian 1%
- Foreign-born
- 17% · Canada, United Kingdom, Vietnam
- Languages at home
- 84% English-only · French/Haitian/Cajun 5% Spanish 3% Other Indo-European 1%
Political lean MEDSL · Delaware
- 2024 margin
- Strong D (+23.7) · D 61.4% · R 37.6% · Other 1.0%
- 2008→2024 swing
- +2.3pp toward D · 2008: 21.4pp · 2024: 23.7pp
- All cycles
- 2024: D+23.7 2020: D+26.7 2016: D+22.0 2012: D+21.8 2008: D+21.4
Not yet ingested
- Civics
- —
Market trends
- HPI YoY
- ▼ -202.83%
- Current HPI
- 287.6419
- Rent YoY
- ▲ 8.87%
- Metro
- Philadelphia-Camden-Wilmington, PA-NJ-DE-MD
- State GDP YoY
- ▲ 1.68%
- F500 in state
- 34
Industry mix (Fortune 500 HQ in PA)
| Industry | F500 HQs | Revenue |
|---|---|---|
| Healthcare | 2 | $309B |
|
||
| Insurance | 2 | $27B |
|
||
| Telecommunications / Media | 1 | $124B |
|
||
| Industrial Distribution | 1 | $22B |
|
||
| Financial Services | 1 | $20B |
|
||
| Chemicals / Materials | 1 | $18B |
|
||
Price history
+281.8% since first listed10 events — show timeline
- 2026-03-17 Relisted — BRIGHT MLS
- 2026-03-05 Listing Removed — BRIGHT MLS
- 2025-10-11 Price Changed $210,000 BRIGHT MLS
- 2025-10-11 Relisted — BRIGHT MLS
- 2025-06-24 Pending — BRIGHT MLS
- 2025-06-17 Relisted — BRIGHT MLS
- 2024-10-24 Pending — BRIGHT MLS
- 2024-09-05 Listed $195,000 BRIGHT MLS
- 2006-06-21 Sold (Public Records) $135,000 Public Records
- 1987-01-09 Sold (Public Records) $55,000 Public Records
Property tax history
+2.9%/yrLatest (2026): $4,801 · +7.7% YoY. Source: county tax records.
Cash-flow waterfall
monthlySold comps — $/sqft
last 12 mo · ≤1 miLoading sold comps…