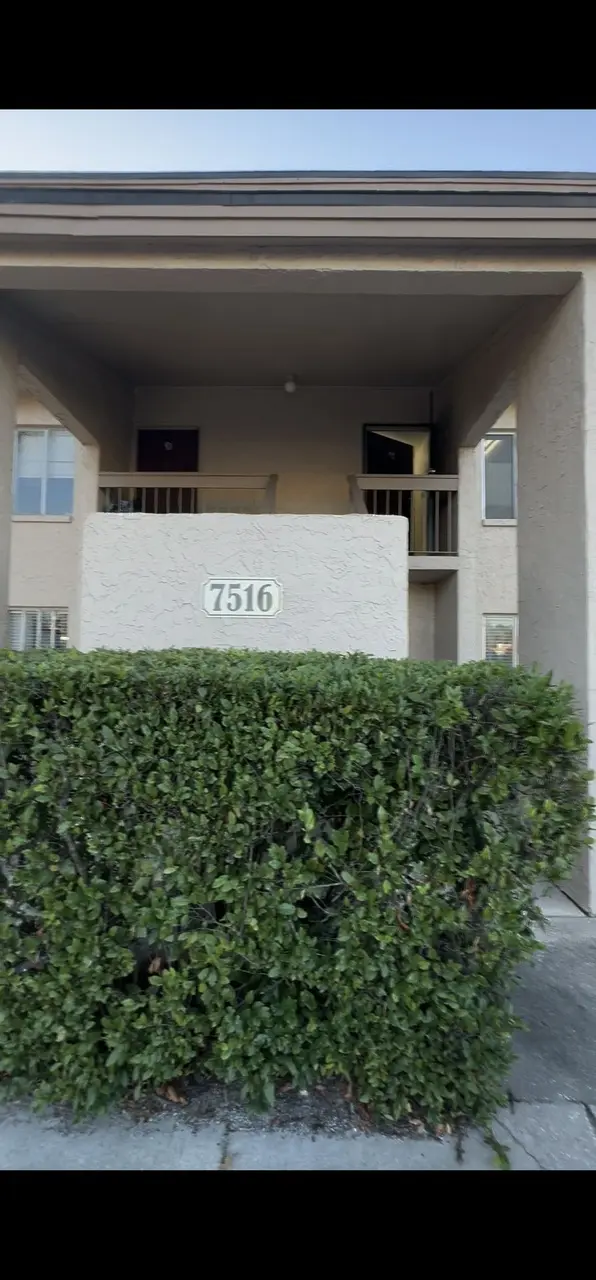
7516 Needle Leaf Pl · East Lake-Orient Park, FL
Flood risk 1/10 · Minimal
- FEMA flood zone
- X (unshaded)
- Chance of flooding over 30 yrs
- 0.0%
- Est. flood insurance / yr
- $507 – $1,088
Fire risk 1/10 · Minimal
- Est. fire insurance / yr
- $947 – $1,759
Heat risk 10/10 · Severe
- Hot days now (above 109°F)
- 7 days/yr
- Hot days in 30 yrs
- 26 days/yr
Wind risk 9/10 · Severe
- Chance of severe wind over 30 yrs
- 99.0%
Air-quality risk 3/10 · Minor
- Unhealthy air days now
- 3 days/yr
- Unhealthy air days in 30 yrs
- 4 days/yr
Risk factors via First Street. Map © Google.
Why this score? — see what drove the D- grade
The composite is a weighted blend of 9 inputs, each scored 0–100. Each bar is that input's sub-score; the figure is the points it added to the 100-point composite (weight × sub-score).
- 1% rule +7.6/10.0
- ARV discount +7.5/15.0
- Cash flow +6.9/30.0
- Schools +4.2/10.0
- Condition / age +3.8/5.0
- Livability +2.5/5.0
- Rent growth +2.4/5.0
- DSCR +1.1/10.0
- Appreciation +0.0/10.0
$124,999
🖨 Deal sheet 📄 Offer letter ✓ Due diligence
Listing remarks MLS
For Sale By Owner Turnkey Investment Condo Near USF & Downtown Tampa Well-maintained condo For Sale By Owner, currently tenant-occupied and generating $1,650/month in rental income. The current lease runs through June 2026, with tenants interested in extending, making this an excellent income-producing property. The unit features a 3-year-old A/C system and 3-year-old water heater, offering low maintenance and reliability. The second floor was remodeled last year with updated flooring, and the condo is fully updated and needs nothing. HOA fee: $570/month, which includes: Water Trash Roof All exterior maintenance Prime location: 10 minutes to USF 10 minutes to Busch Gardens 1518 minutes to Downtown Tampa Close to shopping, dining, and major highways Ideal for investors or future owner-occupants looking for a solid property in a high-demand rental area. I also have video for the The whole unit if you interested it I can send it to you.
Key facts
- Tenant occupied
- Fully updated
- Remodeled last year
Tags
Neighborhood map
What this means for you Summary
Snapshot
- This is a 2-bed/1.5-bath condo listed at $125k. Condition is rated good.
Deal economics
- At list price, monthly cash flow is $-191 ($-2k/yr) — negative.
- The deal already cash-flows at list — no discount required.
- Meets the 1% rule at list price ($2k rent vs $125k).
- Recommended offer: $110k (12.0% below list) — sets the bar for market timing.
Location & tenants
- Location reads: area grade D — affects rentability + tenant quality, not the cash-flow math above.
- Hillsborough (suburban): math 47% / reading 50% proficiency, ranked #41 of 73 in FL (top 56%) — families likely to look elsewhere, expect single-tenant / working-renter base with shorter leases.
- Market conditions: Rents soft (-0.3%/yr); 282 active listings in the ZIP; 40 comparable units currently listed for rent nearby; rentals at typical pace (median 15d on market — plan ~3-4 weeks tenant-placement turnaround); 9,053 units permitted in Hillsborough County in 2024 (4,555 in 5+ unit buildings).
- This rent runs 37% of the median local income ($51k/yr) — at the standard rent-burdened threshold; future hikes will face affordability resistance.
Forward outlook
- Local home prices are declining (-3.0%/yr); year-one equity from $864 of loan paydown is wiped out by about $4k of value loss. Plan a longer hold.
- Hillsborough County population projected at +37% by 2050 — long-run rental-demand tailwind backs the buy-and-hold thesis.
Negotiation context
- It's been on market 168 days — a 12% lower offer ($110k) is reasonable based on typical stale-listing flexibility.
Risks & watch-outs
- Watch-outs: HOA is 36% of rent.
- Climate carrying-cost: severe wind risk, 99% chance of damaging wind over 30y; extreme-heat days projected 7→26/yr by 2055 (HVAC capex compounding) — expect insurance premiums to compound above CPI over the hold.
Questions for the listing agent
- What do current leases actually rent for vs. the listed asking? Can we see a recent rent roll and the last 12 months of T-12 income?
- It's been on market 168 days. Have you received any prior offers? Is the seller open to a 12% concession, seller financing, or rate buy-down credit?
- What does the HOA fee cover, when was the last increase, and are there any pending special assessments or reserve-fund shortfalls?
- Any open or pending special assessments — roof, HVAC, plumbing, elevator, façade? What's the per-unit balance and payoff schedule, and is the seller paying it off at close or rolling it to the buyer?
- Why hasn't it sold? Are there any deal-killer items the seller is aware of (foundation, flood, title, zoning, code violations)?
- Is there a deadline driving the sale (1031 exchange, divorce, estate, relocation)? That informs how much negotiation room exists.
- The area grade is low — what's the realistic commute time and amenity access for the typical tenant pool here? Any planned neighborhood developments (good or bad) we should know about?
- What's the average days-on-market for RENTAL listings here right now (not sales)? A rising rental-DOM trend means longer vacancies and softer asking-rent achievability than the comps imply.
- What's the recent tenant-quality profile in this submarket — average credit score on applications, eviction rate, late-payment / NSF rate, and stable-employment percentage? A property-management company in the area should have these aggregated.
- How much new apartment / multifamily construction is in the pipeline within 1–3 miles? Heavy new supply (>2% of stock underway) typically softens rents 12–24 months out; light construction supports rent growth.
Investment metrics
- 1% rule
- 1.26% ✓
- Cap rate
- 4.46%
- Cash-on-cash
- -6.56%
- DSCR
- 0.71
- GRM
- 6.6
CMA / ARV
No comps found within radius.
Projected returns pro-forma
-3.0% appreciation · 0.0% rent growth · sell at horizon
- IRR
- -33.6%
- Equity multiple
- -0.05×
- Total profit
- $-36,672
- Equity at exit
- $18,638
- IRR
- -86.6%
- Equity multiple
- -0.83×
- Total profit
- $-63,897
- Equity at exit
- $10,808
Cash invested: $35,000 (down + closing). Projections, not guarantees.
Landlord ↔ Tenant lean methodology
- Overall (STATE)
- 87 Strongly Landlord-Friendly
- State Florida
- 87 Strongly Landlord-Friendly · R+3
- County
- — inherits STATE
- City
- — inherits STATE
ZIP-level market 33617
- Rents YoY
- -0.3%
- Active inventory
- 282
- Price-to-rent
- 6.6×
Monthly cashflow live
- Estimated rent
- $1,570 high interval (Pro) →
- Mortgage (P&I)
- −$656
- Tax est. 1.5%
- −$156 /mo · $1,875/yr
- Insurance
- −$52
- HOA est. from 1 same-building comp
- −$568
- Vacancy / Maint / Mgmt
- −$330
- Net cashflow
- $-191
Break-even live
UW: 25.0% down · 7.5% · 30yr · 1.5% tax · 5.0% vac · 8.0% maint · 8.0% mgmt
Financing live
Cash to close
- Down payment
- $31,250
- Closing costs
- $3,750
- Reserves months
- —
- Total cash needed
- —
Loan-product check · same deal, 3 products live
Conventional
25% down · 7.5% · 30yr
- Down + closing
- —
- Monthly P&I
- —
- Monthly cashflow
- —
- DSCR
- —
- Eligible?
- —
Personal DTI + credit; lowest rate.
DSCR
20% down · 8.5% · 30yr
- Down + closing
- —
- Monthly P&I
- —
- Monthly cashflow
- —
- DSCR
- —
- Eligible?
- —
No personal income docs; deal must DSCR.
Hard money
10% down · 12.0% · 12mo
- Down + closing
- —
- Monthly P&I
- —
- Monthly cashflow
- —
- DSCR
- —
- Eligible?
- —
Short-term bridge; refi at stabilization.
Rent comps 40 comps
| Address | Beds | Baths | Sqft | Rent | $/sqft | DOM | Units | Dist |
|---|---|---|---|---|---|---|---|---|
| 7516 Needle Leaf Pl #44 Tampa, FL | 2.0 | 1.5 | 1074 | $1,600 | $1.49 | 24d | 1 | 0.03mi |
| 7606 Abbey Ln #208 Tampa, FL | 2.0 | 1.5 | 936 | $1,500 | $1.60 | 24d | 1 | 0.05mi |
| 7607 Abbey Ln Tampa, FL | 2.0 | 1.5 | 1400 | $1,500 | $1.07 | 24d | 1 | 0.05mi |
| 5508 Pokeweed Ct #146 Tampa, FL | 1.0 | 1.0 | 783 | $1,350 | $1.72 | 13d | 1 | 0.06mi |
| 7510 Presley Pl Unit 98-A Tampa, FL | 1.0 | 1.0 | 783 | $1,300 | $1.66 | 3d | 1 | 0.06mi |
| 7506 Needle Leaf Pl #56 Tampa, FL | 1.0 | 1.0 | 747 | $1,400 | $1.87 | 10d | 1 | 0.07mi |
| 7506 Presley Pl Tampa, FL | 2.0 | 2.0 | 975 | $1,300 | $1.33 | 24d | 1 | 0.08mi |
| 7505 Pitch Pine Cir #122 Tampa, FL | 2.0 | 1.5 | 1074 | $1,600 | $1.49 | 24d | 1 | 0.10mi |
| 5659 Del Prado Dr Tampa, FL | 1.0–3.0 | 1.0–2.0 | 1229 | $1,550 | $1.26 | 2d | 6 | 0.15mi |
| 7011 San Ramon Pl Tampa, FL | 2.0 | 1.0–2.0 | 1050 | $1,475 | $1.40 | 14d | 5 | 0.24mi |
| 7107 N 53rd St Unit B Tampa, FL | 1.0 | 1.0 | 850 | $1,500 | $1.76 | 24d | 1 | 0.24mi |
| 6919 Bonair Dr Tampa, FL | 1.0–2.0 | 1.0–2.0 | 819 | $1,350 | $1.65 | 17d | 10 | 0.38mi |
| 7113 N 50th St Tampa, FL | 3.0 | 2.0 | 1338 | $2,050 | $1.53 | 20d | 1 | 0.49mi |
| 5003 Puritan Rd Tampa, FL | 3.0 | 2.0 | 1469 | $2,000 | $1.36 | 5d | 1 | 0.49mi |
| 7134 N 50th St Tampa, FL | 3.0 | 1.0 | 915 | $1,650 | $1.80 | 24d | 1 | 0.50mi |
| 5013 E Sligh Ave Tampa, FL | 2.0 | 1.0–1.5 | 939 | $1,412 | $1.50 | 2d | 8 | 0.63mi |
| 5125 Puritan Cir #1103 Tampa, FL | 2.0 | 2.0 | 1191 | $1,850 | $1.55 | 10d | 1 | 0.65mi |
| 8412 Rio Bravo Ct Tampa, FL | 1.0–3.0 | 1.0–2.5 | 1014 | $1,384 | $1.36 | 24d | 1 | 0.72mi |
| 5008 Sierra Pl Tampa, FL | 3.0 | 2.0 | 1461 | $2,161 | $1.48 | 15d | 1 | 0.78mi |
| 5008 Sierra Pl Tampa, FL | 2.0 | 2.0 | 1122 | $1,615 | $1.44 | 20d | 1 | 0.78mi |
| 5008 Sierra Pl Tampa, FL | 1.0 | 1.0 | 827 | $1,510 | $1.83 | 22d | 1 | 0.78mi |
| 4991 Puritan Cir #522 Tampa, FL | 2.0 | 2.0 | 906 | $1,599 | $1.76 | 24d | 1 | 0.79mi |
| 4418 Porpoise Dr Tampa, FL | 3.0 | 2.0 | 975 | $2,100 | $2.15 | 12d | 1 | 0.82mi |
| 8501 N 50th St Tampa, FL | 1.0–2.0 | 1.0–2.0 | 730 | $1,710 | $2.34 | 24d | 1 | 0.88mi |
| 6502 E Sligh Ave Tampa, FL | 1.0–3.0 | 1.0–2.0 | 1002 | $2,132 | $2.13 | 5d | 25 | 0.93mi |
| 8740 Grove Ter Tampa, FL | 2.0 | 1.0–2.0 | 1125 | $1,350 | $1.20 | 24d | 10 | 0.97mi |
| 8901 Bertha Palmer Blvd Tampa, FL | 1.0–3.0 | 1.0–2.0 | 973 | $2,062 | $2.12 | 3d | 16 | 0.97mi |
| 4122 Waterside Island Ct Tampa, FL | 3.0 | 2.5 | 1364 | $1,800 | $1.32 | 24d | 1 | 1.01mi |
| 4119 Gradstone Pl Tampa, FL | 3.0 | 2.0 | 1364 | $1,650 | $1.21 | 14d | 1 | 1.03mi |
| 4105 Waterside Island Ct Tampa, FL | 3.0 | 2.5 | 1364 | $2,195 | $1.61 | 24d | 1 | 1.03mi |
| 4105 Waterside Island Ct Tampa, FL | 3.0 | 2.5 | 1364 | $1,995 | $1.46 | 5d | 1 | 1.03mi |
| 4113 Gradstone Pl Tampa, FL | 3.0 | 2.5 | 1364 | $1,590 | $1.17 | 15d | 1 | 1.04mi |
| 8731 N 50th St Unit A Tampa, FL | 2.0 | 1.0 | 812 | $1,675 | $2.06 | 15d | 1 | 1.05mi |
| 8731 N 50th St Unit H Tampa, FL | 2.0 | 1.5 | 1060 | $1,775 | $1.67 | 15d | 1 | 1.05mi |
| 8731 N 50th St Tampa, FL | 2.0 | 1.0 | 812 | $1,675 | $2.06 | 17d | 1 | 1.05mi |
| 8731 N 50th St Tampa, FL | 2.0 | 1.5 | 1060 | $1,695 | $1.60 | 14d | 1 | 1.05mi |
| 8731 N 50th St Tampa, FL | 2.0 | 1.0–1.5 | 936 | $1,648 | $1.76 | 3d | 2 | 1.05mi |
| 8729 N 50th St Unit A Tampa, FL | 2.0 | 1.0 | 812 | $1,600 | $1.97 | 14d | 1 | 1.05mi |
| 8729 N 50th St Unit H Tampa, FL | 2.0 | 1.5 | 1060 | $1,695 | $1.60 | 14d | 1 | 1.05mi |
| 7402 E Bank Dr #7402 Tampa, FL | 3.0 | 2.5 | 1364 | $2,800 | $2.05 | 24d | 1 | 1.06mi |
HOA detail condo
- Monthly dues
- $0 · $0/yr
- Likely covers
- watertrashexterior maint.
- Assessments
- None detected in remarks — confirm with the listing agent.
Listing history 16 events
-
2026-06-18days on market $124,999 Active 168 DOM
-
2026-06-17days on market $124,999 Active 167 DOM
-
2026-06-16days on market $124,999 Active 166 DOM
-
2026-06-15days on market $124,999 Active 165 DOM
-
2026-06-13days on market $124,999 Active 163 DOM
-
2026-06-13days on market $124,999 Active 162 DOM
-
2026-06-09days on market $124,999 Active 159 DOM
-
2026-06-08days on market $124,999 Active 158 DOM
-
2026-06-07days on market $124,999 Active 157 DOM
-
2026-06-04pricedays on market $124,999 Active 154 DOM
-
2026-06-03days on market $134,999 Active 153 DOM
-
2026-06-02days on market $134,999 Active 152 DOM
-
2026-06-01days on market $134,999 Active 151 DOM
-
2026-05-31days on market $134,999 Active 150 DOM
-
2026-01-07price $134,999 954-char remark
Show marketing remark (954 chars)
For Sale By Owner Turnkey Investment Condo Near USF & Downtown Tampa Well-maintained condo For Sale By Owner, currently tenant-occupied and generating $1,650/month in rental income. The current lease runs through June 2026, with tenants interested in extending, making this an excellent income-producing property. The unit features a 3-year-old A/C system and 3-year-old water heater, offering low maintenance and reliability. The second floor was remodeled last year with updated flooring, and the condo is fully updated and needs nothing. HOA fee: $570/month, which includes: Water Trash Roof All exterior maintenance Prime location: 10 minutes to USF 10 minutes to Busch Gardens 1518 minutes to Downtown Tampa Close to shopping, dining, and major highways Ideal for investors or future owner-occupants looking for a solid property in a high-demand rental area. I also have video for the The whole unit if you interested it I can send it to you.
-
2026-01-01$139,999 Active 954-char remark
Show marketing remark (954 chars)
For Sale By Owner Turnkey Investment Condo Near USF & Downtown Tampa Well-maintained condo For Sale By Owner, currently tenant-occupied and generating $1,650/month in rental income. The current lease runs through June 2026, with tenants interested in extending, making this an excellent income-producing property. The unit features a 3-year-old A/C system and 3-year-old water heater, offering low maintenance and reliability. The second floor was remodeled last year with updated flooring, and the condo is fully updated and needs nothing. HOA fee: $570/month, which includes: Water Trash Roof All exterior maintenance Prime location: 10 minutes to USF 10 minutes to Busch Gardens 1518 minutes to Downtown Tampa Close to shopping, dining, and major highways Ideal for investors or future owner-occupants looking for a solid property in a high-demand rental area. I also have video for the The whole unit if you interested it I can send it to you.
ⓘ Source: listings_history table (triggers on properties + properties_extension) + one-shot
backfill from property_details.listing_events for pre-trigger history.
Climate risk First Street
- Flood 1/10 Low FEMA zone X (unshaded) · 0% chance over 30 yrs
- Wildfire 1/10 Low
- Heat 10/10 Extreme 7 d/yr ≥109°F today · 26 d/yr by 30 yrs out
- Wind 9/10 Extreme 99% chance of damaging wind over 30 yrs
- Air quality 3/10 Moderate 3 unhealthy d/yr today · 4 by 30 yrs out
Nearby sold comps map
Loading sold comps map…
Walkable amenities ~0.75 mi
Loading nearby amenities…
Taxation est. · year 1
- Rental income
- $18,843
- − Mortgage interest
- −$7,002
- − Property taxes
- −$1,875
- − Insurance
- −$625
- − Repairs & maintenance
- −$1,507
- − Management
- −$1,507
- − HOA
- −$6,816
- − Depreciation
- −$3,636
- Taxable loss
- −$4,126
- Est. tax savings @ 24.0%
- +$990
- After-tax cash flow
- $-1,306/yr
For passive investors: Depreciation is non-cash, so a rental often shows a tax loss while cash-flowing — sheltering income. Rental losses are passive: they offset passive income freely, and up to $25,000/yr can offset ordinary (W-2) income if you actively participate and your MAGI is under $100k (phasing out to $0 by $150k); unused losses carry forward. On sale, claimed depreciation is recaptured at up to 25%, and gains may owe capital-gains tax (a 1031 exchange can defer both). Figures are a year-1 estimate at your 24.0% rate — not tax advice; consult a CPA.
Condition & rehab AI · 12 photos
This well-maintained and updated condo is in good condition with minimal repairs needed. It's an excellent income-producing property with a prime location.
Value-add opportunities
- Both Paint exterior siding — Enhances curb appeal and property value.
- Both Clean gutters — Improves drainage and property value.
- Both Replace light fixtures — Modernizes the space and enhances curb appeal.
- Both Replace outdated flooring — Modernizes the space and enhances curb appeal.
Renovation cost estimate screening
Value-add ROI direction
- Both Paint exterior siding — Enhances curb appeal and property value. ↑
- Both Clean gutters — Improves drainage and property value. ↑
- Both Replace light fixtures — Modernizes the space and enhances curb appeal. ↑
- Both Replace outdated flooring — Modernizes the space and enhances curb appeal. ↑
ⓘ Cost ranges are severity-bucket heuristics (US national rule-of-thumb). Get contractor quotes + a written scope before underwriting a rehab budget.
Schools (NCES district)
- District
- Hillsborough
- NCES district ID
- 1200870
- Math proficiency
- 47% ▼ -8.00%
- Reading proficiency
- 50% ▼ -4.00%
- Median HH income
- $50,622
- Composite
- 41.6/100
- National rank
- #3435
- State rank
- #41 of 73 in FL
Livability — East Lake-Orient Park
No livability data for this city. (Only ~50 U.S. cities are tracked.)
Census & demographics
- Census place
- East Lake-Orient Park, FL
- County
- Hillsborough County · 1,540,968 people
- City population
- 45,396
- Metro
- Tampa-St. Petersburg-Clearwater, FL
- Population (ZIP)
- 47,851
- Household income
- $50,948
- Rent vs Own
- Severe rent burden
- 3295.0
Population outlook (Hillsborough County) Hauer SSP2
- Today (2025)
- 1,607,022 people
- By 2030
- 1,733,968 · +7.9%
- By 2040
- 1,979,565 · +23.2%
- By 2050
- 2,203,427 · +37.1%
- By 2075
- 2,667,893 · +66.0%
- By 2100
- 2,891,558 · +79.9%
Race, ethnicity, and origin ACS 2023
- Neighborhood character
- Highly diverse neighborhood (Simpson 0.71)
- Race & ethnicity
- Black 36% White 33% Hispanic / Latino 23% Two or more races 14% Asian 5%
- Hispanic origin (detail)
- Mexican 2% Puerto Rican 7% Cuban 4% Dominican 2%
- Common ancestry
- Hispanic 3% Lithuanian 1% Romanian 1%
- Foreign-born
- 17% · Canada, Vietnam, Jamaica
- Languages at home
- 74% English-only · Spanish 15% Arabic 3% French/Haitian/Cajun 3%
Political lean MEDSL · Hillsborough
- 2024 margin
- Toss-up / Even · D 47.8% · R 50.9% · Other 1.3%
- 2008→2024 swing
- -10.2pp toward R · 2008: 7.1pp · 2024: -3.1pp
- All cycles
- 2024: R+3.1 2020: D+6.9 2016: D+6.8 2012: D+6.7 2008: D+7.1
Not yet ingested
- Civics
- —
Market trends
- HPI YoY
- ▼ -243.20%
- Current HPI
- 352.4572
- Rent YoY
- ▼ -0.33%
- Metro
- Tampa-St. Petersburg-Clearwater, FL
- State GDP YoY
- ▲ 3.28%
- F500 in state
- 36
Industry mix (Fortune 500 HQ in FL)
| Industry | F500 HQs | Revenue |
|---|---|---|
| Industrial Technology | 2 | $29B |
|
||
| Insurance | 2 | $17B |
|
||
| Retail | 1 | $60B |
|
||
| Technology Distribution | 1 | $58B |
|
||
| Homebuilding | 1 | $35B |
|
||
| Technology Manufacturing | 1 | $35B |
|
||
Price history
-3.6% since first listed2 events — show timeline
- 2026-01-07 Price Changed $134,999 ForSaleByOwner.com
- 2026-01-01 Listed $139,999 ForSaleByOwner.com
Cash-flow waterfall
monthlySold comps — $/sqft
last 12 mo · ≤1 miLoading sold comps…