507 131st St E Unit L · Parkland, WA
Flood risk 4/10 · Minor
- FEMA flood zone
- X (unshaded)
- Chance of flooding over 30 yrs
- 0.22%
- Est. flood insurance / yr
- $507 – $1,088
Fire risk 1/10 · Minimal
- Est. fire insurance / yr
- $604 – $1,122
Heat risk 3/10 · Minor
- Hot days now (above 87°F)
- 7 days/yr
- Hot days in 30 yrs
- 14 days/yr
Wind risk 1/10 · Minimal
- Chance of severe wind over 30 yrs
- —
Air-quality risk 7/10 · Major
- Unhealthy air days now
- 9 days/yr
- Unhealthy air days in 30 yrs
- 10 days/yr
Risk factors via First Street. Map © Google.
Why this score? — see what drove the B- grade
The composite is a weighted blend of 9 inputs, each scored 0–100. Each bar is that input's sub-score; the figure is the points it added to the 100-point composite (weight × sub-score).
- Cash flow +28.3/30.0
- DSCR +10.0/10.0
- 1% rule +7.8/10.0
- ARV discount +7.5/15.0
- Schools +3.9/10.0
- Livability +3.9/5.0
- Rent growth +3.0/5.0
- Condition / age +2.5/5.0
- Appreciation +0.0/10.0
$114,999
🖨 Deal sheet 📄 Offer letter ✓ Due diligence
Listing remarks
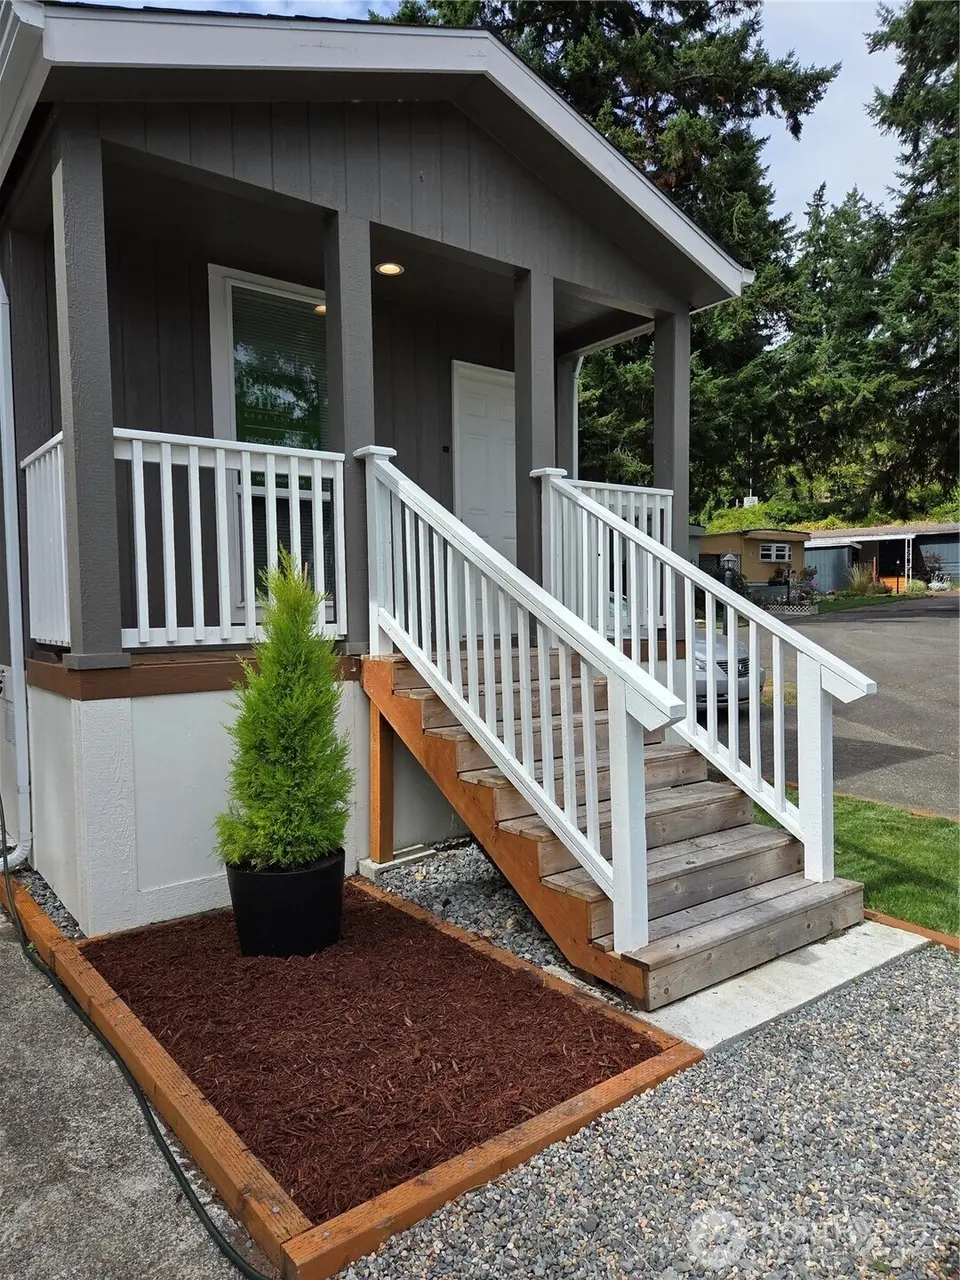
Welcome to Parkland Mobile Village, a well-maintained 55+ community offering affordable, low-maintenance living in a convenient location. This brand-new 2024 Clayton home is move-in ready and thoughtfully designed with 2 bedrooms, 1 bath, a bright open-concept living area, and modern finishes throughout. Large windows fill the home with natural light, creating a warm and inviting atmosphere from the moment you step inside. Enjoy the peace of mind that comes with owning a new home, complete with energy-efficient construction and contemporary styling. The covered front porch provides the perfect spot to relax with your morning coffee or unwind at the end of the day. Conveniently located near
Key facts
- Covered front porch
- Convenient location
- Move in ready
Tags
Neighborhood map
What this means for you Summary
Snapshot
- This is a 2-bed/1.0-bath manufactured listed at $115k.
Deal economics
- At list price, monthly cash flow is $367 ($4k/yr) — positive.
- The deal already cash-flows at list — no discount required.
- Meets the 1% rule at list price ($1k rent vs $115k).
- Cap rate 10.1% vs local median 2.3% in Parkland — top-decile yield for the area; either an underpriced asset or a hidden risk that comps aren't pricing in. Stress-test before assuming the spread holds.
Location & tenants
- Location reads 77/100 on livability (#148 in WA, #3,068 nationally) — a middle-class / working-renter tenant base. Strengths: commute A+, housing A+, health & safety A+; Watch: amenities D+, crime F.
- Franklin Pierce School District (suburban): math 35% / reading 51% proficiency, ranked #197 of 291 in WA (top 68%) — families likely to look elsewhere, expect single-tenant / working-renter base with shorter leases.
- Market conditions: Rents rising (+2.0%/yr); 234 active listings in the ZIP; 25 comparable units currently listed for rent nearby; rentals at typical pace (median 24d on market — plan ~3-4 weeks tenant-placement turnaround); 48% of comp listings sitting > 30 days — soft ceiling on asking rent; solid renter incomes; 3,209 units permitted in Pierce County in 2024 (1,269 in 5+ unit buildings).
Forward outlook
- Local home prices are declining (-3.0%/yr); year-one equity from $795 of loan paydown is wiped out by about $3k of value loss. Plan a longer hold.
- Pierce County population projected at +26% by 2050 — long-run rental-demand tailwind backs the buy-and-hold thesis.
- At projected returns (-3.0% appreciation + 2.0% rent growth), your $32k cash investment doubles in ~10 years — after that, you're playing with house money.
Negotiation context
- Only 10 days on market — expect competitive offers; lowballing is unlikely to land.
- 3 sale attempts since 2y ago; this cycle's ask has dropped $25k (18%) from the opening price — seller is motivated, your offer sets the floor, not the list.
Questions for the listing agent
- Is there a deadline driving the sale (1031 exchange, divorce, estate, relocation)? That informs how much negotiation room exists.
- Schools are B-rated — typically a magnet for longer-tenancy family renters. What's the average tenant stay here, and is there a school-zone premium baked into asking?
- Crime grade is F in this area — have there been break-ins, vandalism, or insurance claims at this property in the last 3 years? What carrier currently insures it and at what premium?
- What's the average days-on-market for RENTAL listings here right now (not sales)? A rising rental-DOM trend means longer vacancies and softer asking-rent achievability than the comps imply.
- What's the recent tenant-quality profile in this submarket — average credit score on applications, eviction rate, late-payment / NSF rate, and stable-employment percentage? A property-management company in the area should have these aggregated.
- How much new for-sale + rental construction is in the pipeline within 1–3 miles? Heavy new supply typically softens prices + rents 12–24 months out; constrained supply supports both.
Investment metrics
- 1% rule
- 1.28% ✓
- Cap rate
- 10.13%
- Cash-on-cash
- 13.69%
- DSCR
- 1.61
- GRM
- 6.5
CMA / ARV
- ARV (median comp)
- $57,490
- List price
- $114,999
- Delta
- 115.67%
- Verdict
- OVERPRICED
- Comps
- 15 within 1.0 mi
Projected returns pro-forma
-3.0% appreciation · 2.05% rent growth · sell at horizon
- IRR
- 2.8%
- Equity multiple
- 1.11×
- Total profit
- $3,385
- Equity at exit
- $17,147
- IRR
- 11.4%
- Equity multiple
- 1.86×
- Total profit
- $27,549
- Equity at exit
- $9,943
Cash invested: $32,200 (down + closing). Projections, not guarantees.
Landlord ↔ Tenant lean methodology
- Overall (STATE)
- 28 Tenant-Leaning
- State Washington
- 28 Tenant-Leaning · D+8
- County
- — inherits STATE
- City
- — inherits STATE
ZIP-level market 98445
- Rents YoY
- 2.0%
- Active inventory
- 234
- Price-to-rent
- 6.5×
Monthly cashflow live
- Estimated rent
- $1,471 high interval (Pro) →
- Mortgage (P&I)
- −$603
- Tax est. 1.5%
- −$144 /mo · $1,725/yr
- Insurance
- −$48
- HOA
- −$0
- Vacancy / Maint / Mgmt
- −$309
- Net cashflow
- $367
Break-even live
UW: 25.0% down · 7.5% · 30yr · 1.5% tax · 5.0% vac · 8.0% maint · 8.0% mgmt
Financing live
Cash to close
- Down payment
- $28,750
- Closing costs
- $3,450
- Reserves months
- —
- Total cash needed
- —
Loan-product check · same deal, 3 products live
Conventional
25% down · 7.5% · 30yr
- Down + closing
- —
- Monthly P&I
- —
- Monthly cashflow
- —
- DSCR
- —
- Eligible?
- —
Personal DTI + credit; lowest rate.
DSCR
20% down · 8.5% · 30yr
- Down + closing
- —
- Monthly P&I
- —
- Monthly cashflow
- —
- DSCR
- —
- Eligible?
- —
No personal income docs; deal must DSCR.
Hard money
10% down · 12.0% · 12mo
- Down + closing
- —
- Monthly P&I
- —
- Monthly cashflow
- —
- DSCR
- —
- Eligible?
- —
Short-term bridge; refi at stabilization.
Rent comps 25 comps
| Address | Beds | Baths | Sqft | Rent | $/sqft | DOM | Units | Dist |
|---|---|---|---|---|---|---|---|---|
| 114 129th St S Tacoma, WA | 1.0 | 1.0 | 600 | $1,145 | $1.91 | 2d | 1 | 0.36mi |
| 204 128th St S Unit 208 Parkland, WA | 1.0 | 1.0 | 500 | $1,185 | $2.37 | 43d | 1 | 0.45mi |
| 208 128th St S Tacoma, WA | 1.0 | 1.0 | 500 | $1,185 | $2.37 | 43d | 1 | 0.45mi |
| 120 136th St S Unit B10 Tacoma, WA | 1.0 | 1.0 | 585 | $1,195 | $2.04 | 43d | 1 | 0.51mi |
| 120 136th St S Unit A9 Tacoma, WA | 2.0 | 1.0 | 730 | $1,395 | $1.91 | 24d | 1 | 0.54mi |
| 209 125th St S Tacoma, WA | 1.0–2.0 | 1.0 | 787 | $1,500 | $1.90 | 43d | 1 | 0.55mi |
| 12712 C St S Unit F Tacoma, WA | 1.0 | 1.0 | 600 | $1,250 | $2.08 | 14d | 1 | 0.57mi |
| 12712 C St S Unit Cc Tacoma, WA | 2.0 | 1.0 | 750 | $1,395 | $1.86 | 43d | 1 | 0.57mi |
| 315 125th St S Tacoma, WA | 1.0 | 1.0 | 520 | $1,175 | $2.26 | 43d | 1 | 0.61mi |
| 323 Garfield St S Tacoma, WA | 1.0 | 1.0 | 549 | $1,595 | $2.91 | 3d | 3 | 0.68mi |
| 706 128th St S Unit 708 Parkland, WA | 1.0 | 1.0 | 498 | $1,225 | $2.46 | 24d | 1 | 0.75mi |
| 14209 Pacific Ave S Tacoma, WA | 1.0 | 1.0 | 500 | $1,160 | $2.32 | 43d | 3 | 0.86mi |
| 14117 C St S Tacoma, WA | 2.0 | 1.0 | 750 | $1,545 | $2.06 | 43d | 1 | 0.87mi |
| 14207 C St S Unit A-22 Tacoma, WA | 1.0 | 1.0 | 650 | $1,099 | $1.69 | 43d | 1 | 0.90mi |
| 14402 2nd Ave E Tacoma, WA | 1.0 | 1.0 | 728 | $1,595 | $2.19 | 2d | 8 | 0.93mi |
| 14209 C St S Tacoma, WA | 1.0 | 1.0 | 650 | $1,260 | $1.94 | 43d | 1 | 0.95mi |
| 11302 10th Avenue Ct E Tacoma, WA | 3.0 | 1.0–2.0 | 869 | $2,037 | $2.34 | 4d | 16 | 1.01mi |
| 105 114th St E Unit 4 Tacoma, WA | 1.0 | 1.0 | 500 | $1,285 | $2.57 | 43d | 1 | 1.04mi |
| 909 136th Street Ct S Unit 5B-POU Parkland, WA | 1.0 | 1.0 | 400 | $1,275 | $3.19 | 1d | 1 | 1.08mi |
| 806 112th St E Parkland, WA | 1.0–2.0 | 1.0–2.0 | 800 | $1,500 | $1.88 | 43d | 1 | 1.14mi |
| 416 111th St Ct E Tacoma, WA | 1.0–3.0 | 1.0–2.0 | 925 | $2,038 | $2.20 | 1d | 52 | 1.17mi |
| 14701 C St S Tacoma, WA | 1.0–2.0 | 1.0 | 690 | $1,495 | $2.17 | 4d | 3 | 1.22mi |
| 1015 112th St E Tacoma, WA | 3.0 | 1.0–2.0 | 833 | $1,938 | $2.33 | 2d | 15 | 1.24mi |
| 10925 Park Ave S Tacoma, WA | 2.0 | 1.0 | 709 | $1,775 | $2.50 | 24d | 5 | 1.40mi |
| 10925 Park Ave S Tacoma, WA | 3.0 | 1.0–2.0 | 838 | $1,880 | $2.24 | 10d | 12 | 1.40mi |
Listing history 15 events
-
2026-06-18days on market $114,999 Active 10 DOM
-
2026-06-17days on market $114,999 Active 9 DOM
-
2026-06-16days on market $114,999 Active 8 DOM
-
2026-06-15days on market $114,999 Active 7 DOM
-
2026-06-13days on market $114,999 Active 5 DOM
-
2026-06-13days on market $114,999 Active 4 DOM
-
2026-06-08remarks 699-char remark
-
2026-06-08pricedays on market $114,999 Active 1 DOM
-
2026-04-20status Active
-
2025-10-21price $123,990
-
2025-10-15status Active
-
2025-07-14price $124,990
-
2025-06-03price $129,900
-
2025-04-22price $134,900
-
2024-10-17$139,900 Active
ⓘ Source: listings_history table (triggers on properties + properties_extension) + one-shot
backfill from property_details.listing_events for pre-trigger history.
Climate risk First Street
- Flood 4/10 Moderate FEMA zone X (unshaded) · 22% chance over 30 yrs
- Wildfire 1/10 Low
- Heat 3/10 Moderate 7 d/yr ≥87°F today · 14 d/yr by 30 yrs out
- Wind 1/10 Low
- Air quality 7/10 Severe 9 unhealthy d/yr today · 10 by 30 yrs out
Nearby sold comps map
Loading sold comps map…
Walkable amenities ~0.75 mi
Loading nearby amenities…
Taxation est. · year 1
- Rental income
- $17,650
- − Mortgage interest
- −$6,442
- − Property taxes
- −$1,725
- − Insurance
- −$575
- − Repairs & maintenance
- −$1,412
- − Management
- −$1,412
- − Depreciation
- −$3,345
- Taxable income
- $2,739
- Est. tax owed @ 24.0%
- −$657
- After-tax cash flow
- $3,750/yr
For passive investors: Depreciation is non-cash, so a rental often shows a tax loss while cash-flowing — sheltering income. Rental losses are passive: they offset passive income freely, and up to $25,000/yr can offset ordinary (W-2) income if you actively participate and your MAGI is under $100k (phasing out to $0 by $150k); unused losses carry forward. On sale, claimed depreciation is recaptured at up to 25%, and gains may owe capital-gains tax (a 1031 exchange can defer both). Figures are a year-1 estimate at your 24.0% rate — not tax advice; consult a CPA.
Schools (NCES district)
- District
- Franklin Pierce School District
- NCES district ID
- 5302940
- Math proficiency
- 35% ▬ 0.00%
- Reading proficiency
- 51% ▲ 2.00%
- Median HH income
- $49,240
- Composite
- 39.18/100
- National rank
- #8227
- State rank
- #197 of 291 in WA
Livability — Parkland
- Score
- 77/100
- State rank
- #148
- US rank
- #3068
Category grades
Schools grade is shown separately in the Schools card above.
Census & demographics
- Census place
- Parkland, WA
- County
- Pierce County · 788,257 people
- City population
- 36,624
- Metro
- Seattle-Tacoma-Bellevue, WA
- Population (ZIP)
- 33,684
- Household income
- $92,520
- Rent vs Own
- Severe rent burden
- 1085.0
Population outlook (Pierce County) Hauer SSP2
- Today (2025)
- 956,648 people
- By 2030
- 1,010,862 · +5.7%
- By 2040
- 1,113,170 · +16.4%
- By 2050
- 1,206,524 · +26.1%
- By 2075
- 1,436,425 · +50.2%
- By 2100
- 1,563,654 · +63.5%
Race, ethnicity, and origin ACS 2023
- Neighborhood character
- Diverse neighborhood (Simpson 0.69)
- Race & ethnicity
- White 53% Two or more races 17% Hispanic / Latino 14% Black 10% Asian 6% Native American 4% Pacific Islander 3%
- Hispanic origin (detail)
- Mexican 10%
- Common ancestry
- Portuguese 3% Lithuanian 2% Italian 2%
- Foreign-born
- 12% · Canada, South Korea, Vietnam
- Languages at home
- 81% English-only · Spanish 8% Other Asian/Pacific 3% Russian/Polish/Slavic 2%
Political lean MEDSL · Pierce
- 2024 margin
- D (+10.8) · D 53.9% · R 43.1% · Other 3.0%
- 2008→2024 swing
- -1.4pp toward R · 2008: 12.2pp · 2024: 10.8pp
- All cycles
- 2024: D+10.8 2020: D+11.2 2016: D+7.5 2012: D+11.0 2008: D+12.2
Not yet ingested
- Civics
- —
Market trends
- HPI YoY
- ▼ -471.23%
- Current HPI
- 316.202
- Rent YoY
- ▲ 2.05%
- Metro
- Seattle-Tacoma-Bellevue, WA
- State GDP YoY
- ▲ 4.65%
- F500 in state
- 22
Industry mix (Fortune 500 HQ in WA)
| Industry | F500 HQs | Revenue |
|---|---|---|
| Retail | 2 | $269B |
|
||
| Technology / Retail | 1 | $638B |
|
||
| Technology | 1 | $245B |
|
||
| Telecommunications | 1 | $38B |
|
||
| Food / Beverage | 1 | $36B |
|
||
| Automotive / Trucks | 1 | $34B |
|
||
Price history
-11.4% since first listed7 events — show timeline
- 2026-04-20 Relisted — NWMLS as Distributed by MLS Grid
- 2025-10-21 Price Changed $123,990 NWMLS as Distributed by MLS Grid
- 2025-10-15 Relisted — NWMLS as Distributed by MLS Grid
- 2025-07-14 Price Changed $124,990 NWMLS as Distributed by MLS Grid
- 2025-06-03 Price Changed $129,900 NWMLS as Distributed by MLS Grid
- 2025-04-22 Price Changed $134,900 NWMLS as Distributed by MLS Grid
- 2024-10-17 Listed $139,900 NWMLS as Distributed by MLS Grid
Property tax history
+4.4%/yrLatest (2023): $175 · +625.5% YoY. Source: county tax records.
Cash-flow waterfall
monthlySold comps — $/sqft
last 12 mo · ≤1 miLoading sold comps…