119 Payton Pl · Roxboro, NC
Flood risk 7/10 · Major
- FEMA flood zone
- X (unshaded)
- Chance of flooding over 30 yrs
- 0.78%
- Est. flood insurance / yr
- $507 – $1,088
Fire risk 1/10 · Minimal
- Est. fire insurance / yr
- $906 – $1,684
Heat risk 6/10 · Moderate
- Hot days now (above 103°F)
- 7 days/yr
- Hot days in 30 yrs
- 17 days/yr
Wind risk 5/10 · Moderate
- Chance of severe wind over 30 yrs
- 24.0%
Air-quality risk 2/10 · Minimal
- Unhealthy air days now
- 1 days/yr
- Unhealthy air days in 30 yrs
- 2 days/yr
Risk factors via First Street. Map © Google.
Why this score? — see what drove the D+ grade
The composite is a weighted blend of 9 inputs, each scored 0–100. Each bar is that input's sub-score; the figure is the points it added to the 100-point composite (weight × sub-score).
- ARV discount +11.9/15.0
- Cash flow +9.5/30.0
- Appreciation +8.5/10.0
- Schools +3.4/10.0
- 1% rule +2.9/10.0
- Livability +2.8/5.0
- DSCR +2.7/10.0
- Rent growth +2.5/5.0
- Condition / age +2.5/5.0
$228,990
🖨 Deal sheet (PDF) 📄 Offer letter ✓ Due diligence
Listing remarks
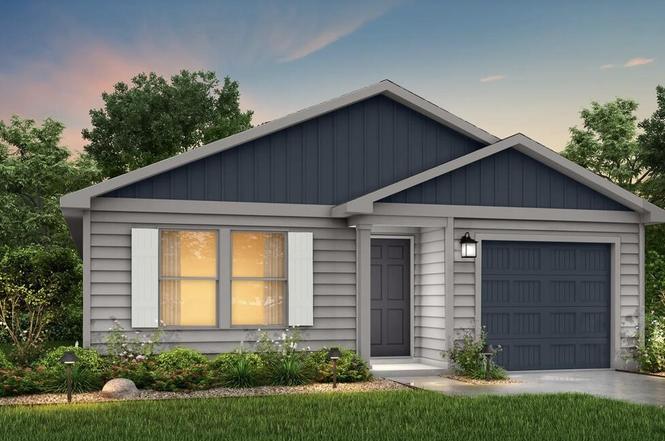
The Yellowstone Plan from our Freedom Series is thoughtfully designed for comfort and convenience, offering 4 bedrooms, 2 bathrooms, and 1,401 square feet of single-story living. As you enter the home, you'll find three secondary bedrooms and a full bathroom, perfectly positioned to provide privacy and flexibility for family members or guests. Continue down the hall, and you'll pass the conveniently located laundry room before reaching the heart of the home. The open-concept kitchen, complete with a central island, seamlessly overlooks the family room and dining area, creating a welcoming space for family time, meals, and entertaining. Tucked off the dining area, the primary suite features
Key facts
- Central island
- Open-concept kitchen
- Walk-in closet
Tags
Property features AI
Finance
- Other: Zoned R-8
- HOA & community: No association
Exterior
- Parking: Attached garage with 1 garage space
- Utilities: Public water; Public sewer; Electric service
- Home design: Single-story house; Yellowstone model (built by National HomeCorp); Frame construction with vinyl siding
- Construction: Frame construction; Vinyl siding exterior; Asphalt shingle roof; Slab foundation
- Exterior features: Slab foundation; 110' x 115' x 110' x 121' lot dimensions; Lot approximately 0.3 acres (about 13,068 sq ft); Public maintained road access; Public water and public sewer
Interior
- Bedrooms: 4 bedrooms (all on the main level)
- Flooring: Carpet; Vinyl
- Bathrooms: 2 full bathrooms
- Heating & cooling: Electric heat pump; Central air (electric)
- Interior features: Carpet and vinyl flooring
Neighborhood map
What this means for you Summary
Snapshot
- This is a 4-bed/2.0-bath single-family listed at $229k.
Deal economics
- At list price, monthly cash flow is $-225 ($-3k/yr) — negative.
- To cash-flow at today's rent, offer at most $196k (14.2% below list).
- To meet the 1% rule (rent ≥ 1% of price), the offer needs to be $180k (21.3% below list).
- Recommended offer: $180k (21.3% below list) — sets the bar for 1% rule.
- Cap rate 5.5% vs local median 4.5% in Roxboro — meaningfully above typical; check what's discounted (condition, days-on-market, listing class) to confirm the premium yield is real.
Location & tenants
- Location reads 55/100 on livability (#649 in NC) — a working-class tenant base; expect higher turnover. Strengths: cost of living A+; Watch: crime F, amenities F, commute F.
- Person County Schools (rural): math 39% / reading 42% proficiency, ranked #110 of 178 in NC (top 62%) — families likely to look elsewhere, expect single-tenant / working-renter base with shorter leases.
- Zoned schools: Person High (math 45% / reading 44%, grade F, #352 of 535 statewide, top 68%, 1,079 students, 60% FRL).
- Market conditions: 100 active listings in the ZIP; 113 units permitted in Person County in 2024 (0 in 5+ unit buildings).
Forward outlook
- In year one you build about $18k of equity ($2k loan paydown + $16k appreciation (7.0% local appreciation)).
- Person County population projected at -15% by 2050 — secular population decline; favor cash flow + early exit over multi-decade hold.
- By year 3, paydown + projected appreciation supports a ~$44k cash-out refi (75% LTV) — recoverable capital for the next deal without selling this one.
Negotiation context
- It's been on market 118 days — a 9% lower offer ($208k) is reasonable based on typical stale-listing flexibility.
Risks & watch-outs
- Watch-outs: flood insurance adds $66/mo.
- Climate carrying-cost: major flood risk; moderate wind risk, 24% chance of damaging wind over 30y; extreme-heat days projected 7→17/yr by 2055 (HVAC capex compounding) — expect insurance premiums to compound above CPI over the hold.
Questions for the listing agent
- What do current leases actually rent for vs. the listed asking? Can we see a recent rent roll and the last 12 months of T-12 income?
- It's been on market 118 days. Have you received any prior offers? Is the seller open to a 21% concession, seller financing, or rate buy-down credit?
- What's the actual annual flood-insurance premium (NFIP or private), and is the property in a SFHA with mandatory coverage?
- Why hasn't it sold? Are there any deal-killer items the seller is aware of (foundation, flood, title, zoning, code violations)?
- Is there a deadline driving the sale (1031 exchange, divorce, estate, relocation)? That informs how much negotiation room exists.
- Schools are D-rated, which usually means shorter tenancies and higher turnover. Who's the typical renter profile here, and what's been the actual vacancy rate?
- Crime grade is F in this area — have there been break-ins, vandalism, or insurance claims at this property in the last 3 years? What carrier currently insures it and at what premium?
- The area grade is low — what's the realistic commute time and amenity access for the typical tenant pool here? Any planned neighborhood developments (good or bad) we should know about?
- What's the average days-on-market for RENTAL listings here right now (not sales)? A rising rental-DOM trend means longer vacancies and softer asking-rent achievability than the comps imply.
- What's the recent tenant-quality profile in this submarket — average credit score on applications, eviction rate, late-payment / NSF rate, and stable-employment percentage? A property-management company in the area should have these aggregated.
- How much new for-sale + rental construction is in the pipeline within 1–3 miles? Heavy new supply typically softens prices + rents 12–24 months out; constrained supply supports both.
Investment metrics
- 1% rule
- 0.79% ✗
- Cap rate
- 5.46%
- Cash-on-cash
- -2.96%
- DSCR
- 0.87
- GRM
- 10.6
CMA / ARV
- ARV (on-the-fly)
- $253,581
- Comps found
- 4
Show comp detail 4 sales within ~0.75 mi
| Address | Dist | Beds/Ba | Sqft | Sold | Price | $/sf | Match |
|---|---|---|---|---|---|---|---|
| 317 Pine St | 0.22mi | 3/2.0 (-1) | 1,216 (-13%) | 1mo | $220,000 | $181 | 62 |
| 310 Chub Lake St | 0.48mi | 3/2.0 (-1) | 1,516 (+8%) | 2mo | $275,000 | $181 | 58 |
| 410 N Lamar St | 0.23mi | 3/1.0 (-1) | 1,610 (+15%) | 10mo | $220,000 | $137 | 47 |
| 205 Gentry St | 0.66mi | 3/2.0 (-1) | 1,523 (+9%) | 5mo | $289,900 | $190 | 45 |
Match score weights: distance 35% · size 25% · config 20% · recency 20%. Top-matched comps best support the ARV.
Projected returns pro-forma
7.01% appreciation · 3.0% rent growth · sell at horizon
- IRR
- 14.5%
- Equity multiple
- 2.03×
- Total profit
- $65,806
- Equity at exit
- $158,785
- IRR
- 14.5%
- Equity multiple
- 4.15×
- Total profit
- $202,114
- Equity at exit
- $301,710
Cash invested: $64,117 (down + closing). Projections, not guarantees.
Landlord ↔ Tenant lean methodology
- Overall (STATE)
- 85 Strongly Landlord-Friendly
- State North Carolina
- 85 Strongly Landlord-Friendly · R+3
- County
- — inherits STATE
- City
- — inherits STATE
ZIP-level market 27573
- Home prices YoY
- 2.5%
- Active inventory
- 100
- Price-to-rent
- 10.6×
Monthly cashflow live
- Estimated rent
- $1,803 medium interval (Pro) →
- Mortgage (P&I)
- −$1,201
- Tax est. 1.5%
- −$286 /mo · $3,435/yr
- Insurance
- −$95
- Flood insurance flood zone
- −$66 /mo · $798/yr
- HOA
- −$0
- Vacancy / Maint / Mgmt
- −$379
- Net cashflow
- $-225
Break-even live
Sensitivity live
| Price | -10% $-67 | -5% $-146 | +0% $-225 | +5% $-304 | +10% $-383 |
|---|---|---|---|---|---|
| Rent | -10% $-367 | -5% $-296 | +0% $-225 | +5% $-154 | +10% $-82 |
| Rate | -1.0pp $-110 | -0.5pp $-167 | base $-225 | +0.5pp $-284 | +1.0pp $-345 |
UW: 25.0% down · 7.5% · 30yr · 1.5% tax · 5.0% vac · 8.0% maint · 8.0% mgmt
Financing live
Cash to close
- Down payment
- $57,248
- Closing costs
- $6,870
- Reserves months
- —
- Total cash needed
- —
Loan-product check · same deal, 3 products live
Conventional
25% down · 7.5% · 30yr
- Down + closing
- —
- Monthly P&I
- —
- Monthly cashflow
- —
- DSCR
- —
- Eligible?
- —
Personal DTI + credit; lowest rate.
DSCR
20% down · 8.5% · 30yr
- Down + closing
- —
- Monthly P&I
- —
- Monthly cashflow
- —
- DSCR
- —
- Eligible?
- —
No personal income docs; deal must DSCR.
Hard money
10% down · 12.0% · 12mo
- Down + closing
- —
- Monthly P&I
- —
- Monthly cashflow
- —
- DSCR
- —
- Eligible?
- —
Short-term bridge; refi at stabilization.
Listing history 21 events
-
2026-06-22days on market $228,990 Active 118 DOM
-
2026-06-21days on market $228,990 Active 117 DOM
-
2026-06-21days on market $228,990 Active 116 DOM
-
2026-06-18days on market $228,990 Active 114 DOM
-
2026-06-17days on market $228,990 Active 113 DOM
-
2026-06-16days on market $228,990 Active 112 DOM
-
2026-06-15days on market $228,990 Active 111 DOM
-
2026-06-13days on market $228,990 Active 109 DOM
-
2026-06-12days on market $228,990 Active 108 DOM
-
2026-06-09days on market $228,990 Active 105 DOM
-
2026-06-08days on market $228,990 Active 104 DOM
-
2026-06-07days on market $228,990 Active 103 DOM
-
2026-06-05days on market $228,990 Active 101 DOM
-
2026-06-04days on market $228,990 Active 99 DOM
-
2026-06-02days on market $228,990 Active 98 DOM
-
2026-06-01days on market $228,990 Active 97 DOM
-
2026-05-31days on market $228,990 Active 96 DOM
-
2026-05-22price $228,990
-
2026-05-14price $242,990
-
2026-03-18price $244,990
-
2026-02-24$261,100 Active
ⓘ Source: listings_history table (triggers on properties + properties_extension) + one-shot
backfill from property_details.listing_events for pre-trigger history.
Climate risk First Street
- Flood 7/10 Severe FEMA zone X (unshaded) · 78% chance over 30 yrs
- Wildfire 1/10 Low
- Heat 6/10 Major 7 d/yr ≥103°F today · 17 d/yr by 30 yrs out
- Wind 5/10 Major 24% chance of damaging wind over 30 yrs
- Air quality 2/10 Low 1 unhealthy d/yr today · 2 by 30 yrs out
Nearby sold comps map
Loading sold comps map…
Walkable amenities ~0.75 mi
Loading nearby amenities…
Taxation est. · year 1
- Rental income
- $21,632
- − Mortgage interest
- −$12,827
- − Property taxes
- −$3,435
- − Insurance
- −$1,942
- − Repairs & maintenance
- −$1,731
- − Management
- −$1,731
- − Depreciation
- −$6,662
- Taxable loss
- −$6,695
- Est. tax savings @ 24.0%
- +$1,607
- After-tax cash flow
- $-1,091/yr
For passive investors: Depreciation is non-cash, so a rental often shows a tax loss while cash-flowing — sheltering income. Rental losses are passive: they offset passive income freely, and up to $25,000/yr can offset ordinary (W-2) income if you actively participate and your MAGI is under $100k (phasing out to $0 by $150k); unused losses carry forward. On sale, claimed depreciation is recaptured at up to 25%, and gains may owe capital-gains tax (a 1031 exchange can defer both). Figures are a year-1 estimate at your 24.0% rate — not tax advice; consult a CPA.
Schools (NCES district)
- District
- Person County Schools
- NCES district ID
- 3703630
- Math proficiency
- 39% ▬ 0.00%
- Reading proficiency
- 42% ▲ 2.00%
- Median HH income
- $43,729
- Composite
- 34.3/100
- National rank
- #5242
- State rank
- #110 of 178 in NC
Livability — Roxboro
- Score
- 55/100
- State rank
- #649
- US rank
- #23536
Category grades
Schools grade is shown separately in the Schools card above.
Census & demographics
- Census place
- Roxboro, NC
- City population
- 11,954
- Population (ZIP)
- 11,954
Population outlook (Person County) Hauer SSP2
- Today (2025)
- 38,577 people
- By 2030
- 37,847 · -1.9%
- By 2040
- 35,740 · -7.4%
- By 2050
- 32,683 · -15.3%
- By 2075
- 24,979 · -35.2%
- By 2100
- 15,779 · -59.1%
Race, ethnicity, and origin ACS 2023
- Neighborhood character
- Diverse neighborhood (Simpson 0.65)
- Race & ethnicity
- White 45% Black 36% Hispanic / Latino 11% Two or more races 11% Native American 2%
- Hispanic origin (detail)
- Mexican 9%
- Common ancestry
- Slovak 3% Romanian 2% Italian 1%
- Foreign-born
- 5% · Canada
- Languages at home
- 90% English-only · Spanish 8% Other Asian/Pacific 1% Other Indo-European 1%
Political lean MEDSL · Person
- 2024 margin
- Strong R (+23.7) · D 37.7% · R 61.4%
- 2008→2024 swing
- -15.2pp toward R · 2008: -8.5pp · 2024: -23.7pp
- All cycles
- 2024: R+23.7 2020: R+21.6 2016: R+17.3 2012: R+11.0 2008: R+8.5
Not yet ingested
- Civics
- —
Market trends
- HPI YoY
- ▲ 7.01%
- Current HPI
- 286.1496
- Rent YoY
- —
- Metro
- —
- State GDP YoY
- ▲ 3.28%
- F500 in state
- 26
Industry mix (Fortune 500 HQ in NC)
| Industry | F500 HQs | Revenue |
|---|---|---|
| Financial Services | 2 | $213B |
|
||
| Retail | 2 | $95B |
|
||
| Industrial Conglomerate | 1 | $38B |
|
||
| Metals / Steel | 1 | $35B |
|
||
| Utilities | 1 | $30B |
|
||
| Industrial Machinery | 1 | $19B |
|
||
Price history
-12.3% since first listed4 events — show timeline
- 2026-05-22 Price Changed $228,990 TMLS
- 2026-05-14 Price Changed $242,990 TMLS
- 2026-03-18 Price Changed $244,990 TMLS
- 2026-02-24 Listed $261,100 TMLS
Cash-flow waterfall
monthlySold comps — $/sqft
last 12 mo · ≤1 miLoading sold comps…