1569 NW 109th Ave · Ocala Estates, FL
Flood risk 3/10 · Minor
- FEMA flood zone
- X (unshaded)
- Chance of flooding over 30 yrs
- 0.2%
- Est. flood insurance / yr
- $507 – $1,088
Fire risk 5/10 · Moderate
- Est. fire insurance / yr
- $947 – $1,759
Heat risk 9/10 · Severe
- Hot days now (above 107°F)
- 7 days/yr
- Hot days in 30 yrs
- 24 days/yr
Wind risk 9/10 · Severe
- Chance of severe wind over 30 yrs
- 99.0%
Air-quality risk 3/10 · Minor
- Unhealthy air days now
- 3 days/yr
- Unhealthy air days in 30 yrs
- 3 days/yr
Risk factors via First Street. Map © Google.
Why this score? — see what drove the C- grade
The composite is a weighted blend of 9 inputs, each scored 0–100. Each bar is that input's sub-score; the figure is the points it added to the 100-point composite (weight × sub-score).
- ARV discount +15.0/15.0
- Cash flow +14.6/30.0
- Rent growth +5.0/5.0
- DSCR +4.5/10.0
- 1% rule +3.7/10.0
- Schools +3.6/10.0
- Livability +2.5/5.0
- Condition / age +2.5/5.0
- Appreciation +0.0/10.0
$199,999
🖨 Deal sheet (PDF) 📄 Offer letter ✓ Due diligence
Listing remarks
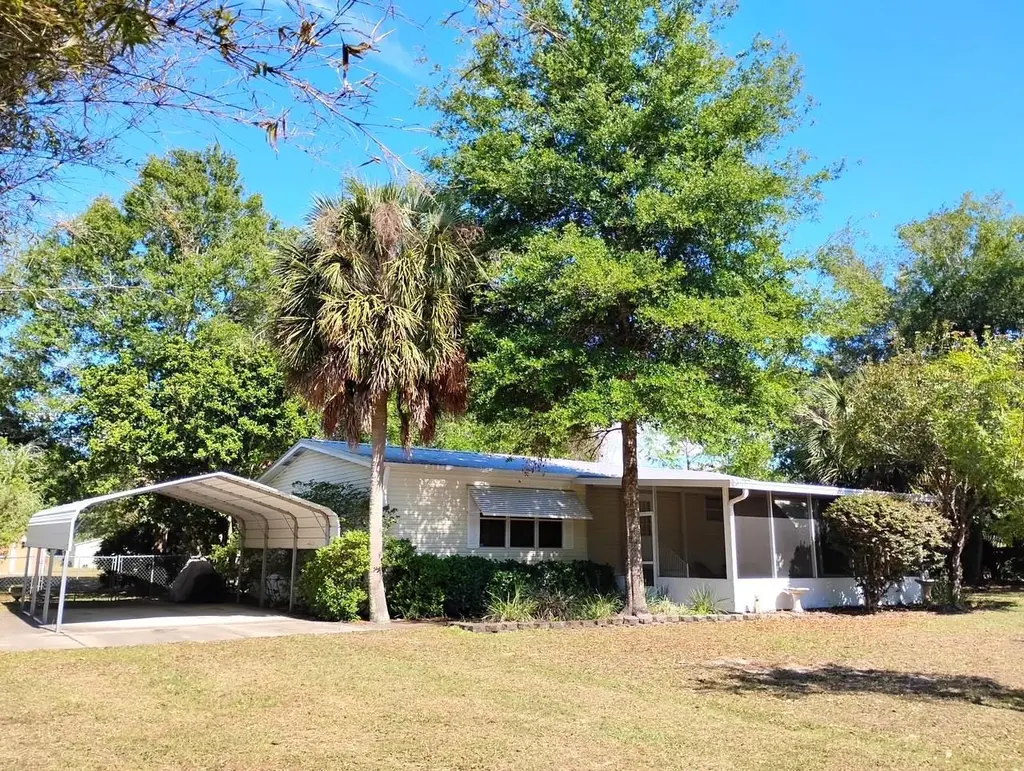
Discover easy country living in the desirable Fellowship Acres community in Ocala's stunning horse country. This well-maintained mobile home is set on 1-acre and has been lovingly cared for by its original owner. Newer updates include a new AC (2017) and new metal roof (2017). Ideally located just 6 miles from the World Equestrian Center (WEC), this property is perfect for equestrian enthusiasts or anyone seeking a peaceful, horse-friendly setting with convenient access to world-class facilities. Providing a total of 2-bedrooms and 2-baths, the home features an open floor plan, vaulted ceilings, and lots of space with over 1,300 sqft of room. Enjoy your morning coffee or the evening breeze
Key facts
- 1 acre lot
- Parking
- Built 2000
Property features AI
Finance
- Other: Lot is approximately 1 acre (zoned for horses); Lot dimensions about 169 x 260; 1 well and 1 septic on the property; Zoning: RR1
- HOA & community: No association; Horses allowed
Exterior
- Parking: Has a 1-space carport
- Utilities: Well water; Septic tank; Cable available; Electricity available; Phone available; Water connected
- Home design: Manufactured double-wide home; Single-story; Faces west; Property is residential and completed
- Construction: Vinyl siding; Metal roof; Concrete perimeter foundation; Built by Kinder Mobile Home Sales - Homes of Merit; One building (building area total recorded)
- Exterior features: Covered front porch; Screened porch; Porch; Storage shed; Chain link and wire fencing; Paved road frontage; Publicly maintained road
Interior
- Kitchen: Built-in oven; Cooktop; Microwave; Range hood; Refrigerator
- Bedrooms: 2 bedrooms
- Flooring: Laminate flooring
- Bathrooms: 2 full bathrooms
- Heating & cooling: Central heating; Central air
- Interior features: Ceiling fans; Open floorplan
- Laundry & utility: Washer included; Laundry located in kitchen; Inside laundry; Laundry closet
Neighborhood map
What this means for you Summary
Snapshot
- This is a 2-bed/2.0-bath manufactured listed at $200k.
Deal economics
- At list price, monthly cash flow is $49 ($591/yr) — positive.
- The deal already cash-flows at list — no discount required.
- To meet the 1% rule (rent ≥ 1% of price), the offer needs to be $175k (12.5% below list).
- Recommended offer: $175k (12.5% below list) — sets the bar for 1% rule.
Location & tenants
- Location reads: area grade C — affects rentability + tenant quality, not the cash-flow math above.
- Marion (rural): math 42% / reading 43% proficiency, ranked #61 of 73 in FL (top 84%) — families likely to look elsewhere, expect single-tenant / working-renter base with shorter leases; 61% free/reduced lunch — lower-income household profile, screen leases tightly.
- Market conditions: Rents rising fast (+11.1%/yr); 670 active listings in the ZIP; 3 comparable units currently listed for rent nearby; rentals at typical pace (median 15d on market — plan ~3-4 weeks tenant-placement turnaround); 7,071 units permitted in Marion County in 2024 (534 in 5+ unit buildings).
- This rent runs 32% of the median local income ($66k/yr) — at the standard rent-burdened threshold; future hikes will face affordability resistance.
Forward outlook
- Local home prices are declining (-3.0%/yr); year-one equity from $1k of loan paydown is wiped out by about $6k of value loss. Plan a longer hold.
- Marion County population projected at +13% by 2050 — modest demand growth; plan on rents tracking national, not racing it.
Negotiation context
- It's been on market 47 days — a 3% lower offer ($194k) is reasonable based on typical stale-listing flexibility.
Risks & watch-outs
- Climate carrying-cost: severe wind risk, 99% chance of damaging wind over 30y; moderate wildfire risk; extreme-heat days projected 7→24/yr by 2055 (HVAC capex compounding) — expect insurance premiums to compound above CPI over the hold.
Questions for the listing agent
- It's been on market 47 days. Have you received any prior offers? Is the seller open to a 13% concession, seller financing, or rate buy-down credit?
- Is there a deadline driving the sale (1031 exchange, divorce, estate, relocation)? That informs how much negotiation room exists.
- What's the average days-on-market for RENTAL listings here right now (not sales)? A rising rental-DOM trend means longer vacancies and softer asking-rent achievability than the comps imply.
- What's the recent tenant-quality profile in this submarket — average credit score on applications, eviction rate, late-payment / NSF rate, and stable-employment percentage? A property-management company in the area should have these aggregated.
- How much new for-sale + rental construction is in the pipeline within 1–3 miles? Heavy new supply typically softens prices + rents 12–24 months out; constrained supply supports both.
Investment metrics
- 1% rule
- 0.87% ✗
- Cap rate
- 6.59%
- Cash-on-cash
- 1.06%
- DSCR
- 1.05
- GRM
- 9.5
CMA / ARV
- ARV (median comp)
- $282,579
- List price
- $199,999
- Delta
- -29.22%
- Verdict
- UNDERPRICED
- Comps
- 1 within 2.0 mi
Projected returns pro-forma
-3.0% appreciation · 8.0% rent growth · sell at horizon
- IRR
- -9.3%
- Equity multiple
- 0.64×
- Total profit
- $-20,030
- Equity at exit
- $29,821
- IRR
- 5.7%
- Equity multiple
- 1.51×
- Total profit
- $28,666
- Equity at exit
- $17,292
Cash invested: $56,000 (down + closing). Projections, not guarantees.
Landlord ↔ Tenant lean methodology
- Overall (STATE)
- 87 Strongly Landlord-Friendly
- State Florida
- 87 Strongly Landlord-Friendly · R+3
- County
- — inherits STATE
- City
- — inherits STATE
ZIP-level market 34482
- Rents YoY
- 11.1%
- Active inventory
- 670
- Price-to-rent
- 9.5×
Monthly cashflow live
- Estimated rent
- $1,750 medium interval (Pro) →
- Mortgage (P&I)
- −$1,049
- Tax from tax record
- −$201 /mo · $2,410/yr
- Insurance
- −$83
- HOA
- −$0
- Vacancy / Maint / Mgmt
- −$367
- Net cashflow
- $49
Break-even live
Sensitivity live
| Price | -10% $162 | -5% $106 | +0% $49 | +5% $-7 | +10% $-64 |
|---|---|---|---|---|---|
| Rent | -10% $-89 | -5% $-20 | +0% $49 | +5% $118 | +10% $187 |
| Rate | -1.0pp $150 | -0.5pp $100 | base $49 | +0.5pp $-3 | +1.0pp $-55 |
UW: 25.0% down · 7.5% · 30yr · 1.5% tax · 5.0% vac · 8.0% maint · 8.0% mgmt
Financing live
Cash to close
- Down payment
- $50,000
- Closing costs
- $6,000
- Reserves months
- —
- Total cash needed
- —
Loan-product check · same deal, 3 products live
Conventional
25% down · 7.5% · 30yr
- Down + closing
- —
- Monthly P&I
- —
- Monthly cashflow
- —
- DSCR
- —
- Eligible?
- —
Personal DTI + credit; lowest rate.
DSCR
20% down · 8.5% · 30yr
- Down + closing
- —
- Monthly P&I
- —
- Monthly cashflow
- —
- DSCR
- —
- Eligible?
- —
No personal income docs; deal must DSCR.
Hard money
10% down · 12.0% · 12mo
- Down + closing
- —
- Monthly P&I
- —
- Monthly cashflow
- —
- DSCR
- —
- Eligible?
- —
Short-term bridge; refi at stabilization.
Rent comps 3 comps
| Address | Beds | Baths | Sqft | Rent | $/sqft | DOM | Units | Dist |
|---|---|---|---|---|---|---|---|---|
| 11392 NW 16th Pl Ocala, FL | 3.0 | 2.0 | 1264 | $1,395 | $1.10 | 14d | 1 | 0.55mi |
| 1951 NW 119th Ct Ocala, FL | 3.0 | 2.0 | 1551 | $1,850 | $1.19 | 22d | 1 | 1.11mi |
| 1726 NW 119th Ct Ocala, FL | 3.0 | 2.0 | 1782 | $1,800 | $1.01 | 14d | 1 | 1.11mi |
Listing history 17 events
-
2026-06-21days on market $199,999 Active 47 DOM
-
2026-06-18days on market $199,999 Active 44 DOM
-
2026-06-17days on market $199,999 Active 43 DOM
-
2026-06-16days on market $199,999 Active 42 DOM
-
2026-06-15days on market $199,999 Active 41 DOM
-
2026-06-14days on market $199,999 Active 39 DOM
-
2026-06-13days on market $199,999 Active 38 DOM
-
2026-06-10days on market $199,999 Active 36 DOM
-
2026-06-09days on market $199,999 Active 35 DOM
-
2026-06-08days on market $199,999 Active 34 DOM
-
2026-06-07days on market $199,999 Active 33 DOM
-
2026-06-03days on market $199,999 Active 29 DOM
-
2026-06-02days on market $199,999 Active 28 DOM
-
2026-06-01days on market $199,999 Active 27 DOM
-
2026-05-31days on market $199,999 Active 26 DOM
-
2026-05-30days on market $199,999 Active 25 DOM
-
2026-05-05$199,999 Active 1242-char remark
ⓘ Source: listings_history table (triggers on properties + properties_extension) + one-shot
backfill from property_details.listing_events for pre-trigger history.
Tax reassessment forecast FL · Resets to sale price
- Current annual tax
- $2,410 · $201/mo
- Projected year-2 tax
- $2,410 · $201/mo
- Expected delta
- $0/yr ($0/mo · 0.0%)
ⓘ Screening estimate from a state-policy table — verify with the county assessor before closing.
Climate risk First Street
- Flood 3/10 Moderate FEMA zone X (unshaded) · 20% chance over 30 yrs
- Wildfire 5/10 Major
- Heat 9/10 Extreme 7 d/yr ≥107°F today · 24 d/yr by 30 yrs out
- Wind 9/10 Extreme 99% chance of damaging wind over 30 yrs
- Air quality 3/10 Moderate 3 unhealthy d/yr today · 3 by 30 yrs out
Nearby sold comps map
Loading sold comps map…
Walkable amenities ~0.75 mi
Loading nearby amenities…
Taxation est. · year 1
- Rental income
- $20,996
- − Mortgage interest
- −$11,203
- − Property taxes
- −$2,410
- − Insurance
- −$1,000
- − Repairs & maintenance
- −$1,680
- − Management
- −$1,680
- − Depreciation
- −$5,818
- Taxable loss
- −$2,795
- Est. tax savings @ 24.0%
- +$671
- After-tax cash flow
- $1,262/yr
For passive investors: Depreciation is non-cash, so a rental often shows a tax loss while cash-flowing — sheltering income. Rental losses are passive: they offset passive income freely, and up to $25,000/yr can offset ordinary (W-2) income if you actively participate and your MAGI is under $100k (phasing out to $0 by $150k); unused losses carry forward. On sale, claimed depreciation is recaptured at up to 25%, and gains may owe capital-gains tax (a 1031 exchange can defer both). Figures are a year-1 estimate at your 24.0% rate — not tax advice; consult a CPA.
Schools (NCES district)
- District
- Marion
- NCES district ID
- 1201260
- Math proficiency
- 42% ▼ -7.00%
- Reading proficiency
- 43% ▼ -4.00%
- Median HH income
- $40,015
- Composite
- 35.61/100
- National rank
- #4890
- State rank
- #61 of 73 in FL
Livability — Ocala Estates
No livability data for this city. (Only ~50 U.S. cities are tracked.)
Census & demographics
- County
- Marion County · 315,796 people
- City population
- 263,375
- Metro
- Ocala, FL
- Population (ZIP)
- 22,807
- Household income
- $65,901
- Rent vs Own
- Severe rent burden
- 282.0
Population outlook (Marion County) Hauer SSP2
- Today (2025)
- 365,905 people
- By 2030
- 376,768 · +3.0%
- By 2040
- 396,555 · +8.4%
- By 2050
- 412,723 · +12.8%
- By 2075
- 446,090 · +21.9%
- By 2100
- 436,193 · +19.2%
Race, ethnicity, and origin ACS 2023
- Neighborhood character
- Majority White (63%)
- Race & ethnicity
- White 63% Hispanic / Latino 19% Black 14% Two or more races 12%
- Hispanic origin (detail)
- Mexican 6% Puerto Rican 9% Cuban 2%
- Common ancestry
- Lithuanian 2% Romanian 2% Slovak 2%
- Foreign-born
- 10% · Canada
- Languages at home
- 81% English-only · Spanish 16% Other Indo-European 1%
Political lean MEDSL · Marion
- 2024 margin
- Solid R (+31.6) · D 33.8% · R 65.5%
- 2008→2024 swing
- -20.0pp toward R · 2008: -11.6pp · 2024: -31.6pp
- All cycles
- 2024: R+31.6 2020: R+25.9 2016: R+26.2 2012: R+16.2 2008: R+11.6
Not yet ingested
- Civics
- —
Market trends
- HPI YoY
- ▼ -133.62%
- Current HPI
- 194.3857
- Rent YoY
- ▲ 11.12%
- Metro
- Ocala, FL
- State GDP YoY
- ▲ 3.28%
- F500 in state
- 36
Industry mix (Fortune 500 HQ in FL)
| Industry | F500 HQs | Revenue |
|---|---|---|
| Industrial Technology | 2 | $29B |
|
||
| Insurance | 2 | $17B |
|
||
| Retail | 1 | $60B |
|
||
| Technology Distribution | 1 | $58B |
|
||
| Homebuilding | 1 | $35B |
|
||
| Technology Manufacturing | 1 | $35B |
|
||
Price history
1 event — show timeline
- 2026-05-05 Listed $199,999 Stellar MLS as Distributed by MLS Grid
Property tax history
+13.5%/yrLatest (2025): $2,410 · +14.6% YoY. Source: county tax records.
Cash-flow waterfall
monthlySold comps — $/sqft
last 12 mo · ≤1 miLoading sold comps…