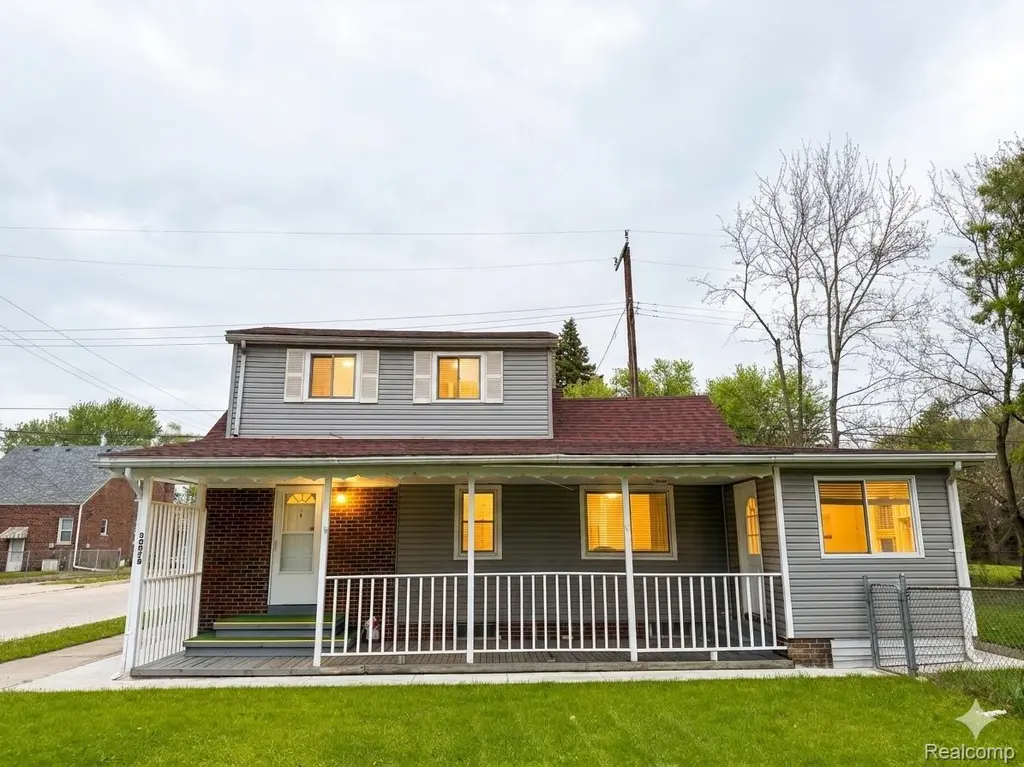
20870 Curie Ave · Warren, MI
Flood risk 7/10 · Major
- FEMA flood zone
- X (unshaded)
- Chance of flooding over 30 yrs
- 0.99%
- Est. flood insurance / yr
- $473 – $860
Fire risk 1/10 · Minimal
- Est. fire insurance / yr
- $784 – $1,456
Heat risk 3/10 · Minor
- Hot days now (above 97°F)
- 7 days/yr
- Hot days in 30 yrs
- 15 days/yr
Wind risk 1/10 · Minimal
- Chance of severe wind over 30 yrs
- —
Air-quality risk 3/10 · Minor
- Unhealthy air days now
- 3 days/yr
- Unhealthy air days in 30 yrs
- 5 days/yr
Risk factors via First Street. Map © Google.
Why this score? — see what drove the D+ grade
The composite is a weighted blend of 9 inputs, each scored 0–100. Each bar is that input's sub-score; the figure is the points it added to the 100-point composite (weight × sub-score).
- Cash flow +20.4/30.0
- DSCR +6.5/10.0
- 1% rule +5.0/10.0
- ARV discount +4.5/15.0
- Livability +3.7/5.0
- Rent growth +3.1/5.0
- Condition / age +2.5/5.0
- Schools +1.3/10.0
- Appreciation +0.0/10.0
$134,900
🖨 Deal sheet (PDF) 📄 Offer letter ✓ Due diligence
Listing remarks MLS
Beautifully updated and city-certified home featuring a brand-new roof, new flooring, and fresh paint throughout. This move-in-ready property offers 2 comfortable bedrooms plus a spacious family room that can be used as a third bedroom or additional living space, along with 1.5 bathrooms. Enjoy a bright kitchen and large living area perfect for everyday living and entertaining. Conveniently located near schools, shopping, and major roads, this home is a great opportunity for first-time buyers or investors alike.
Key facts
- 9,583 sq ft lot
- Built 1935
- Listed 37 days
Property features AI
Exterior
- Parking: No garage
- Utilities: Public water; Public sewer
- Home design: Single-family residence; Two levels; Ground-level entry with steps
- Construction: Vinyl siding; Brick/mortar foundation; Built area above grade approximately 1,100
- Exterior features: Paved road access; Lot dimensions approximately 72 x 130 (0.22 acres); Subdivision: Paderewski Park Sub; Cross street: Ryan Road
Interior
- Bathrooms: 1 full bathroom; 1 half bathroom
- Heating & cooling: Forced air heating (natural gas); No cooling
- Interior features: Unfinished basement; Two total rooms
Neighborhood map
What this means for you Summary
Snapshot
- This is a 2-bed/1.0-bath single-family listed at $135k.
Deal economics
- At list price, monthly cash flow is $120 ($1k/yr) — positive.
- The deal already cash-flows at list — no discount required.
- Meets the 1% rule at list price ($1k rent vs $135k).
- Recommended offer: $131k (3.0% below list) — sets the bar for market timing.
- Cap rate 7.9% vs local median 5.2% in Warren — top-decile yield for the area; either an underpriced asset or a hidden risk that comps aren't pricing in. Stress-test before assuming the spread holds.
Location & tenants
- Location reads 74/100 on livability (#171 in MI, #4,491 nationally) — a middle-class / working-renter tenant base. Strengths: commute A+, cost of living A+, housing A+; Watch: amenities D, employment D, crime D-.
- Fitzgerald Public Schools (urban): math 8% / reading 23% proficiency, ranked #503 of 540 in MI (top 93%) — low school quality limits family demand, transient renter base, plan for 1-2y turnover; 77% free/reduced lunch — lower-income household profile, screen leases tightly.
- Zoned schools: Mound Park Elementary School (math 6% / reading 16%, grade F, #1,226 of 1,397 statewide, top 88%, 260 students, 87% FRL); Pd Chatterton Middle School (math 9% / reading 27%, grade F, #433 of 493 statewide, top 88%, 410 students, 86% FRL); Fitzgerald Senior High School (math 8% / reading 26%, grade F, #636 of 713 statewide, top 89%, 806 students, 82% FRL).
- Market conditions: Rents rising (+2.4%/yr); 170 active listings in the ZIP; 40 comparable units currently listed for rent nearby; rentals at typical pace (median 24d on market — plan ~3-4 weeks tenant-placement turnaround); 1,321 units permitted in Macomb County in 2024 (86 in 5+ unit buildings).
Forward outlook
- Local home prices are declining (-3.0%/yr); year-one equity from $933 of loan paydown is wiped out by about $4k of value loss. Plan a longer hold.
- Macomb County population projected at +9% by 2050 — modest demand growth; plan on rents tracking national, not racing it.
Negotiation context
- It's been on market 38 days — a 3% lower offer ($131k) is reasonable based on typical stale-listing flexibility.
- 19 sale attempts since 31y ago with the ask held roughly flat each time — persistent listings suggest the price (not the market) is what's stuck; bring a comps-based counter.
- Current owner paid $86k; list at $135k implies a 57% gain — meaningful room to come down on a strong offer.
Risks & watch-outs
- Watch-outs: flood insurance adds $56/mo; built in 1935 — expect roof / HVAC / electrical / plumbing capex.
- Climate carrying-cost: major flood risk — expect insurance premiums to compound above CPI over the hold.
Questions for the listing agent
- It's been on market 38 days. Have you received any prior offers? Is the seller open to a 3% concession, seller financing, or rate buy-down credit?
- Built in 1935 — when were the roof, HVAC, electrical panel, plumbing, and water heater last replaced?
- What's the actual annual flood-insurance premium (NFIP or private), and is the property in a SFHA with mandatory coverage?
- Is there a deadline driving the sale (1031 exchange, divorce, estate, relocation)? That informs how much negotiation room exists.
- Schools are D-rated, which usually means shorter tenancies and higher turnover. Who's the typical renter profile here, and what's been the actual vacancy rate?
- Crime grade is D in this area — have there been break-ins, vandalism, or insurance claims at this property in the last 3 years? What carrier currently insures it and at what premium?
- The area grade is low — what's the realistic commute time and amenity access for the typical tenant pool here? Any planned neighborhood developments (good or bad) we should know about?
- What's the average days-on-market for RENTAL listings here right now (not sales)? A rising rental-DOM trend means longer vacancies and softer asking-rent achievability than the comps imply.
- What's the recent tenant-quality profile in this submarket — average credit score on applications, eviction rate, late-payment / NSF rate, and stable-employment percentage? A property-management company in the area should have these aggregated.
- How much new for-sale + rental construction is in the pipeline within 1–3 miles? Heavy new supply typically softens prices + rents 12–24 months out; constrained supply supports both.
Investment metrics
- 1% rule
- 1.00% ✓
- Cap rate
- 7.85%
- Cash-on-cash
- 5.58%
- DSCR
- 1.25
- GRM
- 8.3
CMA / ARV
- ARV (median comp)
- $126,525
- List price
- $134,900
- Delta
- 6.62%
- Verdict
- FAIR
- Comps
- 20 within 1.0 mi
Show comp detail 12 sales within ~0.75 mi
| Address | Dist | Beds/Ba | Sqft | Sold | Price | $/sf | Match |
|---|---|---|---|---|---|---|---|
| 21455 Blackmar Ave | 0.26mi | 2/1.0 | 1,087 (+0%) | 0mo | $130,000 | $120 | 87 |
| 21034 Audrey Ave | 0.14mi | 3/1.0 (+1) | 1,080 (-0%) | 8mo | $50,000 | $46 | 82 |
| 21029 Blackmar Ave | 0.14mi | 3/1.0 (+1) | 1,062 (-2%) | 6mo | $120,000 | $113 | 80 |
| 20811 Sunset Ave | 0.59mi | 3/1.0 (+1) | 1,090 (+1%) | 3mo | $122,000 | $112 | 64 |
| 5584 Toepfer Rd | 0.37mi | 3/1.0 (+1) | 1,007 (-7%) | 8mo | $139,900 | $139 | 60 |
| 21852 Cyman Ave | 0.42mi | 3/2.0 (+1) | 1,150 (+6%) | 2mo | $133,000 | $116 | 59 |
| 3191 E Outer Dr | 0.63mi | 3/1.5 (+1) | 1,072 (-1%) | 6mo | $79,500 | $74 | 57 |
| 20057 Keystone St | 0.47mi | 3/1.0 (+1) | 1,019 (-6%) | 7mo | $81,500 | $80 | 57 |
| 21603 Sunset Ave | 0.66mi | 3/1.0 (+1) | 1,105 (+2%) | 7mo | $170,000 | $154 | 55 |
| 22011 Masch Ave | 0.55mi | 3/1.0 (+1) | 1,000 (-8%) | 5mo | $163,000 | $163 | 52 |
| 22373 Cyman Ave | 0.64mi | 3/2.0 (+1) | 1,192 (+10%) | 3mo | $215,000 | $180 | 42 |
| 22521 Panama Ave | 0.68mi | 2/1.0 | 936 (-14%) | 8mo | $150,000 | $160 | 39 |
Match score weights: distance 35% · size 25% · config 20% · recency 20%. Top-matched comps best support the ARV.
Projected returns pro-forma
-3.0% appreciation · 2.35% rent growth · sell at horizon
- IRR
- -11.0%
- Equity multiple
- 0.60×
- Total profit
- $-15,063
- Equity at exit
- $20,114
- IRR
- -2.7%
- Equity multiple
- 0.82×
- Total profit
- $-6,708
- Equity at exit
- $11,664
Cash invested: $37,772 (down + closing). Projections, not guarantees.
Landlord ↔ Tenant lean methodology
- Overall (STATE)
- 62 Landlord-Friendly
- State Michigan
- 62 Landlord-Friendly · EVEN
- County
- — inherits STATE
- City
- — inherits STATE
ZIP-level market 48091
- Rents YoY
- 2.4%
- Active inventory
- 170
- Price-to-rent
- 8.3×
Monthly cashflow live
- Estimated rent
- $1,349 high interval (Pro) →
- Mortgage (P&I)
- −$707
- Tax from tax record
- −$127 /mo · $1,522/yr
- Insurance
- −$56
- Flood insurance flood zone
- −$56 /mo · $666/yr
- HOA
- −$0
- Vacancy / Maint / Mgmt
- −$283
- Net cashflow
- $120
Break-even live
Sensitivity live
| Price | -10% $196 | -5% $158 | +0% $120 | +5% $82 | +10% $44 |
|---|---|---|---|---|---|
| Rent | -10% $13 | -5% $67 | +0% $120 | +5% $173 | +10% $227 |
| Rate | -1.0pp $188 | -0.5pp $154 | base $120 | +0.5pp $85 | +1.0pp $50 |
UW: 25.0% down · 7.5% · 30yr · 1.5% tax · 5.0% vac · 8.0% maint · 8.0% mgmt
Financing live
Cash to close
- Down payment
- $33,725
- Closing costs
- $4,047
- Reserves months
- —
- Total cash needed
- —
Loan-product check · same deal, 3 products live
Conventional
25% down · 7.5% · 30yr
- Down + closing
- —
- Monthly P&I
- —
- Monthly cashflow
- —
- DSCR
- —
- Eligible?
- —
Personal DTI + credit; lowest rate.
DSCR
20% down · 8.5% · 30yr
- Down + closing
- —
- Monthly P&I
- —
- Monthly cashflow
- —
- DSCR
- —
- Eligible?
- —
No personal income docs; deal must DSCR.
Hard money
10% down · 12.0% · 12mo
- Down + closing
- —
- Monthly P&I
- —
- Monthly cashflow
- —
- DSCR
- —
- Eligible?
- —
Short-term bridge; refi at stabilization.
Rent comps 40 comps
| Address | Beds | Baths | Sqft | Rent | $/sqft | DOM | Units | Dist |
|---|---|---|---|---|---|---|---|---|
| 20794 Audrey Ave Warren, MI | 3.0 | 1.0 | 954 | $1,350 | $1.42 | 45d | 1 | 0.13mi |
| 21410 Panama St Warren, MI | 3.0 | 1.0 | 900 | $1,600 | $1.78 | 26d | 1 | 0.23mi |
| 21465 Syracuse Ave Warren, MI | 3.0 | 1.0 | 990 | $1,375 | $1.39 | 45d | 1 | 0.32mi |
| 21456 Syracuse Ave Warren, MI | 3.0 | 1.0 | 1160 | $1,595 | $1.38 | 45d | 1 | 0.33mi |
| 21456 Syracuse Ave Warren, MI | 3.0 | 1.0 | 1152 | $1,595 | $1.38 | 3d | 1 | 0.33mi |
| 20263 Caldwell St Detroit, MI | 3.0 | 1.0 | 909 | $1,350 | $1.49 | 18d | 1 | 0.36mi |
| 3974 Berkshire Ave Warren, MI | 1.0 | 1.0 | 900 | $1,350 | $1.50 | 1d | 1 | 0.73mi |
| 22622 Panama Ave Warren, MI | 3.0 | 1.5 | 920 | $1,395 | $1.52 | 12d | 1 | 0.75mi |
| 22580 Masch Ave Warren, MI | 3.0 | 1.0 | 988 | $1,450 | $1.47 | 26d | 1 | 0.81mi |
| 19450 Fenelon St Detroit, MI | 3.0 | 1.0 | 1062 | $1,384 | $1.30 | 6d | 1 | 0.84mi |
| 19361 Moenart St Unit 1 Detroit, MI | 2.0 | 1.0 | 1000 | $1,100 | $1.10 | 25d | 1 | 0.91mi |
| 19930 Binder St Detroit, MI | 3.0 | 1.0 | 1000 | $1,450 | $1.45 | 18d | 1 | 0.92mi |
| 19415 Gable St Detroit, MI | 3.0 | 1.0 | 1000 | $1,373 | $1.37 | 26d | 1 | 0.94mi |
| 19260 Bloom St Detroit, MI | 3.0 | 1.0 | 1100 | $1,350 | $1.23 | 6d | 1 | 0.99mi |
| 20000 Norwood St Detroit, MI | 3.0 | 1.5 | 1150 | $1,200 | $1.04 | 26d | 1 | 1.01mi |
| 7060 Victory Ave Warren, MI | 3.0 | 1.0 | 945 | $1,450 | $1.53 | 13d | 1 | 1.04mi |
| 7043 Meadow Ave Warren, MI | 2.0 | 1.0 | 911 | $1,274 | $1.40 | 45d | 1 | 1.05mi |
| 19162 Conley St Detroit, MI | 2.0 | 1.0 | 1000 | $1,300 | $1.30 | 45d | 1 | 1.08mi |
| 23378 Cunningham Ave Warren, MI | 3.0 | 1.0 | 1140 | $1,500 | $1.32 | 5d | 1 | 1.10mi |
| 19450 Norwood St Detroit, MI | 3.0 | 1.0 | 1000 | $1,200 | $1.20 | 6d | 1 | 1.18mi |
| 18891 Moenart St Detroit, MI | 3.0 | 1.0 | 870 | $1,195 | $1.37 | 18d | 1 | 1.18mi |
| 18891 Moenart St Detroit, MI | 3.0 | 1.0 | 1150 | $1,250 | $1.09 | 0d | 1 | 1.18mi |
| 18884 Bloom St Detroit, MI | 3.0 | 1.0 | 979 | $975 | $1.00 | 45d | 1 | 1.19mi |
| 18884 Bloom St Detroit, MI | 3.0 | 1.0 | 979 | $975 | $1.00 | 23d | 1 | 1.19mi |
| 7275 Chalmers Ave Warren, MI | 2.0 | 1.0 | 703 | $1,200 | $1.71 | 26d | 1 | 1.20mi |
| 7511 Toepfer Rd Warren, MI | 3.0 | 1.0 | 1032 | $1,199 | $1.16 | 23d | 1 | 1.21mi |
| 19694 Gallagher St Detroit, MI | 3.0 | 1.0 | 1000 | $1,150 | $1.15 | 16d | 1 | 1.24mi |
| 3951 Los Angeles Ave Warren, MI | 3.0 | 1.0 | 1258 | $1,500 | $1.19 | 26d | 1 | 1.24mi |
| 20255 Harned St Detroit, MI | 3.0 | 1.0 | 1000 | $1,374 | $1.37 | 18d | 1 | 1.25mi |
| 19360 Revere St Detroit, MI | 3.0 | 1.0 | 1050 | $1,250 | $1.19 | 26d | 1 | 1.27mi |
| 19682 Rogge St Detroit, MI | 3.0 | 1.0 | 1000 | $1,350 | $1.35 | 0d | 1 | 1.29mi |
| 7568 Hudson Ave Unit 1 Warren, MI | 3.0 | 1.0 | 1415 | $1,100 | $0.78 | 6d | 1 | 1.31mi |
| 7568 Hudson Ave Unit 2 Warren, MI | 2.0 | 1.0 | 1415 | $900 | $0.64 | 6d | 1 | 1.31mi |
| 19691 Cliff St #1 Detroit, MI | 2.0 | 1.0 | 850 | $1,000 | $1.18 | 0d | 1 | 1.31mi |
| 18677 Moenart St Detroit, MI | 2.0 | 1.0 | 1470 | $1,200 | $0.82 | 45d | 1 | 1.32mi |
| 21155 Warner Ave Warren, MI | 2.0 | 1.0 | 756 | $1,029 | $1.36 | 26d | 1 | 1.32mi |
| 8065 Meadow Ave Warren, MI | 2.0 | 1.0 | 800 | $1,050 | $1.31 | 26d | 1 | 1.38mi |
| 3840 Bart Ave Warren, MI | 3.0 | 1.0 | 1062 | $1,350 | $1.27 | 26d | 1 | 1.38mi |
| 18662 Sunset St Detroit, MI | 2.0 | 1.0 | 726 | $1,250 | $1.72 | 19d | 1 | 1.43mi |
| 8162 Orchard Ave Warren, MI | 2.0 | 1.0 | 900 | $1,000 | $1.11 | 45d | 1 | 1.47mi |
Listing history 50 events
-
2026-06-21days on market $134,900 Active 38 DOM
-
2026-06-18days on market $134,900 Active 35 DOM
-
2026-06-17days on market $134,900 Active 34 DOM
-
2026-06-16days on market $134,900 Active 33 DOM
-
2026-06-15days on market $134,900 Active 32 DOM
-
2026-06-13days on market $134,900 Active 30 DOM
-
2026-06-13days on market $134,900 Active 29 DOM
-
2026-06-09days on market $134,900 Active 26 DOM
-
2026-06-08days on market $134,900 Active 25 DOM
-
2026-06-07days on market $134,900 Active 24 DOM
-
2026-06-04days on market $134,900 Active 21 DOM
-
2026-06-03days on market $134,900 Active 20 DOM
-
2026-06-02days on market $134,900 Active 19 DOM
-
2026-06-01days on market $134,900 Active 18 DOM
-
2026-05-31days on market $134,900 Active 17 DOM
-
2026-05-15$134,900 Active 517-char remark
Show marketing remark (517 chars)
Beautifully updated and city-certified home featuring a brand-new roof, new flooring, and fresh paint throughout. This move-in-ready property offers 2 comfortable bedrooms plus a spacious family room that can be used as a third bedroom or additional living space, along with 1.5 bathrooms. Enjoy a bright kitchen and large living area perfect for everyday living and entertaining. Conveniently located near schools, shopping, and major roads, this home is a great opportunity for first-time buyers or investors alike.
-
2026-05-14historical $134,900 517-char remark
Show marketing remark (517 chars)
Beautifully updated and city-certified home featuring a brand-new roof, new flooring, and fresh paint throughout. This move-in-ready property offers 2 comfortable bedrooms plus a spacious family room that can be used as a third bedroom or additional living space, along with 1.5 bathrooms. Enjoy a bright kitchen and large living area perfect for everyday living and entertaining. Conveniently located near schools, shopping, and major roads, this home is a great opportunity for first-time buyers or investors alike.
-
2026-05-10historical
-
2026-05-10historical
-
2026-02-26$159,900 Active
-
2026-02-26$159,900 Active
-
2026-01-23historical
-
2025-11-08$159,900 Active
-
2025-11-08$159,900 Active
-
2025-07-28soldstatus $85,900
-
2025-07-23soldstatus $85,900 Closed
-
2025-07-23soldstatus $85,900 Closed
-
2025-07-07status Pending
-
2025-07-07status Pending
-
2025-06-26$69,900 Active
-
2025-06-26$69,900 Active
-
2012-03-05soldstatus $10,100
-
2012-03-05soldstatus $10,100
-
2012-02-24historical
-
2012-02-24historical
-
2011-09-27$12,500
-
2011-09-27$12,500
-
2007-04-30historical
-
2007-04-30historical
-
2006-05-18$94,900
-
2006-05-16historical
-
2006-05-15$94,900
-
2006-05-15historical
-
2005-10-13historical
-
2005-10-13historical
-
2005-10-11$94,900
-
2005-10-11historical
-
2005-10-10$94,900
-
2005-08-16$94,900
ⓘ Source: listings_history table (triggers on properties + properties_extension) + one-shot
backfill from property_details.listing_events for pre-trigger history.
Tax reassessment forecast MI · Partial reset (capped growth)
- Current annual tax
- $1,522 · $127/mo
- Projected year-2 tax
- $1,800 · $150/mo
- Expected delta
- +$278/yr (+$23/mo · 18.2%)
ⓘ Screening estimate from a state-policy table — verify with the county assessor before closing.
Climate risk First Street
- Flood 7/10 Severe FEMA zone X (unshaded) · 99% chance over 30 yrs
- Wildfire 1/10 Low
- Heat 3/10 Moderate 7 d/yr ≥97°F today · 15 d/yr by 30 yrs out
- Wind 1/10 Low
- Air quality 3/10 Moderate 3 unhealthy d/yr today · 5 by 30 yrs out
Nearby sold comps map
Loading sold comps map…
Walkable amenities ~0.75 mi
Loading nearby amenities…
Taxation est. · year 1
- Rental income
- $16,194
- − Mortgage interest
- −$7,556
- − Property taxes
- −$1,522
- − Insurance
- −$1,341
- − Repairs & maintenance
- −$1,295
- − Management
- −$1,295
- − Depreciation
- −$3,924
- Taxable loss
- −$742
- Est. tax savings @ 24.0%
- +$178
- After-tax cash flow
- $1,618/yr
For passive investors: Depreciation is non-cash, so a rental often shows a tax loss while cash-flowing — sheltering income. Rental losses are passive: they offset passive income freely, and up to $25,000/yr can offset ordinary (W-2) income if you actively participate and your MAGI is under $100k (phasing out to $0 by $150k); unused losses carry forward. On sale, claimed depreciation is recaptured at up to 25%, and gains may owe capital-gains tax (a 1031 exchange can defer both). Figures are a year-1 estimate at your 24.0% rate — not tax advice; consult a CPA.
Schools (NCES district)
- District
- Fitzgerald Public Schools
- NCES district ID
- 2614460
- Math proficiency
- 8% ▼ -8.00%
- Reading proficiency
- 23% ▼ -11.00%
- Median HH income
- $34,828
- Composite
- 12.67/100
- National rank
- #9608
- State rank
- #503 of 540 in MI
Livability — Warren
- Score
- 74/100
- State rank
- #171
- US rank
- #4491
Category grades
Schools grade is shown separately in the Schools card above.
Census & demographics
- Census place
- Warren, MI
- County
- Macomb County · 638,552 people
- City population
- 114,937
- Metro
- Detroit-Warren-Dearborn, MI
- Population (ZIP)
- 30,696
- Household income
- $54,230
- Rent vs Own
- Severe rent burden
- 1296.0
Population outlook (Macomb County) Hauer SSP2
- Today (2025)
- 925,296 people
- By 2030
- 948,226 · +2.5%
- By 2040
- 983,961 · +6.3%
- By 2050
- 1,010,200 · +9.2%
- By 2075
- 1,076,222 · +16.3%
- By 2100
- 1,077,065 · +16.4%
Race, ethnicity, and origin ACS 2023
- Neighborhood character
- Diverse neighborhood (Simpson 0.68)
- Race & ethnicity
- White 47% Black 25% Asian 19% Two or more races 5% Hispanic / Latino 3% Native American 2%
- Common ancestry
- Romanian 7% Lithuanian 2% Slovak 1%
- Foreign-born
- 16% · Canada
- Languages at home
- 77% English-only · Other Indo-European 14% Other Asian/Pacific 3% Russian/Polish/Slavic 2%
Political lean MEDSL · Macomb
- 2024 margin
- R (+13.7) · D 42.2% · R 55.9% · Other 1.9%
- 2008→2024 swing
- -22.3pp toward R · 2008: 8.6pp · 2024: -13.7pp
- All cycles
- 2024: R+13.7 2020: R+8.1 2016: R+11.6 2012: D+4.0 2008: D+8.6
Not yet ingested
- Civics
- —
Market trends
- HPI YoY
- ▼ -199.66%
- Current HPI
- 177.9273
- Rent YoY
- ▲ 2.35%
- Metro
- Detroit-Warren-Dearborn, MI
- State GDP YoY
- ▲ 1.37%
- F500 in state
- 28
Industry mix (Fortune 500 HQ in MI)
| Industry | F500 HQs | Revenue |
|---|---|---|
| Automotive Parts | 3 | $48B |
|
||
| Automotive | 2 | $372B |
|
||
| Chemicals | 1 | $45B |
|
||
| Automotive Retail | 1 | $29B |
|
||
| Healthcare / Medical Devices | 1 | $23B |
|
||
| Automotive Technology | 1 | $20B |
|
||
Price history
+199.8% since first listed44 events — show timeline
- 2026-05-15 Listed $134,900 MiRealSource-MiMLS
- 2026-05-15 Listed $134,900 REALCOMP
- 2026-05-14 Coming Soon $134,900 MiRealSource-MiMLS
- 2026-05-10 Listing Removed — REALCOMP
- 2026-05-10 Listing Removed — MiRealSource-MiMLS
- 2026-02-26 Listed $159,900 REALCOMP
- 2026-02-26 Listed $159,900 MiRealSource-MiMLS
- 2026-01-23 Listing Removed — MiRealSource-MiMLS
- 2025-11-08 Listed $159,900 REALCOMP
- 2025-11-08 Listed $159,900 MiRealSource-MiMLS
- 2025-07-28 Sold (Public Records) $85,900 Public Records
- 2025-07-23 Sold (MLS) $85,900 REALCOMP
- 2025-07-23 Sold (MLS) $85,900 MiRealSource-MiMLS
- 2025-07-07 Pending — MiRealSource-MiMLS
- 2025-07-07 Pending — REALCOMP
- 2025-06-26 Listed $69,900 REALCOMP
- 2025-06-26 Listed $69,900 MiRealSource-MiMLS
- 2012-03-05 Sold (MLS) $10,100 REALCOMP
- 2012-03-05 Sold (MLS) $10,100 MiRealSource-MiMLS
- 2012-02-24 Listing Removed — REALCOMP
- 2012-02-24 Listing Removed — MiRealSource-MiMLS
- 2011-09-27 Listed $12,500 REALCOMP
- 2011-09-27 Listed $12,500 MiRealSource-MiMLS
- 2007-04-30 Listing Removed — MiRealSource-MiMLS
- 2007-04-30 Listing Removed — REALCOMP
- 2006-05-18 Listed $94,900 REALCOMP
- 2006-05-16 Listing Removed — MiRealSource-MiMLS
- 2006-05-15 Listing Removed — REALCOMP
- 2006-05-15 Listed $94,900 MiRealSource-MiMLS
- 2005-10-13 Listing Removed — REALCOMP
- 2005-10-13 Listing Removed — MiRealSource-MiMLS
- 2005-10-11 Listing Removed — MiRealSource-MiMLS
- 2005-10-11 Listed $94,900 REALCOMP
- 2005-10-10 Listed $94,900 MiRealSource-MiMLS
- 2005-08-16 Listed $94,900 MiRealSource-MiMLS
- 2005-08-15 Listed $94,900 REALCOMP
- 2004-10-08 Listed $98,900 MiRealSource-MiMLS
- 1999-03-10 Sold (Public Records) $40,477 Public Records
- 1998-05-04 Listing Removed — REALCOMP
- 1998-03-08 Listed $72,900 REALCOMP
- 1995-07-20 Sold (Public Records) $43,500 Public Records
- 1995-06-23 Sold (MLS) $43,500 MiRealSource-MiMLS
- 1995-03-14 Listing Removed — MiRealSource-MiMLS
- 1995-03-13 Listed $44,990 MiRealSource-MiMLS
Property tax history
+5.1%/yrLatest (2025): $1,522 · +2.6% YoY. Source: county tax records.
Cash-flow waterfall
monthlySold comps — $/sqft
last 12 mo · ≤1 miLoading sold comps…