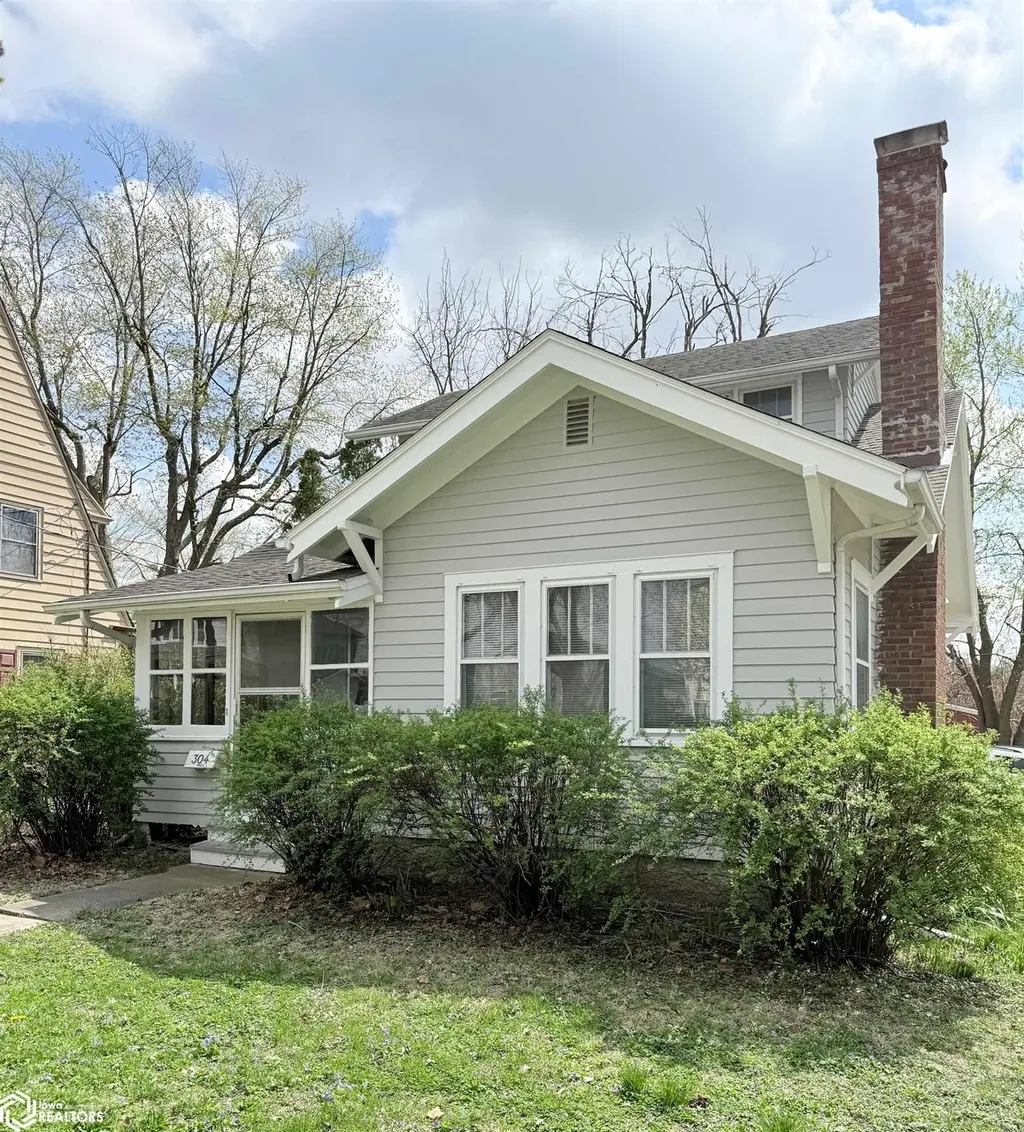
304 E Kirkwood Ave Ave · Fairfield, IA
Flood risk 1/10 · Minimal
- FEMA flood zone
- X (unshaded)
- Chance of flooding over 30 yrs
- 0.0%
- Est. flood insurance / yr
- $473 – $860
Fire risk 2/10 · Minimal
- Est. fire insurance / yr
- $902 – $1,676
Heat risk 3/10 · Minor
- Hot days now (above 107°F)
- 7 days/yr
- Hot days in 30 yrs
- 15 days/yr
Wind risk 2/10 · Minimal
- Chance of severe wind over 30 yrs
- —
Air-quality risk 2/10 · Minimal
- Unhealthy air days now
- 1 days/yr
- Unhealthy air days in 30 yrs
- 2 days/yr
Risk factors via First Street. Map © Google.
Why this score? — see what drove the C+ grade
The composite is a weighted blend of 9 inputs, each scored 0–100. Each bar is that input's sub-score; the figure is the points it added to the 100-point composite (weight × sub-score).
- Cash flow +21.8/30.0
- ARV discount +13.0/15.0
- DSCR +7.0/10.0
- 1% rule +5.8/10.0
- Schools +5.3/10.0
- Livability +4.0/5.0
- Rent growth +2.5/5.0
- Condition / age +2.5/5.0
- Appreciation +0.0/10.0
$117,500
🖨 Deal sheet 📄 Offer letter ✓ Due diligence
Listing remarks MLS
Charming Craftsman-style home full of character and ready for new owners! This home features original hardwood floors and beautifully preserved woodwork, along with French doors, a cozy fireplace, and a galley-style kitchen. The main level offers 2 bedrooms and 1 full bathroom. The upper level includes a separate entrance to an efficiency apartment with 1 bedroom and 1 bathroom—perfect for generating additional income or accommodating guests. If you’re looking for a home with charm and potential, this is one to add to your list!
Key facts
- Galley-style kitchen
- Craftsman-style home
- French doors
Tags
Neighborhood map
What this means for you Summary
Snapshot
- This is a 3-bed/2.0-bath single-family listed at $118k.
Deal economics
- At list price, monthly cash flow is $184 ($2k/yr) — positive.
- The deal already cash-flows at list — no discount required.
- Meets the 1% rule at list price ($1k rent vs $118k).
- Recommended offer: $114k (3.0% below list) — sets the bar for market timing.
- Cap rate 8.2% vs local median 3.0% in Fairfield — top-decile yield for the area; either an underpriced asset or a hidden risk that comps aren't pricing in. Stress-test before assuming the spread holds.
Location & tenants
- Location reads 79/100 on livability (#122 in IA, #2,265 nationally) — a middle-class / working-renter tenant base. Strengths: crime A+, cost of living A+, housing A+; Watch: amenities F, commute F, employment F.
- Fairfield Community School District (town): math 56% / reading 69% proficiency, ranked #227 of 289 in IA (top 78%) — acceptable for families but not a draw, mixed tenant base, ~2y average lease.
- Market conditions: 120 active listings in the ZIP; 14 units permitted in Jefferson County in 2024 (0 in 5+ unit buildings).
Forward outlook
- Local home prices are declining (-3.0%/yr); year-one equity from $812 of loan paydown is wiped out by about $4k of value loss. Plan a longer hold.
- Jefferson County population projected at +27% by 2050 — long-run rental-demand tailwind backs the buy-and-hold thesis.
Negotiation context
- It's been on market 39 days — a 3% lower offer ($114k) is reasonable based on typical stale-listing flexibility.
- 2 sale attempts; this cycle's ask has dropped $7k (6%) from the opening price — seller is motivated, your offer sets the floor, not the list.
Risks & watch-outs
- Watch-outs: built in 1929 — expect roof / HVAC / electrical / plumbing capex.
Questions for the listing agent
- It's been on market 39 days. Have you received any prior offers? Is the seller open to a 3% concession, seller financing, or rate buy-down credit?
- Built in 1929 — when were the roof, HVAC, electrical panel, plumbing, and water heater last replaced?
- Is there a deadline driving the sale (1031 exchange, divorce, estate, relocation)? That informs how much negotiation room exists.
- Schools are A-rated — typically a magnet for longer-tenancy family renters. What's the average tenant stay here, and is there a school-zone premium baked into asking?
- What's the average days-on-market for RENTAL listings here right now (not sales)? A rising rental-DOM trend means longer vacancies and softer asking-rent achievability than the comps imply.
- What's the recent tenant-quality profile in this submarket — average credit score on applications, eviction rate, late-payment / NSF rate, and stable-employment percentage? A property-management company in the area should have these aggregated.
- How much new for-sale + rental construction is in the pipeline within 1–3 miles? Heavy new supply typically softens prices + rents 12–24 months out; constrained supply supports both.
Investment metrics
- 1% rule
- 1.08% ✓
- Cap rate
- 8.17%
- Cash-on-cash
- 6.70%
- DSCR
- 1.30
- GRM
- 7.7
CMA / ARV
- ARV (median comp)
- $133,965
- List price
- $117,500
- Delta
- -12.29%
- Verdict
- UNDERPRICED
- Comps
- 20 within 1.0 mi
Show comp detail 12 sales within ~0.75 mi
| Address | Dist | Beds/Ba | Sqft | Sold | Price | $/sf | Match |
|---|---|---|---|---|---|---|---|
| 304 E Kirkwood Ave Ave | 0.00mi | 3/2.0 | 1,308 (0%) | 0mo | $105,000 | $80 | 100 |
| 501 E Burlington Ave | 0.42mi | 2/1.5 (-1) | 1,399 (+7%) | 1mo | $183,750 | $131 | 61 |
| 302 W Stone Ave | 0.40mi | 3/2.0 | 1,423 (+9%) | 7mo | $170,000 | $119 | 61 |
| 504 N Main St | 0.25mi | 3/1.0 | 1,491 (+14%) | 0mo | $60,000 | $40 | 60 |
| 305 W Jefferson Ave | 0.73mi | 3/2.5 | 1,308 (0%) | 9mo | $180,000 | $138 | 57 |
| 701 E Lowe Ave #204 | 0.23mi | 3/2.0 | 1,129 (-14%) | 15mo | $53,500 | $47 | 54 |
| 304 W Adams Ave | 0.70mi | 3/2.0 | 1,388 (+6%) | 6mo | $141,500 | $102 | 52 |
| 706 E Burlington Ave | 0.52mi | 3/1.0 | 1,152 (-12%) | 1mo | $135,000 | $117 | 51 |
| 103 W Washington Ave | 0.55mi | 3/2.5 | 1,474 (+13%) | 6mo | $182,500 | $124 | 46 |
| 108 E Adams Ave | 0.58mi | 3/1.0 | 1,142 (-13%) | 12mo | $50,000 | $44 | 38 |
| 504 S D St | 0.71mi | 3/1.0 | 1,168 (-11%) | 9mo | $149,000 | $128 | 38 |
| 1000 Pleasant Plain Rd #202 | 0.56mi | 2/1.5 (-1) | 1,136 (-13%) | 13mo | $175,000 | $154 | 35 |
Match score weights: distance 35% · size 25% · config 20% · recency 20%. Top-matched comps best support the ARV.
Projected returns pro-forma
-3.0% appreciation · 3.0% rent growth · sell at horizon
- IRR
- -6.0%
- Equity multiple
- 0.78×
- Total profit
- $-7,322
- Equity at exit
- $17,520
- IRR
- 3.7%
- Equity multiple
- 1.27×
- Total profit
- $8,772
- Equity at exit
- $10,159
Cash invested: $32,900 (down + closing). Projections, not guarantees.
Landlord ↔ Tenant lean methodology
- Overall (STATE)
- 83 Strongly Landlord-Friendly
- State Iowa
- 83 Strongly Landlord-Friendly · R+6
- County
- — inherits STATE
- City
- — inherits STATE
ZIP-level market 52556
- Home prices YoY
- -15.1%
- Active inventory
- 120
- Price-to-rent
- 7.7×
Monthly cashflow live
- Estimated rent
- $1,265 medium interval (Pro) →
- Mortgage (P&I)
- −$616
- Tax from tax record
- −$150 /mo · $1,806/yr
- Insurance
- −$49
- HOA
- −$0
- Vacancy / Maint / Mgmt
- −$266
- Net cashflow
- $184
Break-even live
UW: 25.0% down · 7.5% · 30yr · 1.5% tax · 5.0% vac · 8.0% maint · 8.0% mgmt
Financing live
Cash to close
- Down payment
- $29,375
- Closing costs
- $3,525
- Reserves months
- —
- Total cash needed
- —
Loan-product check · same deal, 3 products live
Conventional
25% down · 7.5% · 30yr
- Down + closing
- —
- Monthly P&I
- —
- Monthly cashflow
- —
- DSCR
- —
- Eligible?
- —
Personal DTI + credit; lowest rate.
DSCR
20% down · 8.5% · 30yr
- Down + closing
- —
- Monthly P&I
- —
- Monthly cashflow
- —
- DSCR
- —
- Eligible?
- —
No personal income docs; deal must DSCR.
Hard money
10% down · 12.0% · 12mo
- Down + closing
- —
- Monthly P&I
- —
- Monthly cashflow
- —
- DSCR
- —
- Eligible?
- —
Short-term bridge; refi at stabilization.
Listing history 7 events
-
2026-05-19price $117,500 546-char remark
Show marketing remark (546 chars)
Charming Craftsman-style home full of character and ready for new owners! This home features original hardwood floors and beautifully preserved woodwork, along with French doors, a cozy fireplace, and a galley-style kitchen. The main level offers 2 bedrooms and 1 full bathroom. The upper level includes a separate entrance to an efficiency apartment with 1 bedroom and 1 bathroom—perfect for generating additional income or accommodating guests. If you’re looking for a home with charm and potential, this is one to add to your list!
-
2026-04-16$124,500 Active 546-char remark
Show marketing remark (546 chars)
Charming Craftsman-style home full of character and ready for new owners! This home features original hardwood floors and beautifully preserved woodwork, along with French doors, a cozy fireplace, and a galley-style kitchen. The main level offers 2 bedrooms and 1 full bathroom. The upper level includes a separate entrance to an efficiency apartment with 1 bedroom and 1 bathroom—perfect for generating additional income or accommodating guests. If you’re looking for a home with charm and potential, this is one to add to your list!
-
2025-10-10price $139,900
-
2025-08-29price $154,000
-
2025-08-09price $159,000
-
2025-05-20price $167,000
-
2025-04-30$172,000 Active
ⓘ Source: listings_history table (triggers on properties + properties_extension) + one-shot
backfill from property_details.listing_events for pre-trigger history.
Tax reassessment forecast IA · Partial reset (capped growth)
- Current annual tax
- $1,806 · $150/mo
- Projected year-2 tax
- $1,825 · $152/mo
- Expected delta
- +$19/yr (+$2/mo · 1.1%)
ⓘ Screening estimate from a state-policy table — verify with the county assessor before closing.
Climate risk First Street
- Flood 1/10 Low FEMA zone X (unshaded) · 0% chance over 30 yrs
- Wildfire 2/10 Low
- Heat 3/10 Moderate 7 d/yr ≥107°F today · 15 d/yr by 30 yrs out
- Wind 2/10 Low
- Air quality 2/10 Low 1 unhealthy d/yr today · 2 by 30 yrs out
Nearby sold comps map
Loading sold comps map…
Walkable amenities ~0.75 mi
Loading nearby amenities…
Taxation est. · year 1
- Rental income
- $15,179
- − Mortgage interest
- −$6,582
- − Property taxes
- −$1,806
- − Insurance
- −$588
- − Repairs & maintenance
- −$1,214
- − Management
- −$1,214
- − Depreciation
- −$3,418
- Taxable income
- $357
- Est. tax owed @ 24.0%
- −$86
- After-tax cash flow
- $2,118/yr
For passive investors: Depreciation is non-cash, so a rental often shows a tax loss while cash-flowing — sheltering income. Rental losses are passive: they offset passive income freely, and up to $25,000/yr can offset ordinary (W-2) income if you actively participate and your MAGI is under $100k (phasing out to $0 by $150k); unused losses carry forward. On sale, claimed depreciation is recaptured at up to 25%, and gains may owe capital-gains tax (a 1031 exchange can defer both). Figures are a year-1 estimate at your 24.0% rate — not tax advice; consult a CPA.
Schools (NCES district)
- District
- Fairfield Community School District
- NCES district ID
- 1911340
- Math proficiency
- 56% ▼ -14.00%
- Reading proficiency
- 69% ▲ 3.00%
- Median HH income
- $43,980
- Composite
- 52.52/100
- National rank
- #1563
- State rank
- #227 of 289 in IA
Livability — Fairfield
- Score
- 79/100
- State rank
- #122
- US rank
- #2265
Category grades
Schools grade is shown separately in the Schools card above.
Census & demographics
- Census place
- Fairfield, IA
- City population
- 615
- Population (ZIP)
- 11,586
Population outlook (Jefferson County) Hauer SSP2
- Today (2025)
- 20,818 people
- By 2030
- 22,098 · +6.1%
- By 2040
- 24,133 · +15.9%
- By 2050
- 26,448 · +27.0%
- By 2075
- 32,435 · +55.8%
- By 2100
- 33,966 · +63.2%
Race, ethnicity, and origin ACS 2023
- Neighborhood character
- Predominantly White (81%)
- Race & ethnicity
- White 81% Black 7% Hispanic / Latino 5% Asian 5% Two or more races 3% Native American 1%
- Common ancestry
- Italian 6% Slovak 4% Portuguese 3%
- Foreign-born
- 12% · Vietnam, Canada, China
- Languages at home
- 88% English-only · Other Indo-European 3% Spanish 2% Vietnamese 2%
Political lean MEDSL · Jefferson
- 2024 margin
- Lean R (+6.8) · D 45.5% · R 52.3% · Other 2.1%
- 2008→2024 swing
- -27.0pp toward R · 2008: 20.2pp · 2024: -6.8pp
- All cycles
- 2024: R+6.8 2020: R+1.4 2016: R+0.5 2012: D+16.0 2008: D+20.2
Not yet ingested
- Civics
- —
Market trends
- HPI YoY
- ▼ -36.76%
- Current HPI
- 206.8679
- Rent YoY
- —
- Metro
- —
- State GDP YoY
- ▲ 2.48%
- F500 in state
- 4
Industry mix (Fortune 500 HQ in IA)
| Industry | F500 HQs | Revenue |
|---|---|---|
| Financial Services | 1 | $16B |
|
||
| Retail / Convenience | 1 | $15B |
|
||
Price history
-31.7% since first listed7 events — show timeline
- 2026-05-19 Price Changed $117,500 IAR
- 2026-04-16 Listed $124,500 IAR
- 2025-10-10 Price Changed $139,900 IAR
- 2025-08-29 Price Changed $154,000 IAR
- 2025-08-09 Price Changed $159,000 IAR
- 2025-05-20 Price Changed $167,000 IAR
- 2025-04-30 Listed $172,000 IAR
Property tax history
+2.1%/yrLatest (2025): $1,806 · +4.8% YoY. Source: county tax records.
Cash-flow waterfall
monthlySold comps — $/sqft
last 12 mo · ≤1 miLoading sold comps…