138 Neil Thompson Rd · Masthope, PA
Flood risk 8/10 · Major
- FEMA flood zone
- X (unshaded)
- Chance of flooding over 30 yrs
- 0.99%
- Est. flood insurance / yr
- $473 – $860
Fire risk 4/10 · Minor
- Est. fire insurance / yr
- $511 – $949
Heat risk 3/10 · Minor
- Hot days now (above 92°F)
- 7 days/yr
- Hot days in 30 yrs
- 15 days/yr
Wind risk 2/10 · Minimal
- Chance of severe wind over 30 yrs
- 3.0%
Air-quality risk 2/10 · Minimal
- Unhealthy air days now
- 1 days/yr
- Unhealthy air days in 30 yrs
- 1 days/yr
Risk factors via First Street. Map © Google.
Why this score? — see what drove the C+ grade
The composite is a weighted blend of 9 inputs, each scored 0–100. Each bar is that input's sub-score; the figure is the points it added to the 100-point composite (weight × sub-score).
- Cash flow +23.5/30.0
- DSCR +7.6/10.0
- ARV discount +6.2/15.0
- 1% rule +5.9/10.0
- Appreciation +5.4/10.0
- Schools +4.2/10.0
- Livability +3.2/5.0
- Rent growth +2.5/5.0
- Condition / age +2.5/5.0
$169,900
🖨 Deal sheet 📄 Offer letter ✓ Due diligence
Listing remarks
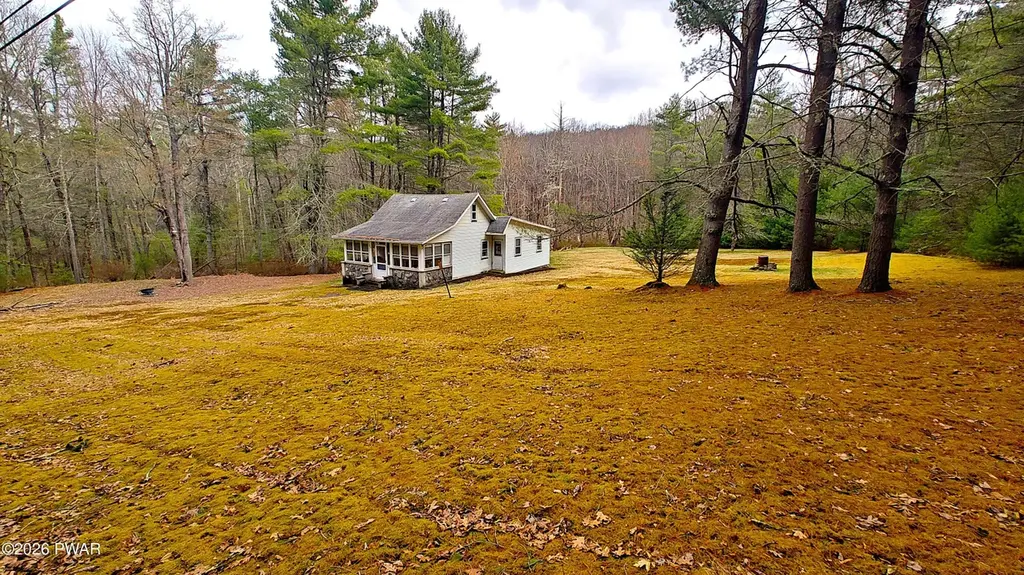
Opportunity on Over 2 Acres - Privacy & Potential!Don't miss this opportunity to own just over 2 acres of private land, with a large portion cleared, offering space, usability, and room to expand. This 3-bedroom, 1-bath home is in need of renovation and is being sold as-is, with all contents included. Whether you're looking for a full restoration project, a weekend getaway transformation, or a future homesite, the possibilities here are wide open. Tucked away in a quiet setting, the property provides excellent privacy while still offering a more open feel thanks to the cleared areas--ideal for outdoor use, storage, or future improvements. With an attractive price point, this property
Key facts
- Excellent privacy
- Private land
- Outdoor use
Tags
Property features AI
Exterior
- Parking: On-site private parking
- Utilities: Private well water; Septic tank sewer; Electricity connected; Cable available
- Home design: Single family residence; Two levels; Residential zoning; Property listed as fixer and currently vacant
- Construction: Aluminum siding and frame construction; Block foundation; Built area above grade noted
- Exterior features: Covered, enclosed porch/patio; Front yard and back yard; level, cleared lot; Privacy and front yard fencing; Shingle roof; Shed(s); Has view; Paved road access
Interior
- Kitchen: Gas cooktop
- Bedrooms: 5 total rooms (bedroom count not specified)
- Flooring: Carpet; Laminate
- Bathrooms: 1 full bathroom
- Heating & cooling: Ceiling fan(s); no central heating indicated; Has cooling
- Interior features: Gas cooktop; Carpet and laminate flooring; Crawl space basement
Neighborhood map
What this means for you Summary
Snapshot
- This is a 2-bed/1.0-bath single-family listed at $170k.
Deal economics
- At list price, monthly cash flow is $262 ($3k/yr) — positive.
- The deal already cash-flows at list — no discount required.
- Meets the 1% rule at list price ($2k rent vs $170k).
- Recommended offer: $165k (3.0% below list) — sets the bar for market timing.
- Cap rate 8.5% vs local median 3.2% in Masthope — top-decile yield for the area; either an underpriced asset or a hidden risk that comps aren't pricing in. Stress-test before assuming the spread holds.
Location & tenants
- Location reads 63/100 on livability (#1,276 in PA) — a middle-class / working-renter tenant base. Strengths: crime A+, housing A+, employment A-; Watch: schools D, amenities F, commute F.
- Wallenpaupack Area SD (rural): math 39% / reading 59% proficiency, ranked #192 of 539 in PA (top 36%) — families likely to look elsewhere, expect single-tenant / working-renter base with shorter leases.
- Market conditions: 60 active listings in the ZIP; 213 units permitted in Pike County in 2024 (0 in 5+ unit buildings).
Forward outlook
- In year one you build about $2k of equity ($1k loan paydown + $1k appreciation (0.7% local appreciation)).
- Pike County population projected at -25% by 2050 — secular population decline; favor cash flow + early exit over multi-decade hold.
- At projected returns (0.7% appreciation + 3.0% rent growth), your $48k cash investment doubles in ~7 years — after that, you're playing with house money.
Negotiation context
- It's been on market 55 days — a 3% lower offer ($165k) is reasonable based on typical stale-listing flexibility.
Risks & watch-outs
- Watch-outs: flood insurance adds $56/mo; built in 1934 — expect roof / HVAC / electrical / plumbing capex.
- Climate carrying-cost: severe flood risk — expect insurance premiums to compound above CPI over the hold.
Questions for the listing agent
- It's been on market 55 days. Have you received any prior offers? Is the seller open to a 3% concession, seller financing, or rate buy-down credit?
- Built in 1934 — when were the roof, HVAC, electrical panel, plumbing, and water heater last replaced?
- What's the actual annual flood-insurance premium (NFIP or private), and is the property in a SFHA with mandatory coverage?
- Is there a deadline driving the sale (1031 exchange, divorce, estate, relocation)? That informs how much negotiation room exists.
- Schools are D-rated, which usually means shorter tenancies and higher turnover. Who's the typical renter profile here, and what's been the actual vacancy rate?
- What's the average days-on-market for RENTAL listings here right now (not sales)? A rising rental-DOM trend means longer vacancies and softer asking-rent achievability than the comps imply.
- What's the recent tenant-quality profile in this submarket — average credit score on applications, eviction rate, late-payment / NSF rate, and stable-employment percentage? A property-management company in the area should have these aggregated.
- How much new for-sale + rental construction is in the pipeline within 1–3 miles? Heavy new supply typically softens prices + rents 12–24 months out; constrained supply supports both.
Investment metrics
- 1% rule
- 1.09% ✓
- Cap rate
- 8.53%
- Cash-on-cash
- 8.01%
- DSCR
- 1.36
- GRM
- 7.7
CMA / ARV
- ARV (median comp)
- $165,186
- List price
- $169,900
- Delta
- 2.85%
- Verdict
- FAIR
- Comps
- 4 within 2.0 mi
Projected returns pro-forma
0.7% appreciation · 3.0% rent growth · sell at horizon
- IRR
- 7.3%
- Equity multiple
- 1.37×
- Total profit
- $17,426
- Equity at exit
- $55,375
- IRR
- 11.7%
- Equity multiple
- 2.38×
- Total profit
- $65,721
- Equity at exit
- $71,600
Cash invested: $47,572 (down + closing). Projections, not guarantees.
Landlord ↔ Tenant lean methodology
- Overall (STATE)
- 62 Landlord-Friendly
- State Pennsylvania
- 62 Landlord-Friendly · EVEN
- County
- — inherits STATE
- City
- — inherits STATE
ZIP-level market 18435
- Home prices YoY
- 0.3%
- Active inventory
- 60
- Price-to-rent
- 7.7×
Monthly cashflow live
- Estimated rent
- $1,847 medium interval (Pro) →
- Mortgage (P&I)
- −$891
- Tax from tax record
- −$180 /mo · $2,156/yr
- Insurance
- −$71
- Flood insurance flood zone
- −$56 /mo · $666/yr
- HOA
- −$0
- Vacancy / Maint / Mgmt
- −$388
- Net cashflow
- $262
Break-even live
UW: 25.0% down · 7.5% · 30yr · 1.5% tax · 5.0% vac · 8.0% maint · 8.0% mgmt
Financing live
Cash to close
- Down payment
- $42,475
- Closing costs
- $5,097
- Reserves months
- —
- Total cash needed
- —
Loan-product check · same deal, 3 products live
Conventional
25% down · 7.5% · 30yr
- Down + closing
- —
- Monthly P&I
- —
- Monthly cashflow
- —
- DSCR
- —
- Eligible?
- —
Personal DTI + credit; lowest rate.
DSCR
20% down · 8.5% · 30yr
- Down + closing
- —
- Monthly P&I
- —
- Monthly cashflow
- —
- DSCR
- —
- Eligible?
- —
No personal income docs; deal must DSCR.
Hard money
10% down · 12.0% · 12mo
- Down + closing
- —
- Monthly P&I
- —
- Monthly cashflow
- —
- DSCR
- —
- Eligible?
- —
Short-term bridge; refi at stabilization.
Listing history 15 events
-
2026-06-18days on market $169,900 Active 55 DOM
-
2026-06-17days on market $169,900 Active 54 DOM
-
2026-06-16days on market $169,900 Active 53 DOM
-
2026-06-15days on market $169,900 Active 52 DOM
-
2026-06-13days on market $169,900 Active 50 DOM
-
2026-06-13pricedays on market $169,900 Active 49 DOM
-
2026-06-09days on market $179,900 Active 46 DOM
-
2026-06-08days on market $179,900 Active 45 DOM
-
2026-06-07days on market $179,900 Active 44 DOM
-
2026-06-04days on market $179,900 Active 41 DOM
-
2026-06-03days on market $179,900 Active 40 DOM
-
2026-06-02days on market $179,900 Active 39 DOM
-
2026-06-01days on market $179,900 Active 38 DOM
-
2026-05-31days on market $179,900 Active 37 DOM
-
2026-04-24$179,900 Active 1007-char remark
ⓘ Source: listings_history table (triggers on properties + properties_extension) + one-shot
backfill from property_details.listing_events for pre-trigger history.
Tax reassessment forecast PA · Partial reset (capped growth)
- Current annual tax
- $2,156 · $180/mo
- Projected year-2 tax
- $2,420 · $202/mo
- Expected delta
- +$264/yr (+$22/mo · 12.2%)
ⓘ Screening estimate from a state-policy table — verify with the county assessor before closing.
Climate risk First Street
- Flood 8/10 Severe FEMA zone X (unshaded) · 99% chance over 30 yrs
- Wildfire 4/10 Moderate
- Heat 3/10 Moderate 7 d/yr ≥92°F today · 15 d/yr by 30 yrs out
- Wind 2/10 Low 3% chance of damaging wind over 30 yrs
- Air quality 2/10 Low 1 unhealthy d/yr today · 1 by 30 yrs out
Nearby sold comps map
Loading sold comps map…
Walkable amenities ~0.75 mi
Loading nearby amenities…
Taxation est. · year 1
- Rental income
- $22,159
- − Mortgage interest
- −$9,517
- − Property taxes
- −$2,156
- − Insurance
- −$1,516
- − Repairs & maintenance
- −$1,773
- − Management
- −$1,773
- − Depreciation
- −$4,943
- Taxable income
- $482
- Est. tax owed @ 24.0%
- −$116
- After-tax cash flow
- $3,026/yr
For passive investors: Depreciation is non-cash, so a rental often shows a tax loss while cash-flowing — sheltering income. Rental losses are passive: they offset passive income freely, and up to $25,000/yr can offset ordinary (W-2) income if you actively participate and your MAGI is under $100k (phasing out to $0 by $150k); unused losses carry forward. On sale, claimed depreciation is recaptured at up to 25%, and gains may owe capital-gains tax (a 1031 exchange can defer both). Figures are a year-1 estimate at your 24.0% rate — not tax advice; consult a CPA.
Schools (NCES district)
- District
- Wallenpaupack Area SD
- NCES district ID
- 4224750
- Math proficiency
- 39% ▼ -10.00%
- Reading proficiency
- 59% ▼ -5.00%
- Median HH income
- $51,027
- Composite
- 41.97/100
- National rank
- #3345
- State rank
- #192 of 539 in PA
Livability — Masthope
- Score
- 63/100
- State rank
- #1276
- US rank
- #15402
Category grades
Schools grade is shown separately in the Schools card above.
Census & demographics
- Population (ZIP)
- 906
Population outlook (Pike County) Hauer SSP2
- Today (2025)
- 53,548 people
- By 2030
- 51,622 · -3.6%
- By 2040
- 46,490 · -13.2%
- By 2050
- 40,372 · -24.6%
- By 2075
- 31,951 · -40.3%
- By 2100
- 26,821 · -49.9%
Race, ethnicity, and origin ACS 2023
- Neighborhood character
- Predominantly White (87%)
- Race & ethnicity
- White 87% Two or more races 10% Hispanic / Latino 4%
- Common ancestry
- Romanian 6% Subsaharan African 6% Serbian 4%
- Foreign-born
- 13% · Canada
- Languages at home
- 92% English-only · Russian/Polish/Slavic 5% Spanish 1% German/W. Germanic 1%
Political lean MEDSL · Pike
- 2024 margin
- Strong R (+24.1) · D 37.6% · R 61.6%
- 2008→2024 swing
- -19.8pp toward R · 2008: -4.2pp · 2024: -24.1pp
- All cycles
- 2024: R+24.1 2020: R+19.0 2016: R+26.0 2012: R+11.0 2008: R+4.2
Not yet ingested
- Civics
- —
Market trends
- HPI YoY
- ▲ 0.70%
- Current HPI
- 206.1947
- Rent YoY
- —
- Metro
- —
- State GDP YoY
- ▲ 1.68%
- F500 in state
- 34
Industry mix (Fortune 500 HQ in PA)
| Industry | F500 HQs | Revenue |
|---|---|---|
| Healthcare | 2 | $309B |
|
||
| Insurance | 2 | $27B |
|
||
| Telecommunications / Media | 1 | $124B |
|
||
| Industrial Distribution | 1 | $22B |
|
||
| Financial Services | 1 | $20B |
|
||
| Chemicals / Materials | 1 | $18B |
|
||
Price history
-5.6% since first listed2 events — show timeline
- 2026-06-12 Price Changed $169,900 PWMLS
- 2026-04-24 Listed $179,900 PWMLS
Property tax history
+2.6%/yrLatest (2026): $2,156 · +2.8% YoY. Source: county tax records.
Cash-flow waterfall
monthlySold comps — $/sqft
last 12 mo · ≤1 miLoading sold comps…