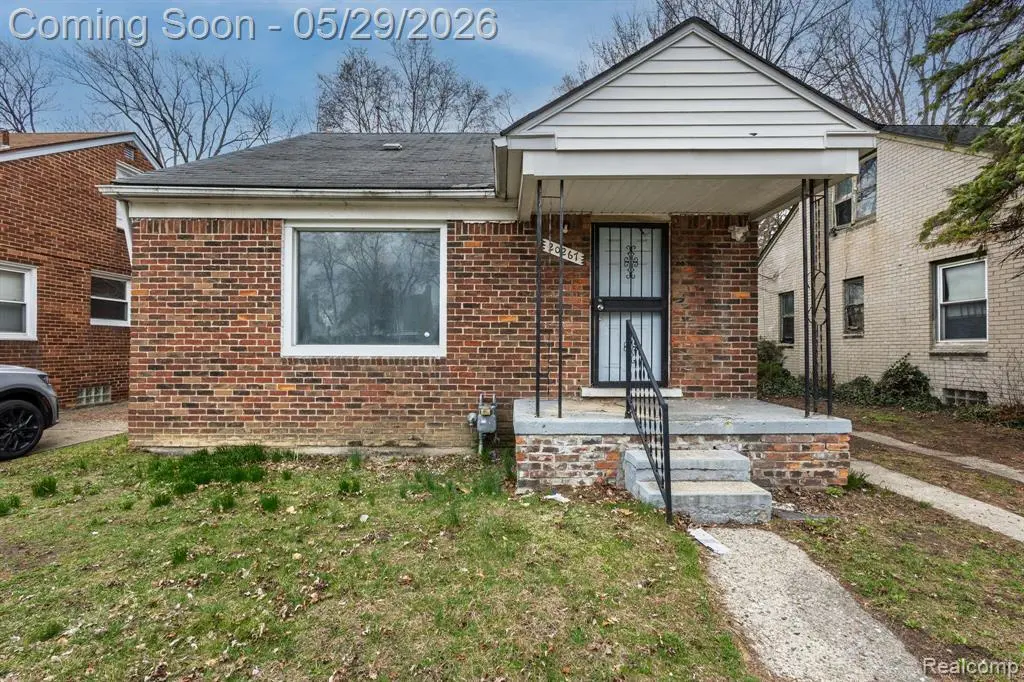
20267 Ashton Ave · Detroit, MI
Flood risk 1/10 · Minimal
- FEMA flood zone
- X (unshaded)
- Chance of flooding over 30 yrs
- 0.0%
- Est. flood insurance / yr
- $473 – $860
Fire risk 1/10 · Minimal
- Est. fire insurance / yr
- $784 – $1,456
Heat risk 2/10 · Minimal
- Hot days now (above 97°F)
- 7 days/yr
- Hot days in 30 yrs
- 14 days/yr
Wind risk 2/10 · Minimal
- Chance of severe wind over 30 yrs
- —
Air-quality risk 3/10 · Minor
- Unhealthy air days now
- 2 days/yr
- Unhealthy air days in 30 yrs
- 5 days/yr
Risk factors via First Street. Map © Google.
Why this score? — see what drove the C grade
The composite is a weighted blend of 9 inputs, each scored 0–100. Each bar is that input's sub-score; the figure is the points it added to the 100-point composite (weight × sub-score).
- Cash flow +24.6/30.0
- DSCR +7.9/10.0
- ARV discount +7.5/15.0
- 1% rule +6.1/10.0
- Rent growth +4.5/5.0
- Livability +3.7/5.0
- Condition / age +2.5/5.0
- Schools +1.3/10.0
- Appreciation +0.0/10.0
$124,900
🖨 Deal sheet (PDF) 📄 Offer letter ✓ Due diligence
Listing remarks
This 3-bedroom, 1-bath brick bungalow sits on a quiet street just steps from O'Hair Park in an established Detroit neighborhood. The 1,128 sq ft layout offers a functional floor plan with a main-floor bedrooms, an upper-level primary suite, a full basement, and a 1.5-car detached garage. Conveniently located near Southfield Road and 8 Mile with schools, parks, and everyday amenities close by — a solid opportunity in the city.
Key facts
- 5,227 sq ft lot
- Garage
- Built 1950
Property features AI
Finance
- Financial info: Property has a current lease
Exterior
- Parking: Detached 1-car garage
- Utilities: Public water; Public sewer; Natural gas; Forced air heating
- Home design: Residential 2-story home; Built in 1950; Faces within a city neighborhood (Detroit)
- Construction: Brick construction; Basement foundation
- Exterior features: Brick exterior; Paved street frontage
Interior
- Kitchen: Entry-level kitchen (10 x 8)
- Bedrooms: Second-floor primary bedroom (20 x 16); Entry-level bedroom (10 x 10); Entry-level bedroom (approx. 10 wide)
- Bathrooms: One full bathroom (entry level)
- Heating & cooling: Forced air heating; Natural gas fuel
- Interior features: Five total rooms; Unfinished basement
- Laundry & utility: Basement utilities (unfinished basement)
Neighborhood map
What this means for you Summary
Snapshot
- This is a 3-bed/1.0-bath single-family listed at $125k.
Deal economics
- At list price, monthly cash flow is $257 ($3k/yr) — positive.
- The deal already cash-flows at list — no discount required.
- Meets the 1% rule at list price ($1k rent vs $125k).
- Recommended offer: $123k (1.5% below list) — sets the bar for market timing.
Location & tenants
- Location reads 73/100 on livability (#218 in MI) — a middle-class / working-renter tenant base. Strengths: amenities A+, commute A+, cost of living A+; Watch: schools F, crime F, employment F.
- Detroit Public Schools Community District (urban): math 10% / reading 24% proficiency, ranked #499 of 540 in MI (top 92%) — low school quality limits family demand, transient renter base, plan for 1-2y turnover; 90% free/reduced lunch — lower-income household profile, screen leases tightly.
- Market conditions: Rents rising fast (+8.0%/yr); 308 active listings in the ZIP; 40 comparable units currently listed for rent nearby; rentals at typical pace (median 18d on market — plan ~3-4 weeks tenant-placement turnaround); lower-income renter base — watch delinquency; 2,639 units permitted in Wayne County in 2024 (1,216 in 5+ unit buildings).
- This rent runs 38% of the median local income ($44k/yr) — at the standard rent-burdened threshold; future hikes will face affordability resistance.
Forward outlook
- Local home prices are declining (-3.0%/yr); year-one equity from $864 of loan paydown is wiped out by about $4k of value loss. Plan a longer hold.
- Wayne County population projected at -17% by 2050 — secular population decline; favor cash flow + early exit over multi-decade hold.
- At projected returns (-3.0% appreciation + 8.0% rent growth), your $35k cash investment doubles in ~8 years — after that, you're playing with house money.
Negotiation context
- It's been on market 24 days — a 2% lower offer ($123k) is reasonable based on typical stale-listing flexibility.
- 15 sale attempts since 2y ago; this cycle's ask is 9434% above the opening price — seller raised mid-cycle; expect resistance to lowballs.
Risks & watch-outs
- Watch-outs: built in 1950 — expect roof / HVAC / electrical / plumbing capex.
Questions for the listing agent
- Built in 1950 — when were the roof, HVAC, electrical panel, plumbing, and water heater last replaced?
- Is there a deadline driving the sale (1031 exchange, divorce, estate, relocation)? That informs how much negotiation room exists.
- Schools are F-rated, which usually means shorter tenancies and higher turnover. Who's the typical renter profile here, and what's been the actual vacancy rate?
- Crime grade is F in this area — have there been break-ins, vandalism, or insurance claims at this property in the last 3 years? What carrier currently insures it and at what premium?
- What's the average days-on-market for RENTAL listings here right now (not sales)? A rising rental-DOM trend means longer vacancies and softer asking-rent achievability than the comps imply.
- What's the recent tenant-quality profile in this submarket — average credit score on applications, eviction rate, late-payment / NSF rate, and stable-employment percentage? A property-management company in the area should have these aggregated.
- How much new for-sale + rental construction is in the pipeline within 1–3 miles? Heavy new supply typically softens prices + rents 12–24 months out; constrained supply supports both.
Investment metrics
- 1% rule
- 1.11% ✓
- Cap rate
- 8.76%
- Cash-on-cash
- 8.82%
- DSCR
- 1.39
- GRM
- 7.5
CMA / ARV
- ARV (on-the-fly)
- $70,525
- Comps found
- 12
Show comp detail 12 sales within ~0.75 mi
| Address | Dist | Beds/Ba | Sqft | Sold | Price | $/sf | Match |
|---|---|---|---|---|---|---|---|
| 20569 Biltmore St | 0.46mi | 3/1.5 | 1,073 (-1%) | 2mo | $174,000 | $162 | 73 |
| 20510 Fenmore St | 0.19mi | 3/1.0 | 1,194 (+10%) | 5mo | $64,500 | $54 | 70 |
| 19950 Oakfield St | 0.37mi | 3/1.0 | 1,001 (-8%) | 5mo | $40,000 | $40 | 66 |
| 19338 Fenmore St | 0.65mi | 3/1.0 | 1,120 (+3%) | 1mo | $116,000 | $104 | 64 |
| 16442 Pembroke Ave | 0.62mi | 3/1.0 | 1,050 (-3%) | 4mo | $40,000 | $38 | 63 |
| 19481 Fenmore St | 0.50mi | 3/1.0 | 1,152 (+6%) | 5mo | $65,000 | $56 | 62 |
| 16910 Pembroke Ave | 0.59mi | 3/1.0 | 1,150 (+6%) | 1mo | $50,000 | $43 | 61 |
| 19455 Avon Ave | 0.59mi | 3/1.0 | 1,023 (-6%) | 2mo | $72,000 | $70 | 61 |
| 20004 Southfield Fwy | 0.22mi | 2/1.0 (-1) | 929 (-14%) | 1mo | $20,000 | $22 | 60 |
| 20534 Grandville Ave | 0.59mi | 3/1.5 | 1,155 (+6%) | 3mo | $213,500 | $185 | 57 |
| 19425 Faust Ave | 0.56mi | 3/1.0 | 1,000 (-8%) | 5mo | $65,000 | $65 | 56 |
| 20309 Gilchrist St | 0.39mi | 3/2.0 | 1,221 (+12%) | 5mo | $136,900 | $112 | 53 |
Match score weights: distance 35% · size 25% · config 20% · recency 20%. Top-matched comps best support the ARV.
Projected returns pro-forma
-3.0% appreciation · 8.0% rent growth · sell at horizon
- IRR
- 2.5%
- Equity multiple
- 1.10×
- Total profit
- $3,468
- Equity at exit
- $18,623
- IRR
- 16.3%
- Equity multiple
- 2.64×
- Total profit
- $57,460
- Equity at exit
- $10,799
Cash invested: $34,972 (down + closing). Projections, not guarantees.
Landlord ↔ Tenant lean methodology
- Overall (STATE)
- 62 Landlord-Friendly
- State Michigan
- 62 Landlord-Friendly · EVEN
- County
- — inherits STATE
- City
- — inherits STATE
ZIP-level market 48219
- Home prices YoY
- -10.3%
- Rents YoY
- 8.0%
- Active inventory
- 308
- Price-to-rent
- 7.5×
Monthly cashflow live
- Estimated rent
- $1,386 high interval (Pro) →
- Mortgage (P&I)
- −$655
- Tax from tax record
- −$130 /mo · $1,565/yr
- Insurance
- −$52
- HOA
- −$0
- Vacancy / Maint / Mgmt
- −$291
- Net cashflow
- $257
Break-even live
Sensitivity live
| Price | -10% $328 | -5% $293 | +0% $257 | +5% $222 | +10% $186 |
|---|---|---|---|---|---|
| Rent | -10% $148 | -5% $202 | +0% $257 | +5% $312 | +10% $367 |
| Rate | -1.0pp $320 | -0.5pp $289 | base $257 | +0.5pp $225 | +1.0pp $192 |
UW: 25.0% down · 7.5% · 30yr · 1.5% tax · 5.0% vac · 8.0% maint · 8.0% mgmt
Financing live
Cash to close
- Down payment
- $31,225
- Closing costs
- $3,747
- Reserves months
- —
- Total cash needed
- —
Loan-product check · same deal, 3 products live
Conventional
25% down · 7.5% · 30yr
- Down + closing
- —
- Monthly P&I
- —
- Monthly cashflow
- —
- DSCR
- —
- Eligible?
- —
Personal DTI + credit; lowest rate.
DSCR
20% down · 8.5% · 30yr
- Down + closing
- —
- Monthly P&I
- —
- Monthly cashflow
- —
- DSCR
- —
- Eligible?
- —
No personal income docs; deal must DSCR.
Hard money
10% down · 12.0% · 12mo
- Down + closing
- —
- Monthly P&I
- —
- Monthly cashflow
- —
- DSCR
- —
- Eligible?
- —
Short-term bridge; refi at stabilization.
Rent comps 40 comps
| Address | Beds | Baths | Sqft | Rent | $/sqft | DOM | Units | Dist |
|---|---|---|---|---|---|---|---|---|
| 20200 Ashton Ave Detroit, MI | 3.0 | 1.0 | 1200 | $1,200 | $1.00 | 17d | 1 | 0.08mi |
| 20527 Rosemont Ave Detroit, MI | 2.0 | 2.0 | 975 | $1,528 | $1.57 | 44d | 1 | 0.11mi |
| 20510 Fenmore St Detroit, MI | 3.0 | 1.0 | 1194 | $1,300 | $1.09 | 2d | 1 | 0.16mi |
| 20043 Fenmore St Detroit, MI | 3.0 | 1.0 | 1030 | $1,453 | $1.41 | 44d | 1 | 0.20mi |
| 19970 Ashton Ave Detroit, MI | 3.0 | 1.0 | 1000 | $1,000 | $1.00 | 44d | 1 | 0.22mi |
| 20068 Faust Ave Detroit, MI | 2.0 | 1.0 | 750 | $1,100 | $1.47 | 25d | 1 | 0.23mi |
| 20259 Oakfield St Detroit, MI | 3.0 | 1.0 | 1056 | $1,250 | $1.18 | 17d | 1 | 0.24mi |
| 19918 Southfield Fwy Detroit, MI | 3.0 | 1.0 | 915 | $1,375 | $1.50 | 16d | 1 | 0.31mi |
| 19818 Fenmore St Detroit, MI | 3.0 | 1.0 | 902 | $1,275 | $1.41 | 44d | 1 | 0.36mi |
| 20203 Gilchrist St Detroit, MI | 3.0 | 1.0 | 1031 | $1,250 | $1.21 | 6d | 1 | 0.37mi |
| 20011 Avon Ave Detroit, MI | 3.0 | 1.0 | 1000 | $1,200 | $1.20 | 6d | 1 | 0.38mi |
| 20314 Gilchrist St Detroit, MI | 3.0 | 1.0 | 1042 | $1,500 | $1.44 | 6d | 1 | 0.39mi |
| 20210 Biltmore St Detroit, MI | 3.0 | 1.0 | 1033 | $1,350 | $1.31 | 25d | 1 | 0.45mi |
| 19400 Harlow St Detroit, MI | 4.0 | 1.0 | 1298 | $1,275 | $0.98 | 17d | 1 | 0.62mi |
| 19445 Avon Ave Detroit, MI | 3.0 | 1.0 | 1023 | $1,550 | $1.52 | 44d | 1 | 0.62mi |
| 20271 Grandville Ave Detroit, MI | 3.0 | 1.0 | 1010 | $1,550 | $1.53 | 24d | 1 | 0.64mi |
| 19329 Stahelin Ave Unit 1 Detroit, MI | 3.0 | 1.5 | 833 | $1,250 | $1.50 | 44d | 1 | 0.76mi |
| 19372 Grandville Ave Detroit, MI | 2.0 | 1.5 | 733 | $1,050 | $1.43 | 16d | 1 | 0.83mi |
| 19503 Mansfield St Detroit, MI | 3.0 | 1.0 | 1200 | $1,350 | $1.12 | 17d | 1 | 0.86mi |
| 20555 Motor Dr Detroit, MI | 1.0–2.0 | 1.0 | 750 | $1,222 | $1.63 | 16d | 5 | 0.91mi |
| 19467 Rutherford St Detroit, MI | 3.0 | 1.0 | 1002 | $1,200 | $1.20 | 17d | 1 | 0.92mi |
| 19176 Grandville Ave Detroit, MI | 3.0 | 1.0 | 941 | $1,300 | $1.38 | 6d | 1 | 0.95mi |
| 19440 Rutherford St Detroit, MI | 3.0 | 1.0 | 1000 | $1,400 | $1.40 | 25d | 1 | 0.96mi |
| 16500 N Park Dr Southfield, MI | 1.0–3.0 | 1.0–2.5 | 1500 | $2,289 | $1.53 | 0d | 1 | 0.97mi |
| 18494 Ashton Ave Detroit, MI | 3.0 | 1.0 | 1000 | $1,600 | $1.60 | 17d | 1 | 1.09mi |
| 19457 Evergreen Rd Detroit, MI | 2.0 | 1.0 | 1100 | $1,200 | $1.09 | 44d | 1 | 1.09mi |
| 18699 Shaftsbury Ave Detroit, MI | 2.0 | 1.0 | 800 | $1,000 | $1.25 | 44d | 1 | 1.09mi |
| 18659 Shaftsbury Ave Detroit, MI | 3.0 | 1.0 | 763 | $1,373 | $1.80 | 13d | 1 | 1.12mi |
| 20284 Melrose St Southfield, MI | 3.0 | 1.0 | 1200 | $1,550 | $1.29 | 44d | 1 | 1.19mi |
| 18452 Shaftsbury Ave Detroit, MI | 3.0 | 1.0 | 927 | $1,500 | $1.62 | 17d | 1 | 1.24mi |
| 20079 Patton St Detroit, MI | 3.0 | 1.0 | 1150 | $1,550 | $1.35 | 6d | 1 | 1.27mi |
| 19781 Fielding St Detroit, MI | 3.0 | 1.0 | 1000 | $1,294 | $1.29 | 6d | 1 | 1.28mi |
| 18276 Oakfield St Detroit, MI | 2.0 | 1.0 | 726 | $1,175 | $1.62 | 44d | 1 | 1.28mi |
| 18450 Edinborough Rd Detroit, MI | 3.0 | 1.0 | 1000 | $1,500 | $1.50 | 44d | 1 | 1.33mi |
| 18675 Forrer St Detroit, MI | 3.0 | 1.0 | 1200 | $1,225 | $1.02 | 6d | 1 | 1.34mi |
| 16200 W 9 Mile Rd Southfield, MI | 1.0–2.0 | 1.0–2.0 | 971 | $1,700 | $1.75 | 6d | 2 | 1.37mi |
| 16300 W 9 Mile Rd Southfield, MI | 1.0–2.0 | 1.0–2.0 | 950 | $1,350 | $1.42 | 44d | 1 | 1.37mi |
| 18400 Rutherford St Detroit, MI | 3.0 | 1.0 | 1050 | $1,400 | $1.33 | 4d | 1 | 1.44mi |
| 17654 Greenview Ave Detroit, MI | 4.0 | 1.0 | 1377 | $1,350 | $0.98 | 17d | 1 | 1.44mi |
| 18268 Mansfield St Detroit, MI | 2.0 | 1.0 | 800 | $1,200 | $1.50 | 17d | 1 | 1.46mi |
Listing history 48 events
-
2026-06-21days on market $124,900 Active 24 DOM
-
2026-06-18days on market $124,900 Active 21 DOM
-
2026-06-17days on market $124,900 Active 20 DOM
-
2026-06-15days on market $124,900 Active 18 DOM
-
2026-06-13days on market $124,900 Active 16 DOM
-
2026-06-13days on market $124,900 Active 15 DOM
-
2026-06-09days on market $124,900 Active 12 DOM
-
2026-06-08days on market $124,900 Active 11 DOM
-
2026-06-07days on market $124,900 Active 10 DOM
-
2026-06-04days on market $124,900 Active 7 DOM
-
2026-06-03days on market $124,900 Active 6 DOM
-
2026-06-02days on market $124,900 Active 5 DOM
-
2026-06-01days on market $124,900 Active 4 DOM
-
2026-05-31days on market $124,900 Active 3 DOM
-
2026-05-25historical $124,900
-
2026-05-21historical $1,310
-
2026-05-21$1,310
-
2026-05-16$1,310
-
2026-05-12historical $1,310
-
2026-04-30price $1,310
-
2026-03-27price $1,375
-
2026-01-31$1,400
-
2026-01-31historical $1,400
-
2026-01-29$1,400
-
2026-01-29historical $1,400
-
2026-01-21$1,400
-
2025-04-26historical $1,150
-
2025-04-22$1,150
-
2025-04-21historical $1,150
-
2025-03-25$1,150
-
2025-03-25historical $1,150
-
2025-03-05$1,150
-
2025-03-05historical $1,150
-
2025-03-04$1,150
-
2025-03-04historical $1,150
-
2025-02-23$1,150
-
2025-02-20historical $1,150
-
2025-02-20price $1,150
-
2025-02-17$1,250
-
2025-02-17historical $1,250
-
2024-12-18$1,250
-
2024-12-18historical $1,250
-
2024-12-06$1,250
-
2024-12-06historical $1,250
-
2024-12-05price $1,250
-
2024-11-28$1,200
-
2024-11-28historical $1,200
-
2024-11-28$1,200
ⓘ Source: listings_history table (triggers on properties + properties_extension) + one-shot
backfill from property_details.listing_events for pre-trigger history.
Tax reassessment forecast MI · Partial reset (capped growth)
- Current annual tax
- $1,565 · $130/mo
- Projected year-2 tax
- $1,744 · $145/mo
- Expected delta
- +$179/yr (+$15/mo · 11.5%)
ⓘ Screening estimate from a state-policy table — verify with the county assessor before closing.
Climate risk First Street
- Flood 1/10 Low FEMA zone X (unshaded) · 0% chance over 30 yrs
- Wildfire 1/10 Low
- Heat 2/10 Low 7 d/yr ≥97°F today · 14 d/yr by 30 yrs out
- Wind 2/10 Low
- Air quality 3/10 Moderate 2 unhealthy d/yr today · 5 by 30 yrs out
Nearby sold comps map
Loading sold comps map…
Walkable amenities ~0.75 mi
Loading nearby amenities…
Taxation est. · year 1
- Rental income
- $16,627
- − Mortgage interest
- −$6,996
- − Property taxes
- −$1,565
- − Insurance
- −$624
- − Repairs & maintenance
- −$1,330
- − Management
- −$1,330
- − Depreciation
- −$3,633
- Taxable income
- $1,148
- Est. tax owed @ 24.0%
- −$275
- After-tax cash flow
- $2,811/yr
For passive investors: Depreciation is non-cash, so a rental often shows a tax loss while cash-flowing — sheltering income. Rental losses are passive: they offset passive income freely, and up to $25,000/yr can offset ordinary (W-2) income if you actively participate and your MAGI is under $100k (phasing out to $0 by $150k); unused losses carry forward. On sale, claimed depreciation is recaptured at up to 25%, and gains may owe capital-gains tax (a 1031 exchange can defer both). Figures are a year-1 estimate at your 24.0% rate — not tax advice; consult a CPA.
Schools (NCES district)
- District
- Detroit Public Schools Community District
- NCES district ID
- 2601103
- Math proficiency
- 10% ▼ -2.00%
- Reading proficiency
- 24% ▲ 6.00%
- Median HH income
- $25,815
- Composite
- 13.06/100
- National rank
- #9564
- State rank
- #499 of 540 in MI
Livability — Detroit
- Score
- 73/100
- State rank
- #218
- US rank
- #5427
Category grades
Schools grade is shown separately in the Schools card above.
Census & demographics
- Census place
- Detroit, MI
- County
- Wayne County · 1,562,939 people
- City population
- 572,865
- Metro
- Detroit-Warren-Dearborn, MI
- Population (ZIP)
- 47,208
- Household income
- $43,655
- Rent vs Own
- Severe rent burden
- 3584.0
Population outlook (Wayne County) Hauer SSP2
- Today (2025)
- 1,675,273 people
- By 2030
- 1,620,300 · -3.3%
- By 2040
- 1,502,341 · -10.3%
- By 2050
- 1,384,039 · -17.4%
- By 2075
- 1,124,592 · -32.9%
- By 2100
- 881,193 · -47.4%
Race, ethnicity, and origin ACS 2023
- Neighborhood character
- Predominantly Black (88%)
- Race & ethnicity
- Black 88% White 5% Two or more races 4% Hispanic / Latino 1%
- Common ancestry
- Romanian 1% Lithuanian 1%
- Foreign-born
- 2% · Canada
- Languages at home
- 96% English-only · Spanish 1% French/Haitian/Cajun 1%
Political lean MEDSL · Wayne
- 2024 margin
- Strong D (+29.0) · D 62.7% · R 33.7% · Other 3.6%
- 2008→2024 swing
- -20.5pp toward R · 2008: 49.5pp · 2024: 29.0pp
- All cycles
- 2024: D+29.0 2020: D+38.1 2016: D+37.3 2012: D+46.9 2008: D+49.5
Not yet ingested
- Civics
- —
Market trends
- HPI YoY
- ▼ -65.06%
- Current HPI
- 563.3263
- Rent YoY
- ▲ 8.04%
- Metro
- Detroit-Warren-Dearborn, MI
- State GDP YoY
- ▲ 1.37%
- F500 in state
- 28
Industry mix (Fortune 500 HQ in MI)
| Industry | F500 HQs | Revenue |
|---|---|---|
| Automotive Parts | 3 | $48B |
|
||
| Automotive | 2 | $372B |
|
||
| Chemicals | 1 | $45B |
|
||
| Automotive Retail | 1 | $29B |
|
||
| Healthcare / Medical Devices | 1 | $23B |
|
||
| Automotive Technology | 1 | $20B |
|
||
Price history
+10308.3% since first listed34 events — show timeline
- 2026-05-25 Coming Soon $124,900 MiRealSource-MiMLS
- 2026-05-21 Rental Removed $1,310 REALSOURCE
- 2026-05-21 Listed for Rent $1,310 REALSOURCE
- 2026-05-16 Listed for Rent $1,310 SHOWMOJO
- 2026-05-12 Rental Removed $1,310 REALSOURCE
- 2026-04-30 Price Changed $1,310 REALSOURCE
- 2026-03-27 Price Changed $1,375 REALSOURCE
- 2026-01-31 Listed for Rent $1,400 REALSOURCE
- 2026-01-31 Rental Removed $1,400 REALCOMP
- 2026-01-29 Listed for Rent $1,400 REALCOMP
- 2026-01-29 Rental Removed $1,400 SHOWMOJO
- 2026-01-21 Listed for Rent $1,400 SHOWMOJO
- 2025-04-26 Rental Removed $1,150 PROPERTYWARE
- 2025-04-22 Listed for Rent $1,150 PROPERTYWARE
- 2025-04-21 Rental Removed $1,150 REALCOMP
- 2025-03-25 Listed for Rent $1,150 REALCOMP
- 2025-03-25 Rental Removed $1,150 REALSOURCE
- 2025-03-05 Listed for Rent $1,150 REALSOURCE
- 2025-03-05 Rental Removed $1,150 REALCOMP
- 2025-03-04 Listed for Rent $1,150 REALCOMP
- 2025-03-04 Rental Removed $1,150 PROPERTYWARE
- 2025-02-23 Listed for Rent $1,150 PROPERTYWARE
- 2025-02-20 Rental Removed $1,150 REALSOURCE
- 2025-02-20 Price Changed $1,150 REALSOURCE
- 2025-02-17 Listed for Rent $1,250 REALSOURCE
- 2025-02-17 Rental Removed $1,250 REALCOMP
- 2024-12-18 Listed for Rent $1,250 REALCOMP
- 2024-12-18 Rental Removed $1,250 REALCOMP
- 2024-12-06 Listed for Rent $1,250 REALCOMP
- 2024-12-06 Rental Removed $1,250 PROPERTYWARE
- 2024-12-05 Price Changed $1,250 PROPERTYWARE
- 2024-11-28 Listed for Rent $1,200 PROPERTYWARE
- 2024-11-28 Rental Removed $1,200 SHOWMOJO
- 2024-11-28 Listed for Rent $1,200 SHOWMOJO
Property tax history
+0.9%/yrLatest (2025): $1,565 · -9.5% YoY. Source: county tax records.
Cash-flow waterfall
monthlySold comps — $/sqft
last 12 mo · ≤1 miLoading sold comps…