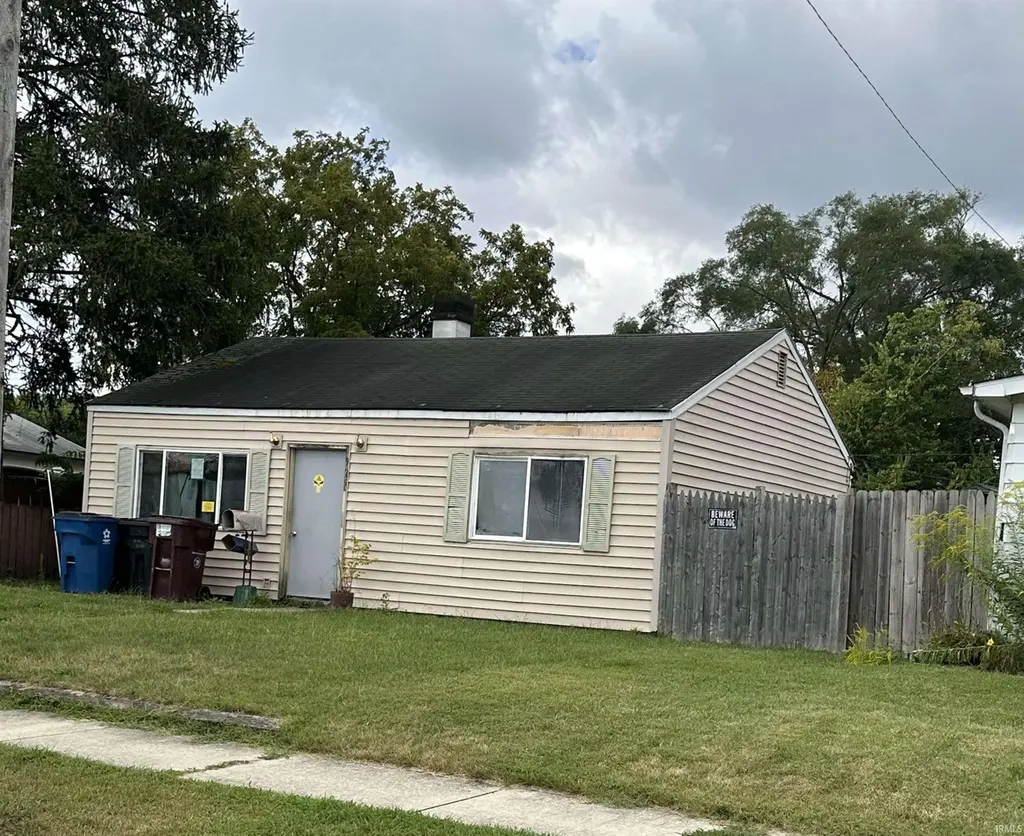
925 Burdette St · Mishawaka, IN
Flood risk 3/10 · Minor
- FEMA flood zone
- X (unshaded)
- Chance of flooding over 30 yrs
- 0.2%
- Est. flood insurance / yr
- $507 – $1,088
Fire risk 1/10 · Minimal
- Est. fire insurance / yr
- $717 – $1,331
Heat risk 3/10 · Minor
- Hot days now (above 99°F)
- 7 days/yr
- Hot days in 30 yrs
- 16 days/yr
Wind risk 2/10 · Minimal
- Chance of severe wind over 30 yrs
- —
Air-quality risk 3/10 · Minor
- Unhealthy air days now
- 2 days/yr
- Unhealthy air days in 30 yrs
- 3 days/yr
Risk factors via First Street. Map © Google.
Why this score? — see what drove the B grade
The composite is a weighted blend of 9 inputs, each scored 0–100. Each bar is that input's sub-score; the figure is the points it added to the 100-point composite (weight × sub-score).
- Cash flow +30.0/30.0
- 1% rule +10.0/10.0
- DSCR +10.0/10.0
- ARV discount +7.5/15.0
- Rent growth +4.8/5.0
- Livability +3.8/5.0
- Condition / age +2.5/5.0
- Schools +2.2/10.0
- Appreciation +0.0/10.0
$59,000
🖨 Deal sheet (PDF) 📄 Offer letter ✓ Due diligence
Listing remarks
Calling all investors, flippers, or handy buyers! This is a great opportunity with excellent potential for rental, flip, or to renovate your own home in a desirable location. Home is gutted to studs and ready for rehab. Property to be sold As-Is
Key facts
- Gutted to studs
- Ready for rehab
- Desirable location
Tags
Property features AI
Finance
- Financial info: Annual tax reported: $1,618
Exterior
- Utilities: Public water; Public sewer
- Home design: Single-family site-built home; One story
- Construction: Vinyl siding; Slab foundation; Built as site-built construction
- Exterior features: Lot dimensions approximately 38 x 122; Lot includes other/unspecified features
Interior
- Bedrooms: Total rooms: 5
- Bathrooms: 1 full bathroom (main level)
- Heating & cooling: No central heating; No cooling
- Interior features: Fireplace (1)
Neighborhood map
What this means for you Summary
Snapshot
- This is a 2-bed/1.0-bath single-family listed at $59k.
Deal economics
- At list price, monthly cash flow is $435 ($5k/yr) — positive.
- The deal already cash-flows at list — no discount required.
- Meets the 1% rule at list price ($1k rent vs $59k).
- Cap rate 15.1% vs local median 5.3% in Mishawaka — top-decile yield for the area; either an underpriced asset or a hidden risk that comps aren't pricing in. Stress-test before assuming the spread holds.
Location & tenants
- Location reads 76/100 on livability (#53 in IN, #3,586 nationally) — a middle-class / working-renter tenant base. Strengths: cost of living A+, housing A+, health & safety B; Watch: amenities F, employment F.
- School City Of Mishawaka (urban): math 23% / reading 30% proficiency, ranked #260 of 301 in IN (top 86%) — low school quality limits family demand, transient renter base, plan for 1-2y turnover.
- Zoned schools: Emmons Elementary School (math 14% / reading 14%, grade F, #874 of 994 statewide, top 89%, 435 students, 87% FRL); John J Young Middle School (math 17% / reading 30%, grade F, #257 of 330 statewide, top 79%, 735 students, 74% FRL); Mishawaka High School (math 24% / reading 60%, grade F, #197 of 369 statewide, top 57%, 1,488 students, 65% FRL) — zoned schools average 75% FRL vs 54% district-wide (21 pts higher); higher-poverty schools than district average — tighter screening recommended.
- Market conditions: Rents rising fast (+9.1%/yr); 140 active listings in the ZIP; 15 comparable units currently listed for rent nearby; rentals at typical pace (median 15d on market — plan ~3-4 weeks tenant-placement turnaround); 754 units permitted in St. Joseph County in 2024 (460 in 5+ unit buildings).
Forward outlook
- Local home prices are declining (-3.0%/yr); year-one equity from $408 of loan paydown is wiped out by about $2k of value loss. Plan a longer hold.
- At projected returns (-3.0% appreciation + 8.0% rent growth), your $17k cash investment doubles in ~4 years — after that, you're playing with house money.
Negotiation context
- Only 14 days on market — expect competitive offers; lowballing is unlikely to land.
Risks & watch-outs
- Watch-outs: property tax is 2.7% of price; built in 1954 — expect roof / HVAC / electrical / plumbing capex.
Questions for the listing agent
- Built in 1954 — when were the roof, HVAC, electrical panel, plumbing, and water heater last replaced?
- Property tax is high relative to price — has the assessment been appealed recently, and will the sale trigger a re-assessment?
- Is there a deadline driving the sale (1031 exchange, divorce, estate, relocation)? That informs how much negotiation room exists.
- What's the average days-on-market for RENTAL listings here right now (not sales)? A rising rental-DOM trend means longer vacancies and softer asking-rent achievability than the comps imply.
- What's the recent tenant-quality profile in this submarket — average credit score on applications, eviction rate, late-payment / NSF rate, and stable-employment percentage? A property-management company in the area should have these aggregated.
- How much new for-sale + rental construction is in the pipeline within 1–3 miles? Heavy new supply typically softens prices + rents 12–24 months out; constrained supply supports both.
Investment metrics
- 1% rule
- 1.93% ✓
- Cap rate
- 15.14%
- Cash-on-cash
- 31.61%
- DSCR
- 2.41
- GRM
- 4.3
CMA / ARV
- ARV (on-the-fly)
- $124,560
- Comps found
- 12
Show comp detail 12 sales within ~0.75 mi
| Address | Dist | Beds/Ba | Sqft | Sold | Price | $/sf | Match |
|---|---|---|---|---|---|---|---|
| 1001 Carlton St | 0.35mi | 2/1.0 | 720 (0%) | 3mo | $124,900 | $173 | 81 |
| 513 Jackson St | 0.26mi | 1/1.0 (-1) | 780 (+8%) | 1mo | $60,000 | $77 | 68 |
| 705 Kamms Ct | 0.53mi | 2/1.0 | 744 (+3%) | 2mo | $162,547 | $218 | 68 |
| 519 Grand Blvd | 0.55mi | 2/1.0 | 725 (+1%) | 8mo | $122,500 | $169 | 66 |
| 209 Hendricks St | 0.39mi | 2/1.0 | 672 (-7%) | 7mo | $100,000 | $149 | 65 |
| 2412 Milburn Blvd | 0.67mi | 2/1.0 | 720 (0%) | 7mo | $117,000 | $163 | 63 |
| 1625 Lincolnway West St | 0.42mi | 3/1.0 (+1) | 768 (+7%) | 7mo | $95,000 | $124 | 58 |
| 1229 S 34th St | 0.61mi | 2/1.0 | 756 (+5%) | 8mo | $90,000 | $119 | 57 |
| 534 W 10th St | 0.54mi | 1/1.0 (-1) | 786 (+9%) | 8mo | $165,000 | $210 | 48 |
| 3513 Pleasant St | 0.68mi | 2/1.0 | 816 (+13%) | 0mo | $168,000 | $206 | 46 |
| 1325 S 31st St | 0.62mi | 2/1.0 | 821 (+14%) | 7mo | $159,500 | $194 | 42 |
| 2416 Milburn Blvd | 0.68mi | 2/1.0 | 823 (+14%) | 6mo | $156,500 | $190 | 40 |
Match score weights: distance 35% · size 25% · config 20% · recency 20%. Top-matched comps best support the ARV.
Projected returns pro-forma
-3.0% appreciation · 8.0% rent growth · sell at horizon
- IRR
- 32.5%
- Equity multiple
- 2.47×
- Total profit
- $24,235
- Equity at exit
- $8,797
- IRR
- 42.3%
- Equity multiple
- 6.11×
- Total profit
- $84,451
- Equity at exit
- $5,101
Cash invested: $16,520 (down + closing). Projections, not guarantees.
Landlord ↔ Tenant lean methodology
- Overall (STATE)
- 90 Strongly Landlord-Friendly
- State Indiana
- 90 Strongly Landlord-Friendly · R+11
- County
- — inherits STATE
- City
- — inherits STATE
ZIP-level market 46544
- Rents YoY
- 9.1%
- Active inventory
- 140
- Price-to-rent
- 4.3×
Monthly cashflow live
- Estimated rent
- $1,141 high interval (Pro) →
- Mortgage (P&I)
- −$309
- Tax from tax record
- −$132 /mo · $1,589/yr
- Insurance
- −$25
- HOA
- −$0
- Vacancy / Maint / Mgmt
- −$240
- Net cashflow
- $435
Break-even live
Sensitivity live
| Price | -10% $468 | -5% $452 | +0% $435 | +5% $418 | +10% $402 |
|---|---|---|---|---|---|
| Rent | -10% $345 | -5% $390 | +0% $435 | +5% $480 | +10% $525 |
| Rate | -1.0pp $465 | -0.5pp $450 | base $435 | +0.5pp $420 | +1.0pp $404 |
UW: 25.0% down · 7.5% · 30yr · 1.5% tax · 5.0% vac · 8.0% maint · 8.0% mgmt
Financing live
Cash to close
- Down payment
- $14,750
- Closing costs
- $1,770
- Reserves months
- —
- Total cash needed
- —
Loan-product check · same deal, 3 products live
Conventional
25% down · 7.5% · 30yr
- Down + closing
- —
- Monthly P&I
- —
- Monthly cashflow
- —
- DSCR
- —
- Eligible?
- —
Personal DTI + credit; lowest rate.
DSCR
20% down · 8.5% · 30yr
- Down + closing
- —
- Monthly P&I
- —
- Monthly cashflow
- —
- DSCR
- —
- Eligible?
- —
No personal income docs; deal must DSCR.
Hard money
10% down · 12.0% · 12mo
- Down + closing
- —
- Monthly P&I
- —
- Monthly cashflow
- —
- DSCR
- —
- Eligible?
- —
Short-term bridge; refi at stabilization.
Rent comps 15 comps
| Address | Beds | Baths | Sqft | Rent | $/sqft | DOM | Units | Dist |
|---|---|---|---|---|---|---|---|---|
| 607 Hendricks St Mishawaka, IN | 2.0 | 1.0 | 528 | $1,200 | $2.27 | 22d | 1 | 0.23mi |
| 1202 W 7th St Unit B Mishawaka, IN | 2.0 | 1.0 | 600 | $1,100 | $1.83 | 14d | 1 | 0.28mi |
| 3530 Northside Blvd South Bend, IN | 1.0–2.0 | 1.0 | 850 | $1,200 | $1.41 | 14d | 1 | 0.54mi |
| 516 W 3rd St Apt 1 Mishawaka, IN | 1.0 | 1.0 | 750 | $800 | $1.07 | 22d | 1 | 0.77mi |
| 516 W 3rd St #6 Mishawaka, IN | 2.0 | 1.0 | 700 | $800 | $1.14 | 14d | 1 | 0.77mi |
| 2804 Delaware St Mishawaka, IN | 2.0 | 1.0 | 720 | $1,200 | $1.67 | 14d | 1 | 0.88mi |
| 2500 Topsfield Rd #907 South Bend, IN | 1.0 | 1.0 | 700 | $1,100 | $1.57 | 44d | 1 | 0.92mi |
| 2530 Pleasant St Unit 3 South Bend, IN | 1.0 | 1.0 | 600 | $925 | $1.54 | 14d | 1 | 0.92mi |
| 365 W Front St Mishawaka, IN | 2.0 | 1.0–2.0 | 825 | $3,050 | $3.70 | 14d | 1 | 0.99mi |
| 2508 E Mishawaka Ave Unit 3A South Bend, IN | 1.0 | 1.0 | 600 | $1,200 | $2.00 | 44d | 1 | 1.11mi |
| 804 S 27th St South Bend, IN | 1.0 | 1.0 | 700 | $850 | $1.21 | 22d | 1 | 1.15mi |
| 1106 S 20th St South Bend, IN | 1.0–3.0 | 1.0–2.0 | 885 | $924 | $1.04 | 14d | 1 | 1.22mi |
| 116 W Mishawaka Ave Mishawaka, IN | 3.0 | 1.0–2.0 | 948 | $1,914 | $2.02 | 14d | 31 | 1.24mi |
| 1701 E Donald St South Bend, IN | 2.0 | 1.0 | 720 | $1,075 | $1.49 | 44d | 1 | 1.24mi |
| 4245 Irish Hills Dr South Bend, IN | 1.0–2.0 | 1.0–1.5 | 739 | $1,436 | $1.94 | 14d | 77 | 1.39mi |
Listing history 10 events
-
2026-06-13statusdays on market $59,000 Pending 14 DOM
-
2026-06-10days on market $59,000 Active 13 DOM
-
2026-06-09days on market $59,000 Active 12 DOM
-
2026-06-08days on market $59,000 Active 11 DOM
-
2026-06-07days on market $59,000 Active 10 DOM
-
2026-06-02days on market $59,000 Active 5 DOM
-
2026-06-01days on market $59,000 Active 4 DOM
-
2026-05-31days on market $59,000 Active 3 DOM
-
2026-05-30days on market $59,000 Active 2 DOM
-
2026-05-28$59,000 Active
ⓘ Source: listings_history table (triggers on properties + properties_extension) + one-shot
backfill from property_details.listing_events for pre-trigger history.
Tax reassessment forecast IN · Partial reset (capped growth)
- Current annual tax
- $1,589 · $132/mo
- Projected year-2 tax
- $1,589 · $132/mo
- Expected delta
- $0/yr ($0/mo · 0.0%)
ⓘ Screening estimate from a state-policy table — verify with the county assessor before closing.
Climate risk First Street
- Flood 3/10 Moderate FEMA zone X (unshaded) · 20% chance over 30 yrs
- Wildfire 1/10 Low
- Heat 3/10 Moderate 7 d/yr ≥99°F today · 16 d/yr by 30 yrs out
- Wind 2/10 Low
- Air quality 3/10 Moderate 2 unhealthy d/yr today · 3 by 30 yrs out
Nearby sold comps map
Loading sold comps map…
Walkable amenities ~0.75 mi
Loading nearby amenities…
Taxation est. · year 1
- Rental income
- $13,693
- − Mortgage interest
- −$3,305
- − Property taxes
- −$1,589
- − Insurance
- −$295
- − Repairs & maintenance
- −$1,095
- − Management
- −$1,095
- − Depreciation
- −$1,716
- Taxable income
- $4,597
- Est. tax owed @ 24.0%
- −$1,103
- After-tax cash flow
- $4,118/yr
For passive investors: Depreciation is non-cash, so a rental often shows a tax loss while cash-flowing — sheltering income. Rental losses are passive: they offset passive income freely, and up to $25,000/yr can offset ordinary (W-2) income if you actively participate and your MAGI is under $100k (phasing out to $0 by $150k); unused losses carry forward. On sale, claimed depreciation is recaptured at up to 25%, and gains may owe capital-gains tax (a 1031 exchange can defer both). Figures are a year-1 estimate at your 24.0% rate — not tax advice; consult a CPA.
Schools (NCES district)
- District
- School City Of Mishawaka
- NCES district ID
- 1806840
- Math proficiency
- 23% ▼ -9.00%
- Reading proficiency
- 30% ▼ -7.00%
- Median HH income
- $39,290
- Composite
- 22.26/100
- National rank
- #8143
- State rank
- #260 of 301 in IN
Livability — Mishawaka
- Score
- 76/100
- State rank
- #53
- US rank
- #3586
Category grades
Schools grade is shown separately in the Schools card above.
Census & demographics
- Census place
- Mishawaka, IN
- County
- Saint Joseph County · 189,048 people
- City population
- 57,683
- Metro
- South Bend-Mishawaka, IN-MI
- Population (ZIP)
- 31,077
- Household income
- $58,829
- Rent vs Own
- Severe rent burden
- 685.0
Population outlook (St. Joseph County) Hauer SSP2
- Today (2025)
- 273,186 people
- By 2030
- 273,594 · +0.1%
- By 2040
- 271,641 · -0.6%
- By 2050
- 269,187 · -1.5%
- By 2075
- 263,136 · -3.7%
- By 2100
- 245,659 · -10.1%
Race, ethnicity, and origin ACS 2023
- Neighborhood character
- Predominantly White (79%)
- Race & ethnicity
- White 79% Black 9% Two or more races 7% Hispanic / Latino 6% Asian 1%
- Hispanic origin (detail)
- Mexican 5%
- Common ancestry
- Romanian 7% English 3% Lithuanian 2%
- Foreign-born
- 4% · Canada, Vietnam
- Languages at home
- 94% English-only · Spanish 3%
Political lean MEDSL · St. Joseph
- 2024 margin
- Toss-up / Even · D 50.0% · R 48.5% · Other 1.5%
- 2008→2024 swing
- -15.6pp toward R · 2008: 17.1pp · 2024: 1.5pp
- All cycles
- 2024: D+1.5 2020: D+5.8 2016: D+0.2 2012: D+3.5 2008: D+17.1
Not yet ingested
- Civics
- —
Market trends
- HPI YoY
- ▼ -116.74%
- Current HPI
- 188.9996
- Rent YoY
- ▲ 9.10%
- Metro
- South Bend-Mishawaka, IN-MI
- State GDP YoY
- ▲ 2.90%
- F500 in state
- 18
Industry mix (Fortune 500 HQ in IN)
| Industry | F500 HQs | Revenue |
|---|---|---|
| Industrial Machinery | 2 | $37B |
|
||
| Healthcare | 1 | $177B |
|
||
| Pharmaceuticals | 1 | $45B |
|
||
| Metals / Steel | 1 | $18B |
|
||
| Agriculture | 1 | $17B |
|
||
| Packaging | 1 | $12B |
|
||
Price history
1 event — show timeline
- 2026-05-28 Listed $59,000 IRMLS
Property tax history
-3.0%/yrLatest (2024): $1,589 · +11.4% YoY. Source: county tax records.
Cash-flow waterfall
monthlySold comps — $/sqft
last 12 mo · ≤1 miLoading sold comps…