 Triplex
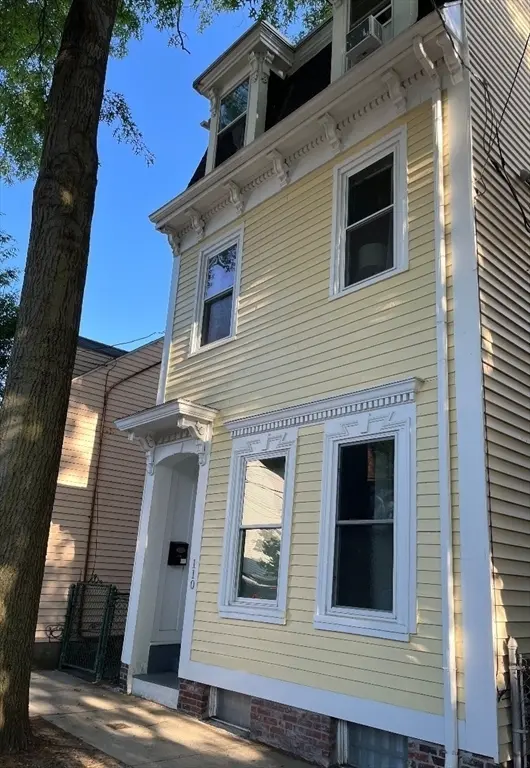
110 Spring St · Cambridge, MA
Flood risk 1/10 · Minimal
- FEMA flood zone
- X (unshaded)
- Chance of flooding over 30 yrs
- 0.0%
- Est. flood insurance / yr
- $473 – $860
Fire risk 1/10 · Minimal
- Est. fire insurance / yr
- $915 – $1,699
Heat risk 6/10 · Moderate
- Hot days now (above 97°F)
- 7 days/yr
- Hot days in 30 yrs
- 15 days/yr
Wind risk 6/10 · Moderate
- Chance of severe wind over 30 yrs
- 64.0%
Air-quality risk 3/10 · Minor
- Unhealthy air days now
- 3 days/yr
- Unhealthy air days in 30 yrs
- 3 days/yr
Risk factors via First Street. Map © Google.
Why this score? — see what drove the B grade
The composite is a weighted blend of 9 inputs, each scored 0–100. Each bar is that input's sub-score; the figure is the points it added to the 100-point composite (weight × sub-score).
- Cash flow +30.0/30.0
- 1% rule +10.0/10.0
- DSCR +10.0/10.0
- Appreciation +7.3/10.0
- Schools +4.6/10.0
- Livability +4.2/5.0
- Rent growth +3.2/5.0
- Condition / age +2.5/5.0
- ARV discount +0.0/15.0
$1,595,000
🖨 Deal sheet 📄 Offer letter ✓ Due diligence
Multi-family units
County records classify this as Multi-Family (2-4 Unit). Listing-text estimate: 3 units. confirmed
Listing remarks MLS
GORGEOUS TWO FAMILY VICTORIAN LOCATED IN THE HEART OF EAST CAMBRIDGE BETWEEN MIT AND CAMBRIDGE SIDE GALLERIA MALL. SHORT WALK TO KENDALL,LECHMERE,GALLERIA MALL, MIT, MUSEUM OF SCIENCE. UPDATED UNITS, SMALL PRIVATE FENCED IN YARD,PERFECT FOR OWNER OCCUPPIED W/ INCOME, EASY CONDO CONVERSION, COME MAKE MONEY!!! Showings begin the week of 8/9!
Key facts
- Garden area
- Kendall square
- Charles river
Tags
Property features AI
Finance
- Other: Above-grade finished area and below-grade finished area reported; Partially finished basement with bulkhead; Two units currently leased
- HOA & community: Nearby public transportation, T-station, bike path and sidewalks; Close to shopping, parks, highway access and a university
Exterior
- Parking: Open parking; Paved driveway; On-street parking
- Utilities: Public water; Public sewer
- Home design: 3-family property (3 units up/down); 4 total stories; 4 levels
- Construction: Frame construction; Shingle roof; Concrete perimeter foundation; Built (year per public records)
- Exterior features: Porch; Level lot; Paved road frontage; Publicly maintained road; Public road frontage
Interior
- Kitchen: Range; Dishwasher; Disposal; Refrigerator
- Flooring: Wood; Hardwood
- Bathrooms: 2 full bathrooms; 1 half bathroom
- Heating & cooling: Forced air heating; Window unit(s) for cooling; Has heating; Has cooling
- Interior features: Ceiling fans; Bathroom with tub and shower; Pantry; Living room; Kitchen; Laundry room; 12 total rooms
- Laundry & utility: Washer; Dryer; Laundry room
Neighborhood map
What this means for you Summary
Snapshot
- This is a 3 × 5-bed/2.5-bath units multifamily listed at $1.59M.
Deal economics
- At list price, monthly cash flow is $11k ($126k/yr) — positive. Per door: $4k/mo.
- The deal already cash-flows at list — no discount required.
- Meets the 1% rule at list price ($26k rent vs $1.59M).
- Cap rate 14.2% vs local median 1.8% in Cambridge — top-decile yield for the area; either an underpriced asset or a hidden risk that comps aren't pricing in. Stress-test before assuming the spread holds.
Location & tenants
- Location reads 84/100 on livability (#15 in MA, #654 nationally) — a professional / high-income tenant draw. Strengths: schools A+, amenities A+, commute A+; Watch: crime F, cost of living F.
- Cambridge (urban): math 42% / reading 59% proficiency, ranked #117 of 302 in MA (top 39%) — acceptable for families but not a draw, mixed tenant base, ~2y average lease.
- Market conditions: Rents rising (+3.0%/yr); 50 active listings in the ZIP; 28 comparable units currently listed for rent nearby; rentals lingering (median 44d on market — plan ~5-8 weeks vacancy on turnover, expect pricing pressure); 50% of comp listings sitting > 30 days — soft ceiling on asking rent; high-income renter base; 3,670 units permitted in Middlesex County in 2024 (2,611 in 5+ unit buildings).
- At $25,576/mo this rent would consume 243% of the median local household income ($127k/yr) (locally 1081% of renters already pay >50% of income on rent) — very limited rent-growth headroom before tenants either downsize or default.
Forward outlook
- In year one you build about $86k of equity ($11k loan paydown + $75k appreciation (4.7% local appreciation)).
- Middlesex County population projected at +20% by 2050 — long-run rental-demand tailwind backs the buy-and-hold thesis.
- At projected returns (4.7% appreciation + 3.0% rent growth), your $447k cash investment doubles in ~3 years — after that, you're playing with house money.
- By year 2, paydown + projected appreciation supports a ~$138k cash-out refi (75% LTV) — recoverable capital for the next deal without selling this one.
Negotiation context
- Only 13 days on market — expect competitive offers; lowballing is unlikely to land.
- 3 sale attempts since 30y ago with the ask held roughly flat each time — persistent listings suggest the price (not the market) is what's stuck; bring a comps-based counter.
- Current owner paid $550k; list at $1.59M implies a 190% gain — meaningful room to come down on a strong offer.
Risks & watch-outs
- Watch-outs: built in 1873 — expect roof / HVAC / electrical / plumbing capex.
- Climate carrying-cost: major wind risk, 64% chance of damaging wind over 30y; extreme-heat days projected 7→15/yr by 2055 (HVAC capex compounding) — expect insurance premiums to compound above CPI over the hold.
Questions for the listing agent
- Can we see the unit-by-unit rent roll, current vacancy, and any below-market leases? What's the average tenancy length?
- What capital expenditures (roof, boiler, parking lot, exteriors) have been made in the last 5 years, and what's planned in the next 2?
- Built in 1873 — when were the roof, HVAC, electrical panel, plumbing, and water heater last replaced?
- Is there a deadline driving the sale (1031 exchange, divorce, estate, relocation)? That informs how much negotiation room exists.
- Schools are A-rated — typically a magnet for longer-tenancy family renters. What's the average tenant stay here, and is there a school-zone premium baked into asking?
- Crime grade is F in this area — have there been break-ins, vandalism, or insurance claims at this property in the last 3 years? What carrier currently insures it and at what premium?
- What's the average days-on-market for RENTAL listings here right now (not sales)? A rising rental-DOM trend means longer vacancies and softer asking-rent achievability than the comps imply.
- What's the recent tenant-quality profile in this submarket — average credit score on applications, eviction rate, late-payment / NSF rate, and stable-employment percentage? A property-management company in the area should have these aggregated.
- How much new apartment / multifamily construction is in the pipeline within 1–3 miles? Heavy new supply (>2% of stock underway) typically softens rents 12–24 months out; light construction supports rent growth.
Investment metrics
- 1% rule
- 1.60% ✓
- Cap rate
- 14.22%
- Cash-on-cash
- 28.31%
- DSCR
- 2.26
- GRM
- 5.2
CMA / ARV
- ARV (on-the-fly)
- $1,193,570
- Comps found
- 6
Show comp detail 6 sales within ~0.75 mi
| Address | Dist | Beds/Ba | Sqft | Sold | Price | $/sf | Match |
|---|---|---|---|---|---|---|---|
| 50 Spring St | 0.16mi | 4/3.0 (-1) | 2,267 (+13%) | 1mo | $1,600,000 | $706 | 65 |
| 70 Thorndike St | 0.11mi | 6/3.0 (+1) | 2,155 (+7%) | 22mo | $1,615,000 | $749 | 60 |
| 84 Winter St | 0.24mi | 4/2.0 (-1) | 2,108 (+5%) | 20mo | $1,150,000 | $546 | 55 |
| 7-9 Lincoln | 0.52mi | 4/2.0 (-1) | 2,094 (+4%) | 10mo | $1,210,000 | $578 | 51 |
| 724-726 Cambridge St | 0.35mi | 4/3.0 (-1) | 2,287 (+14%) | 14mo | $1,360,000 | $595 | 44 |
| 66 Elm St | 0.74mi | 5/2.0 | 2,175 (+8%) | 6mo | $1,260,000 | $579 | 43 |
Match score weights: distance 35% · size 25% · config 20% · recency 20%. Top-matched comps best support the ARV.
Projected returns pro-forma
4.7% appreciation · 2.99% rent growth · sell at horizon
- IRR
- 37.1%
- Equity multiple
- 3.26×
- Total profit
- $1,010,635
- Equity at exit
- $874,835
- IRR
- 35.6%
- Equity multiple
- 6.57×
- Total profit
- $2,487,340
- Equity at exit
- $1,486,373
Cash invested: $446,600 (down + closing). Projections, not guarantees.
Landlord ↔ Tenant lean methodology
- Overall (STATE)
- 20 Strongly Tenant-Friendly
- State Massachusetts
- 20 Strongly Tenant-Friendly · D+15
- County
- — inherits STATE
- City
- — inherits STATE
ZIP-level market 02141
- Home prices YoY
- 1.4%
- Rents YoY
- 3.0%
- Active inventory
- 50
- Price-to-rent
- 15.6×
Monthly cashflow live
- Estimated rent
- $25,576 medium interval (Pro) →
- Mortgage (P&I)
- −$8,364
- Tax from tax record
- −$641 /mo · $7,689/yr
- Insurance
- −$665
- HOA
- −$0
- Vacancy / Maint / Mgmt
- −$5,371
- Net cashflow
- $10,535
Break-even live
3-unit breakdown (identical units grouped — click to expand)
| Units | Beds | Baths | Est. rent |
|---|---|---|---|
| 3× units | 5 | 2.5 | $25,575 |
| #1 | 5 | 2.5 | $8,525 |
| #2 | 5 | 2.5 | $8,525 |
| #3 | 5 | 2.5 | $8,525 |
| Total (3 units) | $25,576 | ||
UW: 25.0% down · 7.5% · 30yr · 1.5% tax · 5.0% vac · 8.0% maint · 8.0% mgmt
Financing live
Cash to close
- Down payment
- $398,750
- Closing costs
- $47,850
- Reserves months
- —
- Total cash needed
- —
Loan-product check · same deal, 3 products live
Conventional
25% down · 7.5% · 30yr
- Down + closing
- —
- Monthly P&I
- —
- Monthly cashflow
- —
- DSCR
- —
- Eligible?
- —
Personal DTI + credit; lowest rate.
DSCR
20% down · 8.5% · 30yr
- Down + closing
- —
- Monthly P&I
- —
- Monthly cashflow
- —
- DSCR
- —
- Eligible?
- —
No personal income docs; deal must DSCR.
Hard money
10% down · 12.0% · 12mo
- Down + closing
- —
- Monthly P&I
- —
- Monthly cashflow
- —
- DSCR
- —
- Eligible?
- —
Short-term bridge; refi at stabilization.
Rent comps 28 comps
| Address | Beds | Baths | Sqft | Rent | $/sqft | DOM | Units | Dist |
|---|---|---|---|---|---|---|---|---|
| 92 Thorndike St Cambridge, MA | 4.0 | 3.0 | 3000 | $8,000 | $2.67 | 44d | 1 | 0.07mi |
| 339 Cambridge St Unit 2 Cambridge, MA | 4.0 | 2.0 | 1400 | $6,000 | $4.29 | 8d | 1 | 0.18mi |
| 313 Cambridge St Cambridge, MA | 4.0 | 1.0 | 1400 | $4,595 | $3.28 | 44d | 1 | 0.19mi |
| 285 3rd St Cambridge, MA | 4.0 | 1.0–3.0 | 1364 | $5,606 | $4.11 | 2d | 15 | 0.31mi |
| 38 Hunting St #2 Cambridge, MA | 5.0 | 1.5 | 1500 | $4,500 | $3.00 | 44d | 1 | 0.52mi |
| 291 Windsor St #291 Cambridge, MA | 4.0 | 3.5 | 1818 | $8,900 | $4.90 | 3d | 1 | 0.62mi |
| 176 Elm St Cambridge, MA | 4.0 | 2.5 | 1800 | $6,000 | $3.33 | 44d | 1 | 0.70mi |
| 266 Broadway Cambridge, MA | 4.0 | 1.0 | 2000 | $6,500 | $3.25 | 44d | 1 | 0.72mi |
| 64 Elm St Apt 2 Cambridge, MA | 5.0 | 1.0 | 1588 | $4,500 | $2.83 | 17d | 1 | 0.75mi |
| 64 Elm St Apt 2 Cambridge, MA | 5.0 | 1.0 | 1588 | $5,200 | $3.27 | 44d | 1 | 0.75mi |
| 309 Broadway Unit 1 Cambridge, MA | 4.0 | 4.5 | 2500 | $10,000 | $4.00 | 17d | 1 | 0.88mi |
| 16 Alston St #16 Somerville, MA | 4.0 | 3.0 | 2518 | $6,500 | $2.58 | 44d | 1 | 0.96mi |
| 20 Alston St #20 Somerville, MA | 4.0 | 2.0 | 1606 | $5,500 | $3.42 | 24d | 1 | 0.96mi |
| 6 Pearl St Unit B Somerville, MA | 4.0 | 3.5 | 2255 | $5,200 | $2.31 | 3d | 1 | 1.01mi |
| 1433 Cambridge St Cambridge, MA | 4.0 | 2.0 | 1800 | $7,000 | $3.89 | 24d | 1 | 1.06mi |
| 1433 Cambridge St Cambridge, MA | 4.0 | 2.0 | 1800 | $7,000 | $3.89 | 44d | 1 | 1.06mi |
| 15 Dimick St Somerville, MA | 4.0 | 2.0 | 2730 | $6,300 | $2.31 | 24d | 1 | 1.09mi |
| 15 Harold St Unit 1L Somerville, MA | 4.0 | 2.0 | 1800 | $5,400 | $3.00 | 44d | 1 | 1.11mi |
| 319 Washington St Somerville, MA | 4.0 | 2.0 | 1800 | $6,000 | $3.33 | 44d | 1 | 1.17mi |
| 81 Flint St Unit 83 Somerville, MA | 5.0 | 3.0 | 2400 | $4,999 | $2.08 | 18d | 1 | 1.18mi |
| 331 Washington St Somerville, MA | 5.0 | 2.0 | 1900 | $6,000 | $3.16 | 24d | 1 | 1.20mi |
| 100 Flint St Somerville, MA | 4.0 | 1.0 | 1537 | $7,925 | $5.16 | 22d | 1 | 1.20mi |
| 470 Green St Unit 2 Cambridge, MA | 4.0 | 3.0 | 2500 | $7,500 | $3.00 | 8d | 1 | 1.29mi |
| 470 Green St Cambridge, MA | 4.0 | 3.0 | 2500 | $7,500 | $3.00 | 44d | 1 | 1.29mi |
| 21 Pennsylvania Ave Somerville, MA | 5.0 | 2.0 | 1800 | $5,095 | $2.83 | 5d | 1 | 1.30mi |
| 21 Macarthur St Unit 2 Somerville, MA | 4.0 | 1.0 | 1500 | $3,800 | $2.53 | 44d | 1 | 1.39mi |
| 20 Preston Rd Somerville, MA | 4.0 | 1.0 | 1600 | $4,500 | $2.81 | 44d | 1 | 1.41mi |
| 467 Somerville Ave Somerville, MA | 4.0 | 2.0 | 2100 | $6,400 | $3.05 | 44d | 1 | 1.41mi |
Listing history 10 events
-
2026-06-18days on market $1,595,000 Active 13 DOM
-
2026-06-17days on market $1,595,000 Active 12 DOM
-
2026-06-16days on market $1,595,000 Active 11 DOM
-
2026-06-15days on market $1,595,000 Active 10 DOM
-
2026-06-13days on market $1,595,000 Active 8 DOM
-
2026-06-13days on market $1,595,000 Active 7 DOM
-
2026-06-09statusdays on market $1,595,000 Active 4 DOM
-
2026-06-08days on market $1,595,000 New 3 DOM
-
2026-06-07remarks 554-char remark
-
2026-06-07$1,595,000 New 2 DOM
ⓘ Source: listings_history table (triggers on properties + properties_extension) + one-shot
backfill from property_details.listing_events for pre-trigger history.
Tax reassessment forecast MA · Partial reset (capped growth)
- Current annual tax
- $7,689 · $641/mo
- Projected year-2 tax
- $13,654 · $1,138/mo
- Expected delta
- +$5,965/yr (+$497/mo · 77.6%)
ⓘ Screening estimate from a state-policy table — verify with the county assessor before closing.
Climate risk First Street
- Flood 1/10 Low FEMA zone X (unshaded) · 0% chance over 30 yrs
- Wildfire 1/10 Low
- Heat 6/10 Major 7 d/yr ≥97°F today · 15 d/yr by 30 yrs out
- Wind 6/10 Major 64% chance of damaging wind over 30 yrs
- Air quality 3/10 Moderate 3 unhealthy d/yr today · 3 by 30 yrs out
Nearby sold comps map
Loading sold comps map…
Walkable amenities ~0.75 mi
Loading nearby amenities…
Taxation est. · year 1
- Rental income
- $306,912
- − Mortgage interest
- −$89,345
- − Property taxes
- −$7,689
- − Insurance
- −$7,975
- − Repairs & maintenance
- −$24,553
- − Management
- −$24,553
- − Depreciation
- −$46,400
- Taxable income
- $106,397
- Est. tax owed @ 24.0%
- −$25,535
- After-tax cash flow
- $100,889/yr
For passive investors: Depreciation is non-cash, so a rental often shows a tax loss while cash-flowing — sheltering income. Rental losses are passive: they offset passive income freely, and up to $25,000/yr can offset ordinary (W-2) income if you actively participate and your MAGI is under $100k (phasing out to $0 by $150k); unused losses carry forward. On sale, claimed depreciation is recaptured at up to 25%, and gains may owe capital-gains tax (a 1031 exchange can defer both). Figures are a year-1 estimate at your 24.0% rate — not tax advice; consult a CPA.
Schools (NCES district)
- District
- Cambridge
- NCES district ID
- 2503270
- Math proficiency
- 42% ▼ -12.00%
- Reading proficiency
- 59% ▼ -1.00%
- Median HH income
- $76,444
- Composite
- 45.66/100
- National rank
- #2580
- State rank
- #117 of 302 in MA
Livability — Cambridge
- Score
- 84/100
- State rank
- #15
- US rank
- #654
Category grades
Schools grade is shown separately in the Schools card above.
Census & demographics
- Census place
- Cambridge, MA
- County
- Middlesex County · 1,437,704 people
- City population
- 119,000
- Metro
- Boston-Cambridge-Newton, MA-NH
- Population (ZIP)
- 14,517
- Household income
- $126,522
- Rent vs Own
- Severe rent burden
- 1081.0
Population outlook (Middlesex County) Hauer SSP2
- Today (2025)
- 1,740,269 people
- By 2030
- 1,817,187 · +4.4%
- By 2040
- 1,963,195 · +12.8%
- By 2050
- 2,087,461 · +20.0%
- By 2075
- 2,344,036 · +34.7%
- By 2100
- 2,383,776 · +37.0%
Race, ethnicity, and origin ACS 2023
- Neighborhood character
- Diverse neighborhood (Simpson 0.64)
- Race & ethnicity
- White 54% Asian 21% Hispanic / Latino 11% Black 9% Two or more races 8%
- Hispanic origin (detail)
- Mexican 1% Puerto Rican 2%
- Common ancestry
- Russian 3% Scotch-Irish 3% Romanian 2%
- Foreign-born
- 35% · Canada, China, South Korea
- Languages at home
- 61% English-only · Other Indo-European 10% Spanish 8% Chinese 8%
Political lean MEDSL · Middlesex
- 2024 margin
- Solid D (+39.5) · D 68.5% · R 29.0% · Other 2.5%
- 2008→2024 swing
- +9.3pp toward D · 2008: 30.1pp · 2024: 39.5pp
- All cycles
- 2024: D+39.5 2020: D+45.2 2016: D+38.1 2012: D+26.9 2008: D+30.1
Not yet ingested
- Civics
- —
Market trends
- HPI YoY
- ▲ 4.70%
- Current HPI
- 329.3801
- Rent YoY
- ▲ 2.99%
- Metro
- Boston-Cambridge-Newton, MA-NH
- State GDP YoY
- ▲ 2.28%
- F500 in state
- 38
Industry mix (Fortune 500 HQ in MA)
| Industry | F500 HQs | Revenue |
|---|---|---|
| Technology | 3 | $17B |
|
||
| Insurance | 2 | $84B |
|
||
| Retail | 2 | $76B |
|
||
| Life Sciences | 1 | $43B |
|
||
| Energy Technology | 1 | $31B |
|
||
| Aerospace / Defense | 1 | $18B |
|
||
Price history
+2026.7% since first listed10 events — show timeline
- 2026-06-05 Listed $1,595,000 MLS PIN
- 2005-01-07 Sold (Public Records) $550,000 Public Records
- 2005-01-06 Sold (MLS) $550,000 MLS PIN
- 2004-12-01 Listing Removed — MLS PIN
- 2004-07-07 Listed $579,756 MLS PIN
- 1998-01-30 Sold (Public Records) $186,000 Public Records
- 1998-01-30 Sold (MLS) $186,000 MLS PIN
- 1997-10-28 Listing Removed — MLS PIN
- 1996-09-27 Listed $199,900 MLS PIN
- 1984-10-19 Sold (Public Records) $75,000 Public Records
Property tax history
+4.4%/yrLatest (2025): $7,689 · +5.1% YoY. Source: county tax records.
Cash-flow waterfall
monthlySold comps — $/sqft
last 12 mo · ≤1 miLoading sold comps…