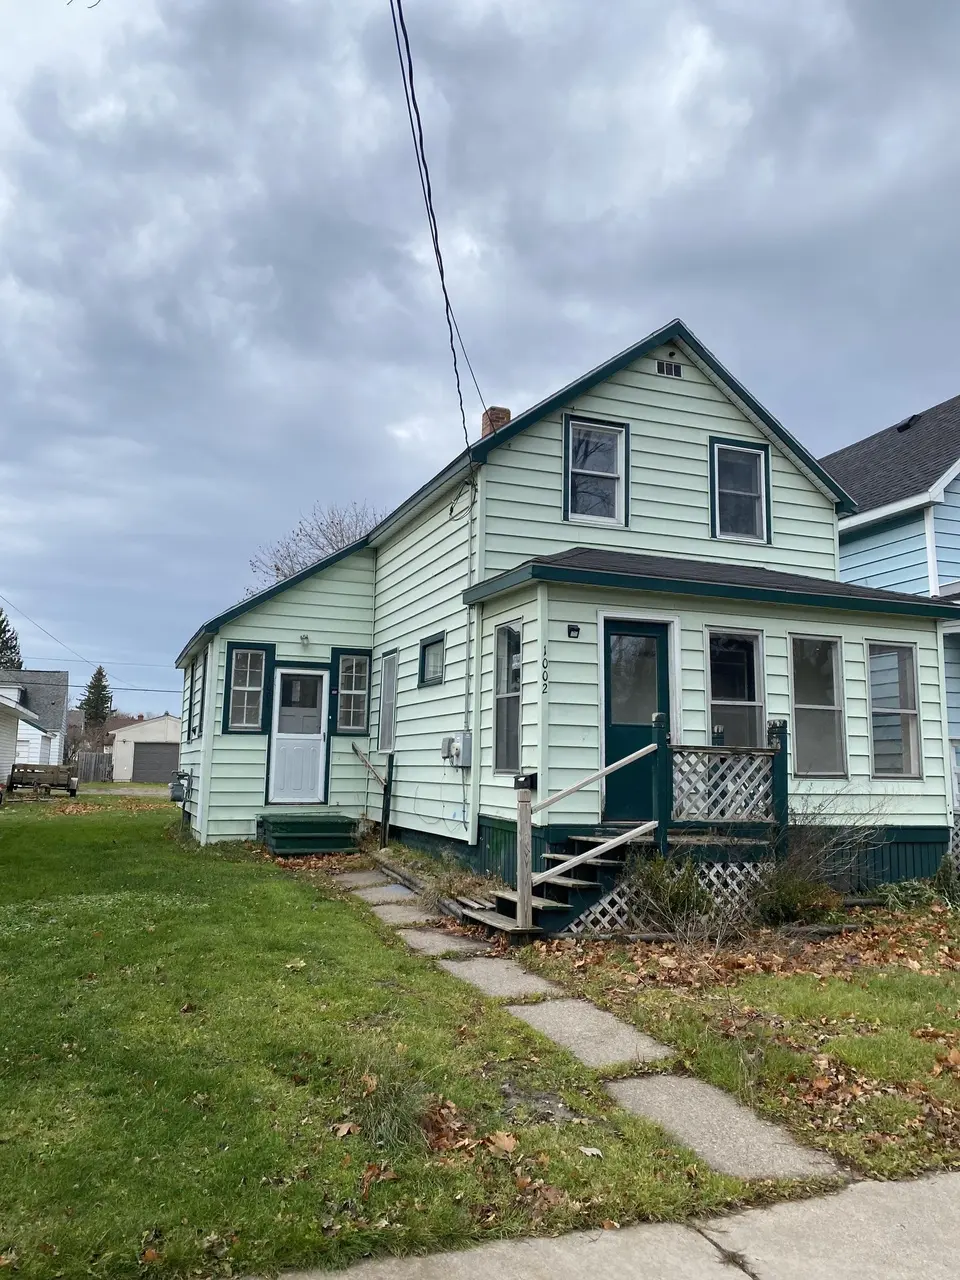
1002 Superior St · Sault Ste. Marie, MI
Flood risk 1/10 · Minimal
- FEMA flood zone
- X (unshaded)
- Chance of flooding over 30 yrs
- 0.0%
- Est. flood insurance / yr
- $507 – $1,088
Fire risk 1/10 · Minimal
- Est. fire insurance / yr
- $784 – $1,456
Heat risk 1/10 · Minimal
- Hot days now (above 88°F)
- 7 days/yr
- Hot days in 30 yrs
- 13 days/yr
Wind risk 1/10 · Minimal
- Chance of severe wind over 30 yrs
- —
Air-quality risk 1/10 · Minimal
- Unhealthy air days now
- 0 days/yr
- Unhealthy air days in 30 yrs
- 0 days/yr
Risk factors via First Street. Map © Google.
Why this score? — see what drove the B+ grade
The composite is a weighted blend of 9 inputs, each scored 0–100. Each bar is that input's sub-score; the figure is the points it added to the 100-point composite (weight × sub-score).
- Cash flow +30.0/30.0
- ARV discount +15.0/15.0
- 1% rule +10.0/10.0
- DSCR +10.0/10.0
- Schools +3.3/10.0
- Rent growth +2.5/5.0
- Livability +2.5/5.0
- Condition / age +2.5/5.0
- Appreciation +0.0/10.0
$84,000
🖨 Deal sheet 📄 Offer letter ✓ Due diligence
Listing remarks MLS
A 3-bedroom home under $100,000 is hard to find these days, and this one is a solid option. Great for first-time buyers or as a rental investment, it offers 3 bedrooms on the second floor, with bath and laundry on the main level. Enjoy an enclosed front porch, enclosed side entry, and a full basement for storage. Features include 100-amp breakers, a Williamson furnace with a new motor, and a cement parking pad off the alley. Vacant and easy to show!
Key facts
- 100-amp breakers
- Full basement
- Enclosed side entry
Tags
Neighborhood map
What this means for you Summary
Snapshot
- This is a 3-bed/1.0-bath single-family listed at $84k.
Deal economics
- At list price, monthly cash flow is $471 ($6k/yr) — positive.
- The deal already cash-flows at list — no discount required.
- Meets the 1% rule at list price ($1k rent vs $84k).
- Recommended offer: $74k (12.0% below list) — sets the bar for market timing.
- Cap rate 13.0% vs local median 4.5% in Sault Ste. Marie — top-decile yield for the area; either an underpriced asset or a hidden risk that comps aren't pricing in. Stress-test before assuming the spread holds.
Location & tenants
- Location reads: area grade B — affects rentability + tenant quality, not the cash-flow math above.
- Sault Ste. Marie Area Schools (town): math 35% / reading 44% proficiency, ranked #230 of 540 in MI (top 43%) — families likely to look elsewhere, expect single-tenant / working-renter base with shorter leases.
- Market conditions: 125 active listings in the ZIP; 1 comparable units currently listed for rent nearby; 92 units permitted in Chippewa County in 2024 (40 in 5+ unit buildings).
Forward outlook
- Local home prices are declining (-3.0%/yr); year-one equity from $581 of loan paydown is wiped out by about $3k of value loss. Plan a longer hold.
- Chippewa County population projected at -10% by 2050 — secular population decline; favor cash flow + early exit over multi-decade hold.
- At projected returns (-3.0% appreciation + 3.0% rent growth), your $24k cash investment doubles in ~6 years — after that, you're playing with house money.
Negotiation context
- It's been on market 205 days — a 12% lower offer ($74k) is reasonable based on typical stale-listing flexibility.
- 3 sale attempts; this cycle's ask has dropped $15k (15%) from the opening price — seller is motivated, your offer sets the floor, not the list.
- Current owner paid $29k; list at $84k implies a 190% gain — meaningful room to come down on a strong offer.
Risks & watch-outs
- Watch-outs: built in 1920 — expect roof / HVAC / electrical / plumbing capex.
Questions for the listing agent
- It's been on market 205 days. Have you received any prior offers? Is the seller open to a 12% concession, seller financing, or rate buy-down credit?
- Built in 1920 — when were the roof, HVAC, electrical panel, plumbing, and water heater last replaced?
- Why hasn't it sold? Are there any deal-killer items the seller is aware of (foundation, flood, title, zoning, code violations)?
- Is there a deadline driving the sale (1031 exchange, divorce, estate, relocation)? That informs how much negotiation room exists.
- What's the average days-on-market for RENTAL listings here right now (not sales)? A rising rental-DOM trend means longer vacancies and softer asking-rent achievability than the comps imply.
- What's the recent tenant-quality profile in this submarket — average credit score on applications, eviction rate, late-payment / NSF rate, and stable-employment percentage? A property-management company in the area should have these aggregated.
- How much new for-sale + rental construction is in the pipeline within 1–3 miles? Heavy new supply typically softens prices + rents 12–24 months out; constrained supply supports both.
Investment metrics
- 1% rule
- 1.57% ✓
- Cap rate
- 13.02%
- Cash-on-cash
- 24.04%
- DSCR
- 2.07
- GRM
- 5.3
CMA / ARV
- ARV (median comp)
- $143,079
- List price
- $84,000
- Delta
- -41.29%
- Verdict
- UNDERPRICED
- Comps
- 20 within 1.0 mi
Show comp detail 12 sales within ~0.75 mi
| Address | Dist | Beds/Ba | Sqft | Sold | Price | $/sf | Match |
|---|---|---|---|---|---|---|---|
| 1301 Kimball St | 0.19mi | 3/1.0 | 840 (-5%) | 8mo | $135,000 | $161 | 75 |
| 815 John St | 0.35mi | 2/1.0 (-1) | 885 (-0%) | 5mo | $104,000 | $118 | 74 |
| 1108 Seymour | 0.27mi | 2/1.5 (-1) | 883 (-1%) | 10mo | $70,000 | $79 | 71 |
| 1501 Swinton St | 0.36mi | 2/1.5 (-1) | 912 (+3%) | 3mo | $144,500 | $158 | 69 |
| 813 E 9th Ave | 0.36mi | 3/1.0 | 816 (-8%) | 10mo | $145,000 | $178 | 61 |
| 811 Augusta St | 0.22mi | 3/1.0 | 995 (+12%) | 12mo | $149,900 | $151 | 60 |
| 810 Court St | 0.40mi | 3/1.5 | 985 (+11%) | 2mo | $75,000 | $76 | 59 |
| 1612 Minneapolis St | 0.44mi | 3/1.0 | 1,002 (+13%) | 3mo | $95,000 | $95 | 55 |
| 1600 Superior St | 0.38mi | 2/1.0 (-1) | 980 (+10%) | 13mo | $152,000 | $155 | 49 |
| 532 Cedar St | 0.52mi | 2/1.0 (-1) | 792 (-11%) | 6mo | $110,000 | $139 | 48 |
| 1307 Davitt St | 0.59mi | 2/1.0 (-1) | 816 (-8%) | 10mo | $120,000 | $147 | 45 |
| 122 W 10th Ave | 0.65mi | 2/1.0 (-1) | 982 (+11%) | 6mo | $125,000 | $127 | 42 |
Match score weights: distance 35% · size 25% · config 20% · recency 20%. Top-matched comps best support the ARV.
Projected returns pro-forma
-3.0% appreciation · 3.0% rent growth · sell at horizon
- IRR
- 17.3%
- Equity multiple
- 1.70×
- Total profit
- $16,408
- Equity at exit
- $12,525
- IRR
- 25.8%
- Equity multiple
- 3.25×
- Total profit
- $52,976
- Equity at exit
- $7,263
Cash invested: $23,520 (down + closing). Projections, not guarantees.
Landlord ↔ Tenant lean methodology
- Overall (STATE)
- 62 Landlord-Friendly
- State Michigan
- 62 Landlord-Friendly · EVEN
- County
- — inherits STATE
- City
- — inherits STATE
ZIP-level market 49783
- Active inventory
- 125
- Price-to-rent
- 5.3×
Monthly cashflow live
- Estimated rent
- $1,315 medium interval (Pro) →
- Mortgage (P&I)
- −$441
- Tax from tax record
- −$92 /mo · $1,106/yr
- Insurance
- −$35
- HOA
- −$0
- Vacancy / Maint / Mgmt
- −$276
- Net cashflow
- $471
Break-even live
UW: 25.0% down · 7.5% · 30yr · 1.5% tax · 5.0% vac · 8.0% maint · 8.0% mgmt
Financing live
Cash to close
- Down payment
- $21,000
- Closing costs
- $2,520
- Reserves months
- —
- Total cash needed
- —
Loan-product check · same deal, 3 products live
Conventional
25% down · 7.5% · 30yr
- Down + closing
- —
- Monthly P&I
- —
- Monthly cashflow
- —
- DSCR
- —
- Eligible?
- —
Personal DTI + credit; lowest rate.
DSCR
20% down · 8.5% · 30yr
- Down + closing
- —
- Monthly P&I
- —
- Monthly cashflow
- —
- DSCR
- —
- Eligible?
- —
No personal income docs; deal must DSCR.
Hard money
10% down · 12.0% · 12mo
- Down + closing
- —
- Monthly P&I
- —
- Monthly cashflow
- —
- DSCR
- —
- Eligible?
- —
Short-term bridge; refi at stabilization.
Rent comps 1 comps
| Address | Beds | Baths | Sqft | Rent | $/sqft | DOM | Units | Dist |
|---|---|---|---|---|---|---|---|---|
| 215 Osborn Blvd Sault Ste. Marie, MI | 2.0 | 1.0 | 994 | $1,315 | $1.32 | 43d | 2 | 0.82mi |
Listing history 24 events
-
2026-06-18days on market $84,000 Active 205 DOM
-
2026-06-17days on market $84,000 Active 204 DOM
-
2026-06-17price $84,000 Active 203 DOM
-
2026-06-16days on market $89,000 Active 203 DOM
-
2026-06-15days on market $89,000 Active 202 DOM
-
2026-06-13days on market $89,000 Active 200 DOM
-
2026-06-12days on market $89,000 Active 199 DOM
-
2026-06-09days on market $89,000 Active 196 DOM
-
2026-06-08days on market $89,000 Active 195 DOM
-
2026-06-07days on market $89,000 Active 194 DOM
-
2026-06-07days on market $89,000 Active 193 DOM
-
2026-06-04days on market $89,000 Active 190 DOM
-
2026-06-02days on market $89,000 Active 189 DOM
-
2026-06-01days on market $89,000 Active 188 DOM
-
2026-05-31days on market $89,000 Active 187 DOM
-
2026-05-31days on market $89,000 Active 186 DOM
-
2026-05-08price $89,000 453-char remark
Show marketing remark (453 chars)
A 3-bedroom home under $100,000 is hard to find these days, and this one is a solid option. Great for first-time buyers or as a rental investment, it offers 3 bedrooms on the second floor, with bath and laundry on the main level. Enjoy an enclosed front porch, enclosed side entry, and a full basement for storage. Features include 100-amp breakers, a Williamson furnace with a new motor, and a cement parking pad off the alley. Vacant and easy to show!
-
2025-11-25$99,000 Active 453-char remark
Show marketing remark (453 chars)
A 3-bedroom home under $100,000 is hard to find these days, and this one is a solid option. Great for first-time buyers or as a rental investment, it offers 3 bedrooms on the second floor, with bath and laundry on the main level. Enjoy an enclosed front porch, enclosed side entry, and a full basement for storage. Features include 100-amp breakers, a Williamson furnace with a new motor, and a cement parking pad off the alley. Vacant and easy to show!
-
2025-09-16status Active
-
2025-08-14price $109,000
-
2025-07-03price $119,000
-
2025-06-12$129,000 Active
-
2019-12-23soldstatus $29,000
-
2011-07-28soldstatus $38,200
ⓘ Source: listings_history table (triggers on properties + properties_extension) + one-shot
backfill from property_details.listing_events for pre-trigger history.
Tax reassessment forecast MI · Partial reset (capped growth)
- Current annual tax
- $1,106 · $92/mo
- Projected year-2 tax
- $1,200 · $100/mo
- Expected delta
- +$94/yr (+$8/mo · 8.5%)
ⓘ Screening estimate from a state-policy table — verify with the county assessor before closing.
Climate risk First Street
- Flood 1/10 Low FEMA zone X (unshaded) · 0% chance over 30 yrs
- Wildfire 1/10 Low
- Heat 1/10 Low 7 d/yr ≥88°F today · 13 d/yr by 30 yrs out
- Wind 1/10 Low
- Air quality 1/10 Low 0 unhealthy d/yr today · 0 by 30 yrs out
Nearby sold comps map
Loading sold comps map…
Walkable amenities ~0.75 mi
Loading nearby amenities…
Taxation est. · year 1
- Rental income
- $15,780
- − Mortgage interest
- −$4,705
- − Property taxes
- −$1,106
- − Insurance
- −$420
- − Repairs & maintenance
- −$1,262
- − Management
- −$1,262
- − Depreciation
- −$2,444
- Taxable income
- $4,580
- Est. tax owed @ 24.0%
- −$1,099
- After-tax cash flow
- $4,555/yr
For passive investors: Depreciation is non-cash, so a rental often shows a tax loss while cash-flowing — sheltering income. Rental losses are passive: they offset passive income freely, and up to $25,000/yr can offset ordinary (W-2) income if you actively participate and your MAGI is under $100k (phasing out to $0 by $150k); unused losses carry forward. On sale, claimed depreciation is recaptured at up to 25%, and gains may owe capital-gains tax (a 1031 exchange can defer both). Figures are a year-1 estimate at your 24.0% rate — not tax advice; consult a CPA.
Schools (NCES district)
- District
- Sault Ste. Marie Area Schools
- NCES district ID
- 2630990
- Math proficiency
- 35% ▼ -9.00%
- Reading proficiency
- 44% ▼ -12.00%
- Median HH income
- $40,273
- Composite
- 33.12/100
- National rank
- #5559
- State rank
- #230 of 540 in MI
Livability — Sault Ste. Marie
No livability data for this city. (Only ~50 U.S. cities are tracked.)
Census & demographics
- Census place
- Sault Ste. Marie, MI
- Population (ZIP)
- 18,778
Population outlook (Chippewa County) Hauer SSP2
- Today (2025)
- 37,043 people
- By 2030
- 36,431 · -1.7%
- By 2040
- 34,911 · -5.8%
- By 2050
- 33,350 · -10.0%
- By 2075
- 29,789 · -19.6%
- By 2100
- 24,171 · -34.7%
Race, ethnicity, and origin ACS 2023
- Neighborhood character
- Predominantly White (70%)
- Race & ethnicity
- White 70% Native American 14% Two or more races 13% Hispanic / Latino 2%
- Common ancestry
- Lithuanian 6% Romanian 6% Slovak 4%
- Foreign-born
- 4% · Canada, Vietnam, Guatemala
- Languages at home
- 95% English-only · Spanish 1% Other Indo-European 1% German/W. Germanic 1%
Political lean MEDSL · Chippewa
- 2024 margin
- Strong R (+24.2) · D 37.0% · R 61.3% · Other 1.7%
- 2008→2024 swing
- -23.8pp toward R · 2008: -0.5pp · 2024: -24.2pp
- All cycles
- 2024: R+24.2 2020: R+22.9 2016: R+24.2 2012: R+7.6 2008: R+0.5
Not yet ingested
- Civics
- —
Market trends
- HPI YoY
- ▼ -183.63%
- Current HPI
- 149.9878
- Rent YoY
- —
- Metro
- —
- State GDP YoY
- ▲ 1.37%
- F500 in state
- 28
Industry mix (Fortune 500 HQ in MI)
| Industry | F500 HQs | Revenue |
|---|---|---|
| Automotive Parts | 3 | $48B |
|
||
| Automotive | 2 | $372B |
|
||
| Chemicals | 1 | $45B |
|
||
| Automotive Retail | 1 | $29B |
|
||
| Healthcare / Medical Devices | 1 | $23B |
|
||
| Automotive Technology | 1 | $20B |
|
||
Price history
+133.0% since first listed8 events — show timeline
- 2026-05-08 Price Changed $89,000 EUPBR
- 2025-11-25 Listed $99,000 EUPBR
- 2025-09-16 Relisted — EUPBR
- 2025-08-14 Price Changed $109,000 EUPBR
- 2025-07-03 Price Changed $119,000 EUPBR
- 2025-06-12 Listed $129,000 EUPBR
- 2019-12-23 Sold (Public Records) $29,000 Public Records
- 2011-07-28 Sold (Public Records) $38,200 Public Records
Property tax history
-0.6%/yrLatest (2024): $1,106 · +192.7% YoY. Source: county tax records.
Cash-flow waterfall
monthlySold comps — $/sqft
last 12 mo · ≤1 miLoading sold comps…