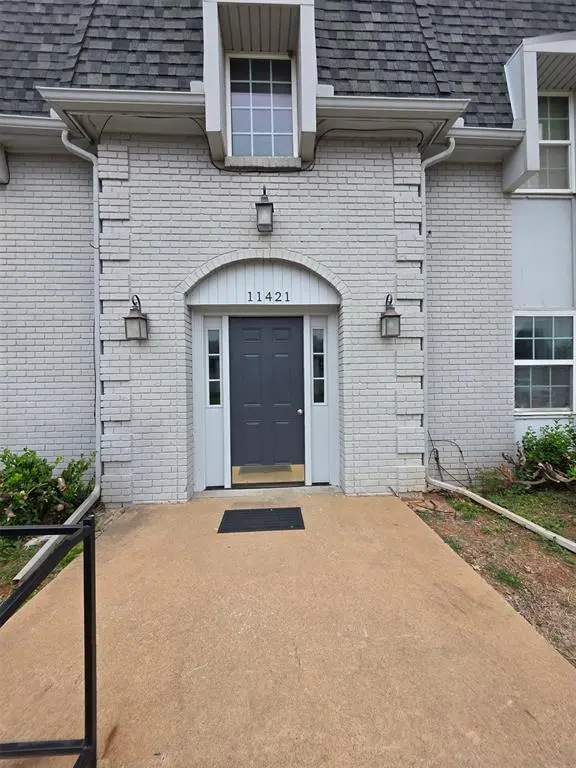
11421 N May Ave Unit A · Oklahoma City, OK
Flood risk 1/10 · Minimal
- FEMA flood zone
- X (unshaded)
- Chance of flooding over 30 yrs
- 0.0%
- Est. flood insurance / yr
- $507 – $1,088
Fire risk 1/10 · Minimal
- Est. fire insurance / yr
- $2,463 – $4,575
Heat risk 6/10 · Moderate
- Hot days now (above 107°F)
- 7 days/yr
- Hot days in 30 yrs
- 19 days/yr
Wind risk 2/10 · Minimal
- Chance of severe wind over 30 yrs
- 4.0%
Air-quality risk 2/10 · Minimal
- Unhealthy air days now
- 1 days/yr
- Unhealthy air days in 30 yrs
- 1 days/yr
Risk factors via First Street. Map © Google.
Why this score? — see what drove the B grade
The composite is a weighted blend of 9 inputs, each scored 0–100. Each bar is that input's sub-score; the figure is the points it added to the 100-point composite (weight × sub-score).
- Cash flow +26.6/30.0
- ARV discount +15.0/15.0
- 1% rule +10.0/10.0
- DSCR +9.1/10.0
- Livability +4.0/5.0
- Rent growth +3.0/5.0
- Condition / age +2.5/5.0
- Schools +0.7/10.0
- Appreciation +0.0/10.0
$75,000
🖨 Deal sheet 📄 Offer letter ✓ Due diligence
Listing remarks
Investor opportunity at The Barrington. Convenient north OKC location near Lake Hefner, shopping, restaurants, Kilpatrick Turnpike, and Hefner Parkway. HOA covers water, sewer, trash, exterior maintenance, lawn care, building insurance, and common amenities. Buyer to verify HOA, condition, financing, rental restrictions, and all information.
Key facts
- $250 HOA
- Built 1977
- Listed 42 days
Property features AI
Finance
- Other: Listed as active and occupied: no; Living area reported as 900 (assessor)
- Financial info: Not assumable
- HOA & community: Mandatory association dues; Annual association fee of $3,000 (includes insurance)
Exterior
- Home design: Condominium; Residential property; Lower-level unit; Existing property
- Construction: Brick construction; Other roof type; Combination foundation
- Exterior features: Balcony; Homestead eligible
Interior
- Bedrooms: 2 bedrooms (lower level condo)
- Bathrooms: 1 full bathroom; 1 half bathroom
- Heating & cooling: Electric heating
- Interior features: One living area; No fireplace
Neighborhood map
What this means for you Summary
Snapshot
- This is a 2-bed/2.0-bath condo listed at $75k.
Deal economics
- At list price, monthly cash flow is $202 ($2k/yr) — positive.
- The deal already cash-flows at list — no discount required.
- Meets the 1% rule at list price ($1k rent vs $75k).
- Recommended offer: $73k (3.0% below list) — sets the bar for market timing.
- Cap rate 9.5% vs local median 3.7% in Oklahoma City — top-decile yield for the area; either an underpriced asset or a hidden risk that comps aren't pricing in. Stress-test before assuming the spread holds.
Location & tenants
- Location reads 80/100 on livability (#3 in OK, #1,635 nationally) — a professional / high-income tenant draw. Strengths: amenities A+, commute A+, cost of living A+; Watch: crime F.
- Oklahoma City (urban): math 7% / reading 10% proficiency, ranked #254 of 270 in OK (top 94%) — low school quality limits family demand, transient renter base, plan for 1-2y turnover; 82% free/reduced lunch — lower-income household profile, screen leases tightly.
- Zoned schools: Quail Creek Es (math 17% / reading 17%, grade F, #540 of 845 statewide, top 68%, 543 students, 0% FRL); John Marshall Hs (math 2% / reading 8%, grade F, #430 of 447 statewide, top 99%, 829 students, 0% FRL) — zoned schools average 0% FRL vs 82% district-wide (82 pts lower); this property's tenant base skews higher-income than the district average.
- Market conditions: Rents rising (+2.0%/yr); 333 active listings in the ZIP; 18 comparable units currently listed for rent nearby; rentals leasing fast (median 4d on market — plan ~1-2 weeks tenant-placement turnaround); 5,365 units permitted in Oklahoma County in 2024 (569 in 5+ unit buildings).
Forward outlook
- Local home prices are declining (-3.0%/yr); year-one equity from $519 of loan paydown is wiped out by about $2k of value loss. Plan a longer hold.
- Oklahoma County population projected at +41% by 2050 — long-run rental-demand tailwind backs the buy-and-hold thesis.
Negotiation context
- It's been on market 43 days — a 3% lower offer ($73k) is reasonable based on typical stale-listing flexibility.
- Current owner paid $42k; list at $75k implies a 76% gain — meaningful room to come down on a strong offer.
Risks & watch-outs
- Watch-outs: HOA is 21% of rent.
- Climate carrying-cost: extreme-heat days projected 7→19/yr by 2055 (HVAC capex compounding) — expect insurance premiums to compound above CPI over the hold.
Questions for the listing agent
- It's been on market 43 days. Have you received any prior offers? Is the seller open to a 3% concession, seller financing, or rate buy-down credit?
- Built in 1977 — when were the roof, HVAC, electrical panel, plumbing, and water heater last replaced?
- What does the HOA fee cover, when was the last increase, and are there any pending special assessments or reserve-fund shortfalls?
- Any open or pending special assessments — roof, HVAC, plumbing, elevator, façade? What's the per-unit balance and payoff schedule, and is the seller paying it off at close or rolling it to the buyer?
- Is there a deadline driving the sale (1031 exchange, divorce, estate, relocation)? That informs how much negotiation room exists.
- Schools are F-rated, which usually means shorter tenancies and higher turnover. Who's the typical renter profile here, and what's been the actual vacancy rate?
- Crime grade is F in this area — have there been break-ins, vandalism, or insurance claims at this property in the last 3 years? What carrier currently insures it and at what premium?
- What's the average days-on-market for RENTAL listings here right now (not sales)? A rising rental-DOM trend means longer vacancies and softer asking-rent achievability than the comps imply.
- What's the recent tenant-quality profile in this submarket — average credit score on applications, eviction rate, late-payment / NSF rate, and stable-employment percentage? A property-management company in the area should have these aggregated.
- How much new apartment / multifamily construction is in the pipeline within 1–3 miles? Heavy new supply (>2% of stock underway) typically softens rents 12–24 months out; light construction supports rent growth.
Investment metrics
- 1% rule
- 1.56% ✓
- Cap rate
- 9.52%
- Cash-on-cash
- 11.53%
- DSCR
- 1.51
- GRM
- 5.3
CMA / ARV
- ARV (median comp)
- $103,307
- List price
- $75,000
- Delta
- -27.40%
- Verdict
- UNDERPRICED
- Comps
- 20 within 1.0 mi
Projected returns pro-forma
-3.0% appreciation · 2.05% rent growth · sell at horizon
- IRR
- -0.3%
- Equity multiple
- 0.99×
- Total profit
- $-271
- Equity at exit
- $11,183
- IRR
- 8.2%
- Equity multiple
- 1.59×
- Total profit
- $12,424
- Equity at exit
- $6,485
Cash invested: $21,000 (down + closing). Projections, not guarantees.
Landlord ↔ Tenant lean methodology
- Overall (STATE)
- 83 Strongly Landlord-Friendly
- State Oklahoma
- 83 Strongly Landlord-Friendly · R+20
- County
- — inherits STATE
- City
- — inherits STATE
ZIP-level market 73120
- Rents YoY
- 2.0%
- Active inventory
- 333
- Price-to-rent
- 5.3×
Monthly cashflow live
- Estimated rent
- $1,173 high interval (Pro) →
- Mortgage (P&I)
- −$393
- Tax from tax record
- −$50 /mo · $603/yr
- Insurance
- −$31
- HOA
- −$250
- Vacancy / Maint / Mgmt
- −$246
- Net cashflow
- $202
Break-even live
UW: 25.0% down · 7.5% · 30yr · 1.5% tax · 5.0% vac · 8.0% maint · 8.0% mgmt
Financing live
Cash to close
- Down payment
- $18,750
- Closing costs
- $2,250
- Reserves months
- —
- Total cash needed
- —
Loan-product check · same deal, 3 products live
Conventional
25% down · 7.5% · 30yr
- Down + closing
- —
- Monthly P&I
- —
- Monthly cashflow
- —
- DSCR
- —
- Eligible?
- —
Personal DTI + credit; lowest rate.
DSCR
20% down · 8.5% · 30yr
- Down + closing
- —
- Monthly P&I
- —
- Monthly cashflow
- —
- DSCR
- —
- Eligible?
- —
No personal income docs; deal must DSCR.
Hard money
10% down · 12.0% · 12mo
- Down + closing
- —
- Monthly P&I
- —
- Monthly cashflow
- —
- DSCR
- —
- Eligible?
- —
Short-term bridge; refi at stabilization.
Rent comps 18 comps
| Address | Beds | Baths | Sqft | Rent | $/sqft | DOM | Units | Dist |
|---|---|---|---|---|---|---|---|---|
| 11004 N May Ave Oklahoma City, OK | 1.0–2.0 | 1.0–2.5 | 1129 | $1,170 | $1.04 | 11d | 1 | 0.16mi |
| 11550 N May Ave Oklahoma City, OK | 1.0 | 1.0 | 662 | $950 | $1.44 | 20d | 1 | 0.17mi |
| 11141 Springhollow Rd Unit 208 Oklahoma City, OK | 2.0 | 2.0 | 1088 | $1,125 | $1.03 | 43d | 1 | 0.68mi |
| 2700 Indian Creek Blvd Oklahoma City, OK | 1.0–3.0 | 1.0–2.0 | 1261 | $1,164 | $0.92 | 2d | 5 | 0.78mi |
| 11409 Springhollow Rd #505 Oklahoma City, OK | 1.0 | 1.0 | 801 | $1,250 | $1.56 | 43d | 1 | 0.81mi |
| 11130 Stratford Dr Oklahoma City, OK | 1.0 | 1.0 | 625 | $975 | $1.56 | 43d | 1 | 0.89mi |
| 11431 Springhollow Rd #1305 Oklahoma City, OK | 1.0 | 1.0 | 801 | $1,050 | $1.31 | 43d | 1 | 0.89mi |
| 11239 N Pennsylvania Ave Oklahoma City, OK | 1.0–2.0 | 1.0–2.0 | 850 | $1,155 | $1.36 | 4d | 30 | 0.91mi |
| 2401 NW 122nd St Oklahoma City, OK | 1.0–2.0 | 1.0–2.0 | 844 | $899 | $1.06 | 23d | 1 | 0.95mi |
| 2301 NW 122nd St Oklahoma City, OK | 1.0 | 1.0 | 723 | $940 | $1.30 | 2d | 28 | 1.02mi |
| 12821 Stratford Dr Oklahoma City, OK | 2.0 | 2.0 | 1043 | $1,078 | $1.03 | 2d | 1 | 1.12mi |
| 12831 Stratford Dr Oklahoma City, OK | 1.0–3.0 | 1.0–2.0 | 1122 | $2,295 | $2.05 | 1d | 22 | 1.24mi |
| 1800 NW 115th St Oklahoma City, OK | 1.0–3.0 | 1.0–2.0 | 1019 | $1,705 | $1.67 | 2d | 8 | 1.32mi |
| 2300 Carlton Way Oklahoma City, OK | 1.0 | 1.0 | 700 | $899 | $1.28 | 16d | 1 | 1.34mi |
| 12701 N Pennsylvania Ave Oklahoma City, OK | 3.0 | 1.0–2.0 | 912 | $1,358 | $1.49 | 1d | 15 | 1.34mi |
| 2609 Featherstone Rd Oklahoma City, OK | 1.0–2.0 | 1.0–2.0 | 769 | $1,150 | $1.50 | 2d | 34 | 1.42mi |
| 3959 NW 122nd St Oklahoma City, OK | 1.0–2.0 | 1.0–2.0 | 758 | $1,063 | $1.40 | 2d | 31 | 1.42mi |
| 2801 Croydon Ct Oklahoma City, OK | 2.0 | 1.0 | 1102 | $1,550 | $1.41 | 2d | 1 | 1.50mi |
HOA detail condo
- Monthly dues
- $250 · $3,000/yr
- Likely covers
- watersewertrashlandscapingexterior maint.insurance
- Assessments
- None detected in remarks — confirm with the listing agent.
Listing history 16 events
-
2026-06-18days on market $75,000 Active 43 DOM
-
2026-06-17days on market $75,000 Active 42 DOM
-
2026-06-16days on market $75,000 Active 41 DOM
-
2026-06-15days on market $75,000 Active 40 DOM
-
2026-06-13days on market $75,000 Active 38 DOM
-
2026-06-09days on market $75,000 Active 34 DOM
-
2026-06-08days on market $75,000 Active 33 DOM
-
2026-06-07days on market $75,000 Active 32 DOM
-
2026-06-05days on market $75,000 Active 29 DOM
-
2026-06-03days on market $75,000 Active 28 DOM
-
2026-06-02days on market $75,000 Active 27 DOM
-
2026-06-01days on market $75,000 Active 26 DOM
-
2026-05-31days on market $75,000 Active 25 DOM
-
2026-05-08price $75,000 343-char remark
-
2026-05-06$90,000 Active 343-char remark
-
1984-05-01soldstatus $42,500
ⓘ Source: listings_history table (triggers on properties + properties_extension) + one-shot
backfill from property_details.listing_events for pre-trigger history.
Tax reassessment forecast OK · Resets to sale price
- Current annual tax
- $603 · $50/mo
- Projected year-2 tax
- $675 · $56/mo
- Expected delta
- +$72/yr (+$6/mo · 11.9%)
ⓘ Screening estimate from a state-policy table — verify with the county assessor before closing.
Climate risk First Street
- Flood 1/10 Low FEMA zone X (unshaded) · 0% chance over 30 yrs
- Wildfire 1/10 Low
- Heat 6/10 Major 7 d/yr ≥107°F today · 19 d/yr by 30 yrs out
- Wind 2/10 Low 4% chance of damaging wind over 30 yrs
- Air quality 2/10 Low 1 unhealthy d/yr today · 1 by 30 yrs out
Nearby sold comps map
Loading sold comps map…
Walkable amenities ~0.75 mi
Loading nearby amenities…
Taxation est. · year 1
- Rental income
- $14,074
- − Mortgage interest
- −$4,201
- − Property taxes
- −$603
- − Insurance
- −$375
- − Repairs & maintenance
- −$1,126
- − Management
- −$1,126
- − HOA
- −$3,000
- − Depreciation
- −$2,182
- Taxable income
- $1,461
- Est. tax owed @ 24.0%
- −$351
- After-tax cash flow
- $2,070/yr
For passive investors: Depreciation is non-cash, so a rental often shows a tax loss while cash-flowing — sheltering income. Rental losses are passive: they offset passive income freely, and up to $25,000/yr can offset ordinary (W-2) income if you actively participate and your MAGI is under $100k (phasing out to $0 by $150k); unused losses carry forward. On sale, claimed depreciation is recaptured at up to 25%, and gains may owe capital-gains tax (a 1031 exchange can defer both). Figures are a year-1 estimate at your 24.0% rate — not tax advice; consult a CPA.
Schools (NCES district)
- District
- Oklahoma City
- NCES district ID
- 4022770
- Math proficiency
- 7% ▼ -5.00%
- Reading proficiency
- 10% ▼ -6.00%
- Median HH income
- $35,606
- Composite
- 7.0/100
- National rank
- #9970
- State rank
- #254 of 270 in OK
Livability — Oklahoma City
- Score
- 80/100
- State rank
- #3
- US rank
- #1635
Category grades
Schools grade is shown separately in the Schools card above.
Census & demographics
- Census place
- Oklahoma City, OK
- County
- Oklahoma County · 771,644 people
- City population
- 498,656
- Metro
- Oklahoma City, OK
- Population (ZIP)
- 35,559
- Household income
- $64,745
- Rent vs Own
- Severe rent burden
- 2029.0
Population outlook (Oklahoma County) Hauer SSP2
- Today (2025)
- 911,875 people
- By 2030
- 982,413 · +7.7%
- By 2040
- 1,130,468 · +24.0%
- By 2050
- 1,288,422 · +41.3%
- By 2075
- 1,711,482 · +87.7%
- By 2100
- 2,088,448 · +129.0%
Race, ethnicity, and origin ACS 2023
- Neighborhood character
- Diverse neighborhood (Simpson 0.62)
- Race & ethnicity
- White 57% Black 21% Two or more races 11% Hispanic / Latino 7% Native American 3% Asian 2%
- Hispanic origin (detail)
- Mexican 4%
- Common ancestry
- Italian 3% Slovak 2% Lithuanian 2%
- Foreign-born
- 7% · Canada, China, Jamaica
- Languages at home
- 92% English-only · Spanish 4% French/Haitian/Cajun 1% Other Asian/Pacific 1%
Political lean MEDSL · Oklahoma
- 2024 margin
- Toss-up / Even · D 48.0% · R 49.7% · Other 2.3%
- 2008→2024 swing
- +15.1pp toward D · 2008: -16.8pp · 2024: -1.7pp
- All cycles
- 2024: R+1.7 2020: R+1.1 2016: R+10.5 2012: R+16.7 2008: R+16.8
Not yet ingested
- Civics
- —
Market trends
- HPI YoY
- ▼ -279.69%
- Current HPI
- 227.2832
- Rent YoY
- ▲ 2.05%
- Metro
- Oklahoma City, OK
- State GDP YoY
- ▲ 1.55%
- F500 in state
- 6
Industry mix (Fortune 500 HQ in OK)
| Industry | F500 HQs | Revenue |
|---|---|---|
| Energy | 3 | $48B |
|
||
Price history
+76.5% since first listed3 events — show timeline
- 2026-05-08 Price Changed $75,000 MLSOK
- 2026-05-06 Listed $90,000 MLSOK
- 1984-05-01 Sold (Public Records) $42,500 Public Records
Property tax history
+4.1%/yrLatest (2025): $603 · +2.8% YoY. Source: county tax records.
Cash-flow waterfall
monthlySold comps — $/sqft
last 12 mo · ≤1 miLoading sold comps…