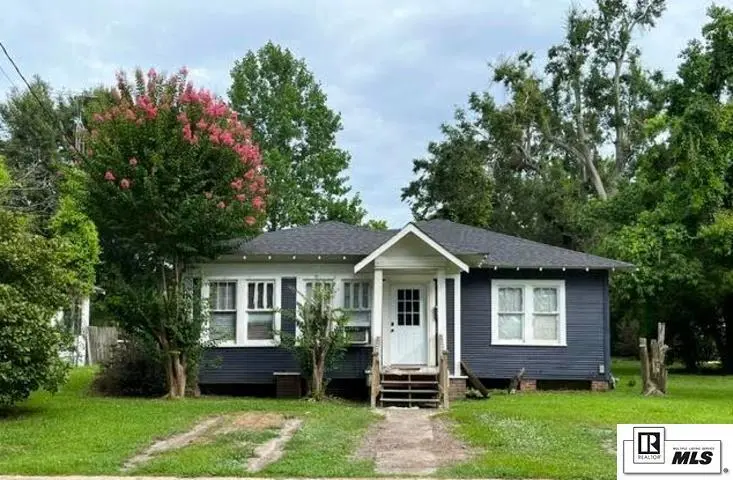
502 Lasalle St · Tallulah, LA
Flood risk No data
- FEMA flood zone
- —
- Chance of flooding over 30 yrs
- —
- Est. flood insurance / yr
- —
Fire risk No data
- Est. fire insurance / yr
- —
Heat risk No data
- Hot days now (above threshold)
- —
- Hot days in 30 yrs
- —
Wind risk No data
- Chance of severe wind over 30 yrs
- —
Air-quality risk No data
- Unhealthy air days now
- —
- Unhealthy air days in 30 yrs
- —
Risk factors via First Street. Map © Google.
Why this score? — see what drove the B grade
The composite is a weighted blend of 9 inputs, each scored 0–100. Each bar is that input's sub-score; the figure is the points it added to the 100-point composite (weight × sub-score).
- Cash flow +30.0/30.0
- 1% rule +10.0/10.0
- DSCR +10.0/10.0
- ARV discount +7.5/15.0
- Appreciation +6.0/10.0
- Livability +3.1/5.0
- Rent growth +2.5/5.0
- Condition / age +2.5/5.0
- Schools +0.4/10.0
$65,000
🖨 Deal sheet 📄 Offer letter ✓ Due diligence
Listing remarks MLS
Don't miss out on this charming 2 bedroom, 1 bath home! The home features a very nice sunroom with large windows for plenty of natural light. This cute house is a must see. Please contact your local realtor today.
Key facts
- New bathroom tub
- Gas fireplace
- Updated roof
Tags
Property features AI
Finance
- HOA & community: No association amenities
Exterior
- Utilities: Public water; Public sewer; Natural gas available and connected
- Home design: Single-family residence; One story; Entry level: 1; Site-built construction
- Construction: Frame construction; Asphalt roof; Crawl space foundation; Built as residential (site build)
- Exterior features: Landscaped lot; Irregular lot
Interior
- Kitchen: Gas range; Microwave
- Bedrooms: 2 bedrooms on the main level
- Bathrooms: 1 full bathroom on the main level
- Heating & cooling: Natural gas heating with wall furnace; Ceiling fans; Attic fan; Wall/window cooling units
- Interior features: Ceiling fan(s); Blinds; Gas log fireplace
- Laundry & utility: Gas water heater
Neighborhood map
What this means for you Summary
Snapshot
- This is a 2-bed/1.0-bath single-family listed at $65k.
Deal economics
- At list price, monthly cash flow is $2k ($18k/yr) — positive.
- The deal already cash-flows at list — no discount required.
- Meets the 1% rule at list price ($2k rent vs $65k).
Location & tenants
- Location reads 61/100 on livability (#230 in LA) — a middle-class / working-renter tenant base. Strengths: cost of living A+, housing A+; Watch: health & safety D, schools F, amenities F.
- Madison Parish (town): math 3% / reading 10% proficiency, ranked #98 of 98 in LA (top 100%) — low school quality limits family demand, transient renter base, plan for 1-2y turnover; 87% free/reduced lunch — lower-income household profile, screen leases tightly.
- Market conditions: 25 active listings in the ZIP; 2 units permitted in Madison Parish in 2024 (0 in 5+ unit buildings).
Forward outlook
- In year one you build about $2k of equity ($449 loan paydown + $1k appreciation (1.9% local appreciation)).
- Madison County population projected at -18% by 2050 — secular population decline; favor cash flow + early exit over multi-decade hold.
- At projected returns (1.9% appreciation + 3.0% rent growth), your $18k cash investment doubles in ~1 year — after that, you're playing with house money.
Negotiation context
- Only 13 days on market — expect competitive offers; lowballing is unlikely to land.
- 8 sale attempts since 4y ago with the ask held roughly flat each time — persistent listings suggest the price (not the market) is what's stuck; bring a comps-based counter.
- Current owner paid $52k; 25% above their basis — modest negotiation headroom, anchor on the comps not their cost.
Risks & watch-outs
- Watch-outs: built in 1930 — expect roof / HVAC / electrical / plumbing capex.
Questions for the listing agent
- Built in 1930 — when were the roof, HVAC, electrical panel, plumbing, and water heater last replaced?
- Is there a deadline driving the sale (1031 exchange, divorce, estate, relocation)? That informs how much negotiation room exists.
- Schools are F-rated, which usually means shorter tenancies and higher turnover. Who's the typical renter profile here, and what's been the actual vacancy rate?
- What's the average days-on-market for RENTAL listings here right now (not sales)? A rising rental-DOM trend means longer vacancies and softer asking-rent achievability than the comps imply.
- What's the recent tenant-quality profile in this submarket — average credit score on applications, eviction rate, late-payment / NSF rate, and stable-employment percentage? A property-management company in the area should have these aggregated.
- How much new for-sale + rental construction is in the pipeline within 1–3 miles? Heavy new supply typically softens prices + rents 12–24 months out; constrained supply supports both.
Investment metrics
- 1% rule
- 3.74% ✓
- Cap rate
- 34.00%
- Cash-on-cash
- 98.96%
- DSCR
- 5.40
- GRM
- 2.2
CMA / ARV
- ARV (on-the-fly)
- $140,670
- Comps found
- 2
Show comp detail 2 sales within ~0.75 mi
| Address | Dist | Beds/Ba | Sqft | Sold | Price | $/sf | Match |
|---|---|---|---|---|---|---|---|
| 912 Arkansas St | 0.33mi | 3/1.0 (+1) | 1,350 (-14%) | 15mo | $32,000 | $24 | 45 |
| 106 Magnolia St | 0.71mi | 3/2.0 (+1) | 1,441 (-8%) | 22mo | $130,000 | $90 | 27 |
Match score weights: distance 35% · size 25% · config 20% · recency 20%. Top-matched comps best support the ARV.
Projected returns pro-forma
1.93% appreciation · 3.0% rent growth · sell at horizon
- IRR
- —
- Equity multiple
- 6.49×
- Total profit
- $99,835
- Equity at exit
- $25,393
- IRR
- —
- Equity multiple
- 13.43×
- Total profit
- $226,155
- Equity at exit
- $36,380
Cash invested: $18,200 (down + closing). Projections, not guarantees.
Landlord ↔ Tenant lean methodology
- Overall (STATE)
- 90 Strongly Landlord-Friendly
- State Louisiana
- 90 Strongly Landlord-Friendly · R+12
- County
- — inherits STATE
- City
- — inherits STATE
ZIP-level market 71282
- Home prices YoY
- 1.2%
- Active inventory
- 25
- Price-to-rent
- 2.2×
Monthly cashflow live
- Estimated rent
- $2,429 medium interval (Pro) →
- Mortgage (P&I)
- −$341
- Tax from tax record
- −$50 /mo · $601/yr
- Insurance
- −$27
- HOA
- −$0
- Vacancy / Maint / Mgmt
- −$510
- Net cashflow
- $1,501
Break-even live
UW: 25.0% down · 7.5% · 30yr · 1.5% tax · 5.0% vac · 8.0% maint · 8.0% mgmt
Financing live
Cash to close
- Down payment
- $16,250
- Closing costs
- $1,950
- Reserves months
- —
- Total cash needed
- —
Loan-product check · same deal, 3 products live
Conventional
25% down · 7.5% · 30yr
- Down + closing
- —
- Monthly P&I
- —
- Monthly cashflow
- —
- DSCR
- —
- Eligible?
- —
Personal DTI + credit; lowest rate.
DSCR
20% down · 8.5% · 30yr
- Down + closing
- —
- Monthly P&I
- —
- Monthly cashflow
- —
- DSCR
- —
- Eligible?
- —
No personal income docs; deal must DSCR.
Hard money
10% down · 12.0% · 12mo
- Down + closing
- —
- Monthly P&I
- —
- Monthly cashflow
- —
- DSCR
- —
- Eligible?
- —
Short-term bridge; refi at stabilization.
Listing history 11 events
-
2026-06-19days on market $65,000 Active 13 DOM
-
2026-06-18days on market $65,000 Active 12 DOM
-
2026-06-17days on market $65,000 Active 11 DOM
-
2026-06-16days on market $65,000 Active 10 DOM
-
2026-06-15days on market $65,000 Active 9 DOM
-
2026-06-14days on market $65,000 Active 7 DOM
-
2026-06-12days on market $65,000 Active 6 DOM
-
2026-06-09days on market $65,000 Active 3 DOM
-
2026-06-08days on market $65,000 Active 2 DOM
-
2026-06-07remarks 542-char remark
-
2026-06-07$65,000 Active 1 DOM
ⓘ Source: listings_history table (triggers on properties + properties_extension) + one-shot
backfill from property_details.listing_events for pre-trigger history.
Tax reassessment forecast LA · Resets to sale price
- Current annual tax
- $601 · $50/mo
- Projected year-2 tax
- $601 · $50/mo
- Expected delta
- $0/yr ($0/mo · 0.0%)
ⓘ Screening estimate from a state-policy table — verify with the county assessor before closing.
Nearby sold comps map
Loading sold comps map…
Walkable amenities ~0.75 mi
Loading nearby amenities…
Taxation est. · year 1
- Rental income
- $29,148
- − Mortgage interest
- −$3,641
- − Property taxes
- −$601
- − Insurance
- −$325
- − Repairs & maintenance
- −$2,332
- − Management
- −$2,332
- − Depreciation
- −$1,891
- Taxable income
- $18,026
- Est. tax owed @ 24.0%
- −$4,326
- After-tax cash flow
- $13,684/yr
For passive investors: Depreciation is non-cash, so a rental often shows a tax loss while cash-flowing — sheltering income. Rental losses are passive: they offset passive income freely, and up to $25,000/yr can offset ordinary (W-2) income if you actively participate and your MAGI is under $100k (phasing out to $0 by $150k); unused losses carry forward. On sale, claimed depreciation is recaptured at up to 25%, and gains may owe capital-gains tax (a 1031 exchange can defer both). Figures are a year-1 estimate at your 24.0% rate — not tax advice; consult a CPA.
Schools (NCES district)
- District
- Madison Parish
- NCES district ID
- 2201050
- Math proficiency
- 3% ▼ -32.00%
- Reading proficiency
- 10% ▼ -32.00%
- Median HH income
- $26,166
- Composite
- 4.42/100
- National rank
- #10055
- State rank
- #98 of 98 in LA
Livability — Tallulah
- Score
- 61/100
- State rank
- #230
- US rank
- #17435
Category grades
Schools grade is shown separately in the Schools card above.
Census & demographics
- Census place
- Tallulah, LA
- Population (ZIP)
- 8,998
Population outlook (Madison County) Hauer SSP2
- Today (2025)
- 10,899 people
- By 2030
- 10,468 · -4.0%
- By 2040
- 9,680 · -11.2%
- By 2050
- 8,990 · -17.5%
- By 2075
- 7,739 · -29.0%
- By 2100
- 6,531 · -40.1%
Race, ethnicity, and origin ACS 2023
- Neighborhood character
- Predominantly Black (67%)
- Race & ethnicity
- Black 67% White 29% Hispanic / Latino 3% Two or more races 3%
- Common ancestry
- Lithuanian 2% Serbian 1%
- Foreign-born
- 1% · Canada
- Languages at home
- 97% English-only · Spanish 2% French/Haitian/Cajun 1%
Political lean MEDSL · Madison
- 2024 margin
- Lean D (+6.2) · D 52.5% · R 46.2% · Other 1.3%
- 2008→2024 swing
- -11.7pp toward R · 2008: 17.9pp · 2024: 6.2pp
- All cycles
- 2024: D+6.2 2020: D+15.5 2016: D+17.3 2012: D+22.2 2008: D+17.9
Not yet ingested
- Civics
- —
Market trends
- HPI YoY
- ▲ 1.93%
- Current HPI
- 165.76
- Rent YoY
- —
- Metro
- —
- State GDP YoY
- ▲ 3.29%
- F500 in state
- 10
Industry mix (Fortune 500 HQ in LA)
| Industry | F500 HQs | Revenue |
|---|---|---|
| Telecommunications | 2 | $23B |
|
||
| Utilities | 1 | $12B |
|
||
| Wholesale / Distribution | 1 | $5B |
|
||
| Advertising | 1 | $2B |
|
||
Price history
-13.3% since first listed18 events — show timeline
- 2026-06-06 Listed $65,000 NELABOR
- 2024-10-03 Relisted — NELABOR
- 2024-10-03 Price Changed $73,500 NELABOR
- 2024-07-12 Price Changed $74,000 NELABOR
- 2024-07-01 Relisted — NELABOR
- 2024-04-23 Price Changed $75,000 NELABOR
- 2024-01-01 Relisted — NELABOR
- 2024-01-01 Price Changed $78,900 NELABOR
- 2023-10-28 Relisted — NELABOR
- 2023-09-07 Price Changed $79,900 NELABOR
- 2023-08-30 Relisted — NELABOR
- 2023-08-24 Delisted — NELABOR
- 2023-06-10 Price Changed $85,000 NELABOR
- 2023-04-29 Listed $90,000 NELABOR
- 2022-08-09 Sold (Public Records) $52,000 Public Records
- 2022-07-29 Sold (MLS) — NELABOR
- 2022-05-29 Pending — NELABOR
- 2022-05-17 Listed $75,000 NELABOR
Property tax history
+0.7%/yrLatest (2025): $601 · +0.0% YoY. Source: county tax records.
Cash-flow waterfall
monthlySold comps — $/sqft
last 12 mo · ≤1 miLoading sold comps…