Holopaw Groves Rd · St. Cloud, FL
Flood risk 1/10 · Minimal
- FEMA flood zone
- AE
- Chance of flooding over 30 yrs
- 0.0%
- Est. flood insurance / yr
- $1,737 – $8,500
Fire risk 8/10 · Major
- Est. fire insurance / yr
- $947 – $1,759
Heat risk 8/10 · Major
- Hot days now (above 108°F)
- 7 days/yr
- Hot days in 30 yrs
- 21 days/yr
Wind risk 9/10 · Severe
- Chance of severe wind over 30 yrs
- 99.0%
Air-quality risk 1/10 · Minimal
- Unhealthy air days now
- 0 days/yr
- Unhealthy air days in 30 yrs
- 0 days/yr
Risk factors via First Street. Map © Google.
Why this score? — see what drove the C grade
The composite is a weighted blend of 9 inputs, each scored 0–100. Each bar is that input's sub-score; the figure is the points it added to the 100-point composite (weight × sub-score).
- Cash flow +22.6/30.0
- ARV discount +7.5/15.0
- DSCR +7.2/10.0
- 1% rule +5.9/10.0
- Appreciation +4.8/10.0
- Schools +3.6/10.0
- Rent growth +2.9/5.0
- Livability +2.5/5.0
- Condition / age +2.5/5.0
$175,000
🖨 Deal sheet 📄 Offer letter ✓ Due diligence
Listing remarks
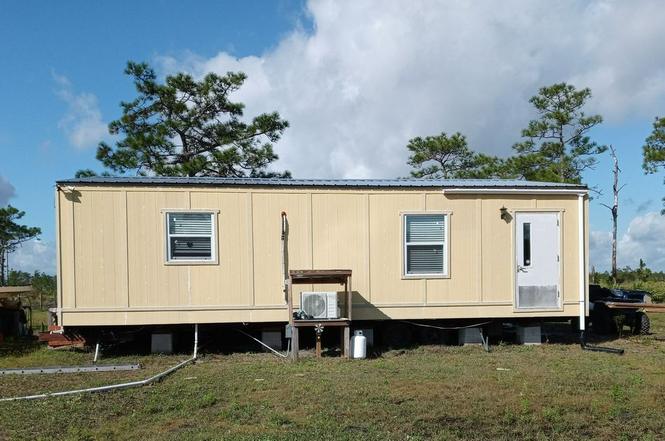
Come to the woods and live Off Grid. Welcome to this newly remodeled spacious double wide home that sits on 2.5 acres. Everything you need is here. Inside you will find one over size bedroom and bathroom. A large open kitchen with a 5 ft island and farmhouse sink. There's even a laundry/ mud room. 1.25 acres is fully fenced in and has 3 large out buildings. One has a good size loft for extra sleeping area. The other 1.25 acres is ready for your vision. Bring your 4 wheeler or big truck and play all weekend. * * Must have 4 wheel drive to get to camp.
Key facts
- 5 ft island
- Laundry mud room
- Fully fenced
Tags
Property features AI
Exterior
- Home design: House; 880 square feet
- Exterior features: 2.5 acre lot
Neighborhood map
What this means for you Summary
Snapshot
- This is a 1-bed/1.0-bath land listed at $175k.
Deal economics
- At list price, monthly cash flow is $-129 ($-2k/yr) — negative.
- To cash-flow at today's rent, offer at most $156k (10.6% below list).
- Meets the 1% rule at list price ($2k rent vs $175k).
- Recommended offer: $154k (12.0% below list) — sets the bar for market timing.
- Cap rate 8.3% vs local median 4.0% in St. Cloud — top-decile yield for the area; either an underpriced asset or a hidden risk that comps aren't pricing in. Stress-test before assuming the spread holds.
Location & tenants
- Location reads: area grade C — affects rentability + tenant quality, not the cash-flow math above.
- Osceola (suburban): math 39% / reading 45% proficiency, ranked #60 of 73 in FL (top 82%) — families likely to look elsewhere, expect single-tenant / working-renter base with shorter leases; 60% free/reduced lunch — lower-income household profile, screen leases tightly.
- Market conditions: Rents rising (+1.8%/yr); 383 active listings in the ZIP; solid renter incomes; 8,813 units permitted in Osceola County in 2024 (3,072 in 5+ unit buildings).
Forward outlook
- In year one you build about $393 of equity ($1k loan paydown + $-817 appreciation (-0.5% local appreciation)).
- Osceola County population projected at +73% by 2050 — long-run rental-demand tailwind backs the buy-and-hold thesis.
Negotiation context
- It's been on market 123 days — a 12% lower offer ($154k) is reasonable based on typical stale-listing flexibility.
- 3 sale attempts since 9y ago with the ask held roughly flat each time — persistent listings suggest the price (not the market) is what's stuck; bring a comps-based counter.
- Current owner paid $4k; list at $175k implies a 4900% gain — meaningful room to come down on a strong offer.
Risks & watch-outs
- Watch-outs: flood insurance adds $427/mo.
- Climate carrying-cost: in FEMA flood zone AE (mandatory federal flood insurance); severe wind risk, 99% chance of damaging wind over 30y; severe wildfire risk; extreme-heat days projected 7→21/yr by 2055 (HVAC capex compounding) — expect insurance premiums to compound above CPI over the hold.
Questions for the listing agent
- What do current leases actually rent for vs. the listed asking? Can we see a recent rent roll and the last 12 months of T-12 income?
- It's been on market 123 days. Have you received any prior offers? Is the seller open to a 12% concession, seller financing, or rate buy-down credit?
- What's the actual annual flood-insurance premium (NFIP or private), and is the property in a SFHA with mandatory coverage?
- Why hasn't it sold? Are there any deal-killer items the seller is aware of (foundation, flood, title, zoning, code violations)?
- Is there a deadline driving the sale (1031 exchange, divorce, estate, relocation)? That informs how much negotiation room exists.
- What's the average days-on-market for RENTAL listings here right now (not sales)? A rising rental-DOM trend means longer vacancies and softer asking-rent achievability than the comps imply.
- What's the recent tenant-quality profile in this submarket — average credit score on applications, eviction rate, late-payment / NSF rate, and stable-employment percentage? A property-management company in the area should have these aggregated.
- How much new for-sale + rental construction is in the pipeline within 1–3 miles? Heavy new supply typically softens prices + rents 12–24 months out; constrained supply supports both.
Investment metrics
- 1% rule
- 1.09% ✓
- Cap rate
- 8.34%
- Cash-on-cash
- 7.30%
- DSCR
- 1.32
- GRM
- 7.6
CMA / ARV
No comps found within radius.
Projected returns pro-forma
-0.47% appreciation · 1.79% rent growth · sell at horizon
- IRR
- -8.7%
- Equity multiple
- 0.61×
- Total profit
- $-19,119
- Equity at exit
- $46,770
- IRR
- -3.5%
- Equity multiple
- 0.66×
- Total profit
- $-16,457
- Equity at exit
- $53,085
Cash invested: $49,000 (down + closing). Projections, not guarantees.
Landlord ↔ Tenant lean methodology
- Overall (STATE)
- 87 Strongly Landlord-Friendly
- State Florida
- 87 Strongly Landlord-Friendly · R+3
- County
- — inherits STATE
- City
- — inherits STATE
ZIP-level market 34773
- Home prices YoY
- -0.2%
- Rents YoY
- 1.8%
- Active inventory
- 383
- Price-to-rent
- 7.6×
Monthly cashflow live
- Estimated rent
- $1,908 medium interval (Pro) →
- Mortgage (P&I)
- −$918
- Tax est. 1.5%
- −$219 /mo · $2,625/yr
- Insurance
- −$73
- Flood insurance flood zone
- −$427 /mo · $5,118/yr
- HOA
- −$0
- Vacancy / Maint / Mgmt
- −$401
- Net cashflow
- $-129
Break-even live
UW: 25.0% down · 7.5% · 30yr · 1.5% tax · 5.0% vac · 8.0% maint · 8.0% mgmt
Financing live
Cash to close
- Down payment
- $43,750
- Closing costs
- $5,250
- Reserves months
- —
- Total cash needed
- —
Loan-product check · same deal, 3 products live
Conventional
25% down · 7.5% · 30yr
- Down + closing
- —
- Monthly P&I
- —
- Monthly cashflow
- —
- DSCR
- —
- Eligible?
- —
Personal DTI + credit; lowest rate.
DSCR
20% down · 8.5% · 30yr
- Down + closing
- —
- Monthly P&I
- —
- Monthly cashflow
- —
- DSCR
- —
- Eligible?
- —
No personal income docs; deal must DSCR.
Hard money
10% down · 12.0% · 12mo
- Down + closing
- —
- Monthly P&I
- —
- Monthly cashflow
- —
- DSCR
- —
- Eligible?
- —
Short-term bridge; refi at stabilization.
Listing history 20 events
-
2026-06-18days on market $175,000 Active 123 DOM
-
2026-06-17days on market $175,000 Active 122 DOM
-
2026-06-16days on market $175,000 Active 121 DOM
-
2026-06-15days on market $175,000 Active 120 DOM
-
2026-06-13days on market $175,000 Active 118 DOM
-
2026-06-13days on market $175,000 Active 117 DOM
-
2026-06-10days on market $175,000 Active 114 DOM
-
2026-06-08days on market $175,000 Active 113 DOM
-
2026-06-07days on market $175,000 Active 112 DOM
-
2026-06-04days on market $175,000 Active 109 DOM
-
2026-06-03days on market $175,000 Active 108 DOM
-
2026-06-02days on market $175,000 Active 107 DOM
-
2026-06-02days on market $175,000 Active 106 DOM
-
2026-05-31days on market $175,000 Active 105 DOM
-
2026-02-15$175,000 Active
-
2017-05-22historical
-
2017-05-22historical
-
2017-02-23Active
-
2017-02-23Active
-
2013-04-15soldstatus $3,500
ⓘ Source: listings_history table (triggers on properties + properties_extension) + one-shot
backfill from property_details.listing_events for pre-trigger history.
Climate risk First Street
- Flood 1/10 Low FEMA zone AE · 0% chance over 30 yrs
- Wildfire 8/10 Severe
- Heat 8/10 Severe 7 d/yr ≥108°F today · 21 d/yr by 30 yrs out
- Wind 9/10 Extreme 99% chance of damaging wind over 30 yrs
- Air quality 1/10 Low 0 unhealthy d/yr today · 0 by 30 yrs out
Nearby sold comps map
Loading sold comps map…
Walkable amenities ~0.75 mi
Loading nearby amenities…
Taxation est. · year 1
- Rental income
- $22,895
- − Mortgage interest
- −$9,803
- − Property taxes
- −$2,625
- − Insurance
- −$5,994
- − Repairs & maintenance
- −$1,832
- − Management
- −$1,832
- − Depreciation
- −$5,091
- Taxable loss
- −$4,280
- Est. tax savings @ 24.0%
- +$1,027
- After-tax cash flow
- $-517/yr
For passive investors: Depreciation is non-cash, so a rental often shows a tax loss while cash-flowing — sheltering income. Rental losses are passive: they offset passive income freely, and up to $25,000/yr can offset ordinary (W-2) income if you actively participate and your MAGI is under $100k (phasing out to $0 by $150k); unused losses carry forward. On sale, claimed depreciation is recaptured at up to 25%, and gains may owe capital-gains tax (a 1031 exchange can defer both). Figures are a year-1 estimate at your 24.0% rate — not tax advice; consult a CPA.
Schools (NCES district)
- District
- Osceola
- NCES district ID
- 1201470
- Math proficiency
- 39% ▼ -9.00%
- Reading proficiency
- 45% ▼ -4.00%
- Median HH income
- $45,528
- Composite
- 35.7/100
- National rank
- #4865
- State rank
- #60 of 73 in FL
Livability — St. Cloud
No livability data for this city. (Only ~50 U.S. cities are tracked.)
Census & demographics
- County
- Osceola County · 410,217 people
- City population
- 29,247
- Metro
- Orlando-Kissimmee-Sanford, FL
- Population (ZIP)
- 5,816
- Household income
- $80,524
- Rent vs Own
- Severe rent burden
- 47.0
Population outlook (Osceola County) Hauer SSP2
- Today (2025)
- 447,624 people
- By 2030
- 511,823 · +14.3%
- By 2040
- 642,986 · +43.6%
- By 2050
- 774,552 · +73.0%
- By 2075
- 1,078,144 · +140.9%
- By 2100
- 1,269,660 · +183.6%
Race, ethnicity, and origin ACS 2023
- Neighborhood character
- Majority White (59%)
- Race & ethnicity
- White 59% Hispanic / Latino 33% Two or more races 11%
- Hispanic origin (detail)
- Puerto Rican 20%
- Common ancestry
- Portuguese 5% Slovak 3% Romanian 2%
- Foreign-born
- 12% · Canada, South Korea
- Languages at home
- 67% English-only · Spanish 27% Other Indo-European 4% German/W. Germanic 1%
Political lean MEDSL · Osceola
- 2024 margin
- Toss-up / Even · D 48.7% · R 50.2% · Other 1.1%
- 2008→2024 swing
- -21.2pp toward R · 2008: 19.7pp · 2024: -1.4pp
- All cycles
- 2024: R+1.4 2020: D+13.8 2016: D+25.0 2012: D+24.5 2008: D+19.7
Not yet ingested
- Civics
- —
Market trends
- HPI YoY
- ▼ -0.47%
- Current HPI
- 279.5662
- Rent YoY
- ▲ 1.79%
- Metro
- Orlando-Kissimmee-Sanford, FL
- State GDP YoY
- ▲ 3.28%
- F500 in state
- 36
Industry mix (Fortune 500 HQ in FL)
| Industry | F500 HQs | Revenue |
|---|---|---|
| Industrial Technology | 2 | $29B |
|
||
| Insurance | 2 | $17B |
|
||
| Retail | 1 | $60B |
|
||
| Technology Distribution | 1 | $58B |
|
||
| Homebuilding | 1 | $35B |
|
||
| Technology Manufacturing | 1 | $35B |
|
||
Price history
+4900.0% since first listed6 events — show timeline
- 2026-02-15 Listed $175,000 ForSaleByOwner.com
- 2017-05-22 Delisted — NSBMLS
- 2017-05-22 Delisted — NSBMLS
- 2017-02-23 Listed — NSBMLS
- 2017-02-23 Listed — NSBMLS
- 2013-04-15 Sold (Public Records) $3,500 Public Records
Property tax history
+0.6%/yrLatest (2025): $10 · +3.8% YoY. Source: county tax records.
Cash-flow waterfall
monthlySold comps — $/sqft
last 12 mo · ≤1 miLoading sold comps…