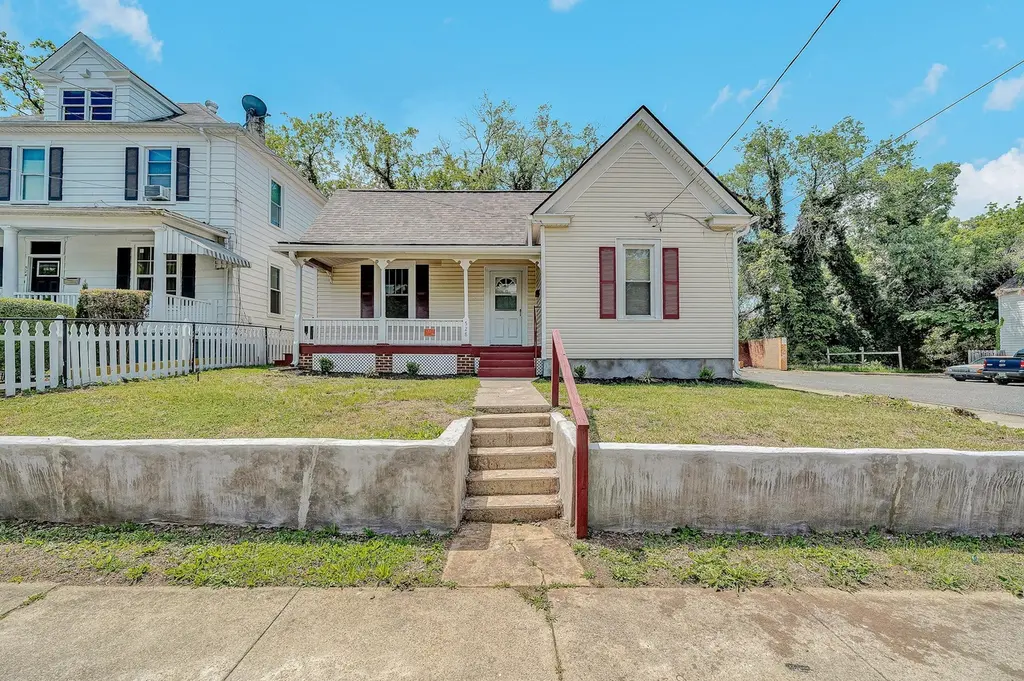
528 Rutherford Ave NW · Roanoke, VA
Flood risk 1/10 · Minimal
- FEMA flood zone
- X (unshaded)
- Chance of flooding over 30 yrs
- 0.0%
- Est. flood insurance / yr
- $507 – $1,088
Fire risk 1/10 · Minimal
- Est. fire insurance / yr
- $666 – $1,236
Heat risk 5/10 · Moderate
- Hot days now (above 101°F)
- 7 days/yr
- Hot days in 30 yrs
- 18 days/yr
Wind risk 2/10 · Minimal
- Chance of severe wind over 30 yrs
- 1.0%
Air-quality risk 2/10 · Minimal
- Unhealthy air days now
- 1 days/yr
- Unhealthy air days in 30 yrs
- 1 days/yr
Risk factors via First Street. Map © Google.
Why this score? — see what drove the D- grade
The composite is a weighted blend of 9 inputs, each scored 0–100. Each bar is that input's sub-score; the figure is the points it added to the 100-point composite (weight × sub-score).
- Cash flow +17.0/30.0
- DSCR +5.3/10.0
- Schools +4.1/10.0
- Livability +3.7/5.0
- 1% rule +3.6/10.0
- Rent growth +2.7/5.0
- Condition / age +2.5/5.0
- ARV discount +0.0/15.0
- Appreciation +0.0/10.0
$150,000
🖨 Deal sheet 📄 Offer letter ✓ Due diligence
Listing remarks
Charming one-level living conveniently located just minutes from downtown Roanoke, I-581, shopping, and restaurants! This well-maintained 2-bedroom, 1-bath home features an eat-in kitchen, fresh paint, new carpet, and a walk-in shower. Enjoy a level yard perfect for outdoor activities, gardening, or pets, along with a welcoming covered front porch ideal for relaxing mornings or evenings. This is a great opportunity for first-time buyers, downsizers, or anyone looking for convenient, low-maintenance living!
Key facts
- Covered front porch
- Level yard
- One-level living
Tags
Property features AI
Exterior
- Parking: Street parking
- Home design: Residential property; Built in 1925
- Construction: Crawl space basement
- Exterior features: Front porch
Interior
- Bedrooms: 2 bedrooms (both on the main level)
- Flooring: Carpet; Vinyl
- Bathrooms: 1 full bathroom (main level)
- Heating & cooling: Forced air gas heating; Has cooling
- Interior features: Insulated windows; Carpet and vinyl flooring
Neighborhood map
What this means for you Summary
Snapshot
- This is a 3-bed/1.0-bath single-family listed at $150k.
Deal economics
- At list price, monthly cash flow is $102 ($1k/yr) — positive.
- The deal already cash-flows at list — no discount required.
- To meet the 1% rule (rent ≥ 1% of price), the offer needs to be $129k (13.8% below list).
- Recommended offer: $129k (13.8% below list) — sets the bar for 1% rule.
- Cap rate 7.1% vs local median 4.2% in Roanoke — top-decile yield for the area; either an underpriced asset or a hidden risk that comps aren't pricing in. Stress-test before assuming the spread holds.
Location & tenants
- Location reads 73/100 on livability (#163 in VA) — a middle-class / working-renter tenant base. Strengths: cost of living A+, health & safety A+, housing A; Watch: amenities C-, employment D, crime F.
- Roanoke City Public School District (urban): math 40% / reading 58% proficiency, ranked #102 of 131 in VA (top 78%) — families likely to look elsewhere, expect single-tenant / working-renter base with shorter leases; 67% free/reduced lunch — lower-income household profile, screen leases tightly.
- Zoned schools: Lincoln Terrace Elementary (math 22% / reading 32%, grade F, #1,029 of 1,108 statewide, top 94%, 297 students, 103% FRL); Patrick Henry High (math 57% / reading 77%, grade B, #185 of 319 statewide, top 61%, 2,005 students, 95% FRL) — zoned schools average 99% FRL vs 67% district-wide (32 pts higher); higher-poverty schools than district average — tighter screening recommended.
- Market conditions: Rents flat; 89 active listings in the ZIP; 33 comparable units currently listed for rent nearby; rentals at typical pace (median 21d on market — plan ~3-4 weeks tenant-placement turnaround); 48% of comp listings sitting > 30 days — soft ceiling on asking rent; 113 units permitted in Roanoke city in 2024 (0 in 5+ unit buildings).
- This rent runs 33% of the median local income ($47k/yr) — at the standard rent-burdened threshold; future hikes will face affordability resistance.
Forward outlook
- Local home prices are declining (-3.0%/yr); year-one equity from $1k of loan paydown is wiped out by about $4k of value loss. Plan a longer hold.
- Roanoke County population projected at +11% by 2050 — modest demand growth; plan on rents tracking national, not racing it.
Negotiation context
- It's been on market 41 days — a 3% lower offer ($146k) is reasonable based on typical stale-listing flexibility.
- Current owner paid $9k; list at $150k implies a 1605% gain — meaningful room to come down on a strong offer.
Risks & watch-outs
- Watch-outs: built in 1925 — expect roof / HVAC / electrical / plumbing capex.
- Climate carrying-cost: extreme-heat days projected 7→18/yr by 2055 (HVAC capex compounding) — expect insurance premiums to compound above CPI over the hold.
Questions for the listing agent
- It's been on market 41 days. Have you received any prior offers? Is the seller open to a 14% concession, seller financing, or rate buy-down credit?
- Built in 1925 — when were the roof, HVAC, electrical panel, plumbing, and water heater last replaced?
- Is there a deadline driving the sale (1031 exchange, divorce, estate, relocation)? That informs how much negotiation room exists.
- Schools are A-rated — typically a magnet for longer-tenancy family renters. What's the average tenant stay here, and is there a school-zone premium baked into asking?
- Crime grade is F in this area — have there been break-ins, vandalism, or insurance claims at this property in the last 3 years? What carrier currently insures it and at what premium?
- The area grade is low — what's the realistic commute time and amenity access for the typical tenant pool here? Any planned neighborhood developments (good or bad) we should know about?
- What's the average days-on-market for RENTAL listings here right now (not sales)? A rising rental-DOM trend means longer vacancies and softer asking-rent achievability than the comps imply.
- What's the recent tenant-quality profile in this submarket — average credit score on applications, eviction rate, late-payment / NSF rate, and stable-employment percentage? A property-management company in the area should have these aggregated.
- How much new for-sale + rental construction is in the pipeline within 1–3 miles? Heavy new supply typically softens prices + rents 12–24 months out; constrained supply supports both.
Investment metrics
- 1% rule
- 0.86% ✗
- Cap rate
- 7.11%
- Cash-on-cash
- 2.91%
- DSCR
- 1.13
- GRM
- 9.7
CMA / ARV
- ARV (median comp)
- $125,484
- List price
- $150,000
- Delta
- 19.54%
- Verdict
- OVERPRICED
- Comps
- 20 within 1.0 mi
Show comp detail 11 sales within ~0.75 mi
| Address | Dist | Beds/Ba | Sqft | Sold | Price | $/sf | Match |
|---|---|---|---|---|---|---|---|
| 321 Patton Ave NW | 0.19mi | 3/1.5 | 1,144 (+7%) | 3mo | $190,000 | $166 | 74 |
| 607 Loudon Ave NW | 0.23mi | 3/1.5 | 1,163 (+9%) | 2mo | $195,000 | $168 | 71 |
| 205 Harrison Ave NW | 0.28mi | 3/1.0 | 1,077 (+1%) | 17mo | $171,140 | $159 | 71 |
| 607 Rutherford Ave NW | 0.09mi | 3/2.0 | 1,107 (+4%) | 18mo | $192,500 | $174 | 70 |
| 310 Patton Ave NW | 0.22mi | 3/1.0 | 1,120 (+5%) | 17mo | $60,000 | $54 | 67 |
| 712 Harrison Ave NW | 0.15mi | 3/1.0 | 1,134 (+6%) | 19mo | $110,000 | $97 | 66 |
| 1227 Loudon Ave NW | 0.64mi | 3/1.0 | 1,118 (+5%) | 2mo | $95,000 | $85 | 60 |
| 548 Rutherford Ave NW | 0.05mi | 3/1.0 | 1,204 (+13%) | 22mo | $76,500 | $64 | 58 |
| 205 Patton Ave NW | 0.31mi | 3/1.0 | 918 (-14%) | 15mo | $125,000 | $136 | 51 |
| 815 Gilmer Ave NW | 0.28mi | 3/1.0 | 1,198 (+12%) | 20mo | $90,000 | $75 | 49 |
| 1210 Mercer Ave NW | 0.66mi | 2/1.0 (-1) | 944 (-11%) | 12mo | $125,000 | $132 | 35 |
Match score weights: distance 35% · size 25% · config 20% · recency 20%. Top-matched comps best support the ARV.
Projected returns pro-forma
-3.0% appreciation · 0.72% rent growth · sell at horizon
- IRR
- -14.1%
- Equity multiple
- 0.51×
- Total profit
- $-20,764
- Equity at exit
- $22,365
- IRR
- -9.0%
- Equity multiple
- 0.49×
- Total profit
- $-21,303
- Equity at exit
- $12,969
Cash invested: $42,000 (down + closing). Projections, not guarantees.
Landlord ↔ Tenant lean methodology
- Overall (STATE)
- 55 Moderately Landlord-Leaning
- State Virginia
- 55 Moderately Landlord-Leaning · D+2
- County
- — inherits STATE
- City
- — inherits STATE
ZIP-level market 24016
- Home prices YoY
- -27.6%
- Rents YoY
- 0.7%
- Active inventory
- 89
- Price-to-rent
- 9.7×
Monthly cashflow live
- Estimated rent
- $1,294 high interval (Pro) →
- Mortgage (P&I)
- −$787
- Tax from tax record
- −$71 /mo · $851/yr
- Insurance
- −$62
- HOA
- −$0
- Vacancy / Maint / Mgmt
- −$272
- Net cashflow
- $102
Break-even live
UW: 25.0% down · 7.5% · 30yr · 1.5% tax · 5.0% vac · 8.0% maint · 8.0% mgmt
Financing live
Cash to close
- Down payment
- $37,500
- Closing costs
- $4,500
- Reserves months
- —
- Total cash needed
- —
Loan-product check · same deal, 3 products live
Conventional
25% down · 7.5% · 30yr
- Down + closing
- —
- Monthly P&I
- —
- Monthly cashflow
- —
- DSCR
- —
- Eligible?
- —
Personal DTI + credit; lowest rate.
DSCR
20% down · 8.5% · 30yr
- Down + closing
- —
- Monthly P&I
- —
- Monthly cashflow
- —
- DSCR
- —
- Eligible?
- —
No personal income docs; deal must DSCR.
Hard money
10% down · 12.0% · 12mo
- Down + closing
- —
- Monthly P&I
- —
- Monthly cashflow
- —
- DSCR
- —
- Eligible?
- —
Short-term bridge; refi at stabilization.
Rent comps 33 comps
| Address | Beds | Baths | Sqft | Rent | $/sqft | DOM | Units | Dist |
|---|---|---|---|---|---|---|---|---|
| 401 Rutherford Ave NW Roanoke, VA | 3.0 | 1.0 | 1064 | $1,450 | $1.36 | 44d | 1 | 0.12mi |
| 333 Harrison Ave NW Roanoke, VA | 3.0 | 2.0 | 1186 | $1,123 | $0.95 | 21d | 1 | 0.14mi |
| 717 Orange Ave NW Roanoke, VA | 2.0 | 1.0 | 738 | $900 | $1.22 | 44d | 1 | 0.27mi |
| 813 Gilmer Ave NW Roanoke, VA | 2.0 | 1.0 | 1050 | $1,322 | $1.26 | 21d | 1 | 0.29mi |
| 216 Patton Ave NW Unit 2 Roanoke, VA | 2.0 | 1.0 | 1240 | $1,025 | $0.83 | 21d | 1 | 0.29mi |
| 1007 Gilmer Ave NW Roanoke, VA | 2.0 | 2.0 | 1187 | $1,175 | $0.99 | 21d | 1 | 0.42mi |
| 1116 Fairfax Ave NW Roanoke, VA | 2.0 | 1.0 | 800 | $1,400 | $1.75 | 21d | 1 | 0.51mi |
| 1515 Dunbar St NW Roanoke, VA | 3.0 | 2.0 | 1058 | $1,623 | $1.53 | 13d | 1 | 0.58mi |
| 701 Salem Ave SW Roanoke, VA | 2.0 | 1.0 | 1250 | $1,950 | $1.56 | 44d | 1 | 0.59mi |
| 1117 Rugby Blvd NW Unit B Roanoke, VA | 2.0 | 1.0 | 1048 | $778 | $0.74 | 21d | 1 | 0.66mi |
| 1115 Grayson Ave NW Roanoke, VA | 4.0 | 2.0 | 1094 | $2,300 | $2.10 | 44d | 1 | 0.68mi |
| 802 Rorer Ave SW Apt A Roanoke, VA | 2.0 | 1.0 | 820 | $895 | $1.09 | 44d | 1 | 0.69mi |
| 10 12 1/2 St SW Roanoke, VA | 3.0 | 1.5 | 999 | $1,023 | $1.02 | 44d | 1 | 0.80mi |
| 430 Day Ave SW Unit A Roanoke, VA | 2.0 | 1.0 | 1444 | $1,650 | $1.14 | 44d | 1 | 0.84mi |
| 2916 Courtland Rd NW Roanoke, VA | 2.0 | 1.0 | 722 | $1,123 | $1.56 | 21d | 1 | 0.95mi |
| 1106 Campbell Ave SW Roanoke, VA | 2.0 | 1.0 | 850 | $950 | $1.12 | 13d | 1 | 0.97mi |
| 217 Mountain Ave SW Unit 217-2 Roanoke, VA | 2.0 | 1.0 | 700 | $945 | $1.35 | 44d | 1 | 0.98mi |
| 355 Highland Ave SW Apt 1 Roanoke, VA | 2.0 | 1.0 | 900 | $1,150 | $1.28 | 21d | 1 | 1.02mi |
| 44 Forest Hill Ave NE Roanoke, VA | 2.0 | 1.0 | 768 | $1,150 | $1.50 | 21d | 1 | 1.02mi |
| 1712 Wayne St NE Roanoke, VA | 2.0 | 1.0 | 826 | $1,250 | $1.51 | 21d | 1 | 1.02mi |
| 1533 Rugby Blvd NW Roanoke, VA | 3.0 | 1.0 | 1500 | $1,475 | $0.98 | 44d | 1 | 1.03mi |
| 1531 Syracuse Ave NW Roanoke, VA | 3.0 | 1.0 | 1488 | $1,675 | $1.13 | 44d | 1 | 1.06mi |
| 1119 Franklin Rd SW Unit BensonFranklin 05 Roanoke, VA | 2.0 | 1.0 | 900 | $1,297 | $1.44 | 44d | 1 | 1.15mi |
| 1920 Melrose Ave NW Roanoke, VA | 2.0 | 1.0 | 768 | $950 | $1.24 | 44d | 1 | 1.19mi |
| 1609 Chapman Ave SW Unit B Roanoke, VA | 4.0 | 1.0 | 1400 | $1,545 | $1.10 | 21d | 1 | 1.25mi |
| 2109 Colgate St NE Roanoke, VA | 3.0 | 1.0 | 1240 | $1,700 | $1.37 | 13d | 1 | 1.26mi |
| 1630 Patterson Ave SW Unit B Roanoke, VA | 3.0 | 1.0 | 1200 | $1,395 | $1.16 | 44d | 1 | 1.26mi |
| 2716 Edison St NE Unit & 2718 Roanoke, VA | 2.0 | 1.5 | 864 | $1,225 | $1.42 | 44d | 1 | 1.33mi |
| 439 Cedar Bluff Ave SE Roanoke, VA | 2.0 | 1.0 | 716 | $2,350 | $3.28 | 13d | 1 | 1.34mi |
| 1825 Patterson Ave SW Unit B Roanoke, VA | 2.0 | 1.0 | 1000 | $850 | $0.85 | 44d | 1 | 1.37mi |
| 1331 Main St SW Roanoke, VA | 2.0 | 1.0 | 877 | $1,023 | $1.17 | 21d | 1 | 1.39mi |
| 730 Murray Ave SE Roanoke, VA | 3.0 | 1.0 | 1163 | $1,525 | $1.31 | 44d | 1 | 1.47mi |
| 730 Murray Ave SE Roanoke, VA | 3.0 | 1.0 | 1163 | $1,525 | $1.31 | 21d | 1 | 1.47mi |
Listing history 18 events
-
2026-06-18days on market $150,000 Active 41 DOM
-
2026-06-17days on market $150,000 Active 40 DOM
-
2026-06-16days on market $150,000 Active 39 DOM
-
2026-06-15days on market $150,000 Active 38 DOM
-
2026-06-14days on market $150,000 Active 36 DOM
-
2026-06-13days on market $150,000 Active 35 DOM
-
2026-06-10days on market $150,000 Active 33 DOM
-
2026-06-09days on market $150,000 Active 32 DOM
-
2026-06-08days on market $150,000 Active 31 DOM
-
2026-06-05days on market $150,000 Active 27 DOM
-
2026-06-03days on market $150,000 Active 26 DOM
-
2026-06-02days on market $150,000 Active 25 DOM
-
2026-06-01days on market $150,000 Active 24 DOM
-
2026-05-31days on market $150,000 Active 23 DOM
-
2026-05-30days on market $150,000 Active 22 DOM
-
2026-05-08$150,000 Active 512-char remark
-
1993-04-01soldstatus $8,800
-
1989-08-28soldstatus $8,000
ⓘ Source: listings_history table (triggers on properties + properties_extension) + one-shot
backfill from property_details.listing_events for pre-trigger history.
Tax reassessment forecast VA · Resets to sale price
- Current annual tax
- $851 · $71/mo
- Projected year-2 tax
- $1,230 · $102/mo
- Expected delta
- +$379/yr (+$32/mo · 44.6%)
ⓘ Screening estimate from a state-policy table — verify with the county assessor before closing.
Climate risk First Street
- Flood 1/10 Low FEMA zone X (unshaded) · 0% chance over 30 yrs
- Wildfire 1/10 Low
- Heat 5/10 Major 7 d/yr ≥101°F today · 18 d/yr by 30 yrs out
- Wind 2/10 Low 100% chance of damaging wind over 30 yrs
- Air quality 2/10 Low 1 unhealthy d/yr today · 1 by 30 yrs out
Nearby sold comps map
Loading sold comps map…
Walkable amenities ~0.75 mi
Loading nearby amenities…
Taxation est. · year 1
- Rental income
- $15,524
- − Mortgage interest
- −$8,402
- − Property taxes
- −$851
- − Insurance
- −$750
- − Repairs & maintenance
- −$1,242
- − Management
- −$1,242
- − Depreciation
- −$4,364
- Taxable loss
- −$1,326
- Est. tax savings @ 24.0%
- +$318
- After-tax cash flow
- $1,542/yr
For passive investors: Depreciation is non-cash, so a rental often shows a tax loss while cash-flowing — sheltering income. Rental losses are passive: they offset passive income freely, and up to $25,000/yr can offset ordinary (W-2) income if you actively participate and your MAGI is under $100k (phasing out to $0 by $150k); unused losses carry forward. On sale, claimed depreciation is recaptured at up to 25%, and gains may owe capital-gains tax (a 1031 exchange can defer both). Figures are a year-1 estimate at your 24.0% rate — not tax advice; consult a CPA.
Schools (NCES district)
- District
- Roanoke City Public School District
- NCES district ID
- 5103300
- Math proficiency
- 40% ▼ -38.00%
- Reading proficiency
- 58% ▼ -12.00%
- Median HH income
- $38,592
- Composite
- 40.8/100
- National rank
- #3639
- State rank
- #102 of 131 in VA
Livability — Roanoke
- Score
- 73/100
- State rank
- #163
- US rank
- #5055
Category grades
Schools grade is shown separately in the Schools card above.
Census & demographics
- Census place
- Roanoke, VA
- County
- Roanoke City · 101,625 people
- City population
- 168,930
- Metro
- Roanoke, VA
- Population (ZIP)
- 10,521
- Household income
- $46,512
- Rent vs Own
- Severe rent burden
- 728.0
Population outlook (Roanoke County) Hauer SSP2
- Today (2025)
- 106,094 people
- By 2030
- 108,927 · +2.7%
- By 2040
- 114,104 · +7.5%
- By 2050
- 118,032 · +11.3%
- By 2075
- 123,363 · +16.3%
- By 2100
- 116,827 · +10.1%
Race, ethnicity, and origin ACS 2023
- Neighborhood character
- Diverse neighborhood (Simpson 0.58)
- Race & ethnicity
- Black 48% White 42% Two or more races 5% Hispanic / Latino 4% Asian 2%
- Common ancestry
- Italian 2% Serbian 1% Lithuanian 1%
- Foreign-born
- 5% · Canada, South Korea
- Languages at home
- 95% English-only · Spanish 2% French/Haitian/Cajun 1% Other Indo-European 1%
Political lean MEDSL · Roanoke
- 2024 margin
- Strong D (+23.6) · D 61.1% · R 37.5% · Other 1.4%
- 2008→2024 swing
- +0.2pp no change · 2008: 23.4pp · 2024: 23.6pp
- All cycles
- 2024: D+23.6 2020: D+25.8 2016: D+17.6 2012: D+21.5 2008: D+23.4
Not yet ingested
- Civics
- —
Market trends
- HPI YoY
- ▼ -98.06%
- Current HPI
- 257.8158
- Rent YoY
- ▲ 0.72%
- Metro
- Roanoke, VA
- State GDP YoY
- ▲ 2.40%
- F500 in state
- 50
Industry mix (Fortune 500 HQ in VA)
| Industry | F500 HQs | Revenue |
|---|---|---|
| Aerospace / Defense | 4 | $236B |
|
||
| Technology / Defense | 3 | $32B |
|
||
| Financial Services | 2 | $176B |
|
||
| Utilities | 2 | $27B |
|
||
| Insurance | 2 | $25B |
|
||
| Technology | 2 | $15B |
|
||
Price history
+1775.0% since first listed3 events — show timeline
- 2026-05-08 Listed $150,000 MLSRV
- 1993-04-01 Sold (Public Records) $8,800 Public Records
- 1989-08-28 Sold (Public Records) $8,000 Public Records
Property tax history
+10.6%/yrLatest (2025): $851 · +19.1% YoY. Source: county tax records.
Cash-flow waterfall
monthlySold comps — $/sqft
last 12 mo · ≤1 miLoading sold comps…