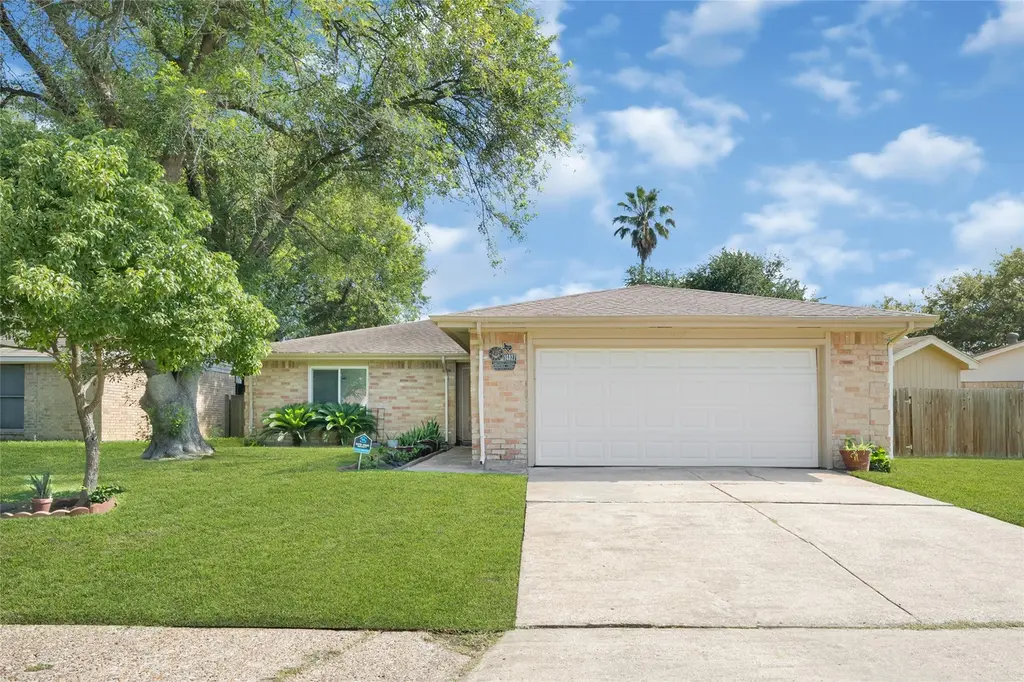
14927 Sheffield Ter · Channelview, TX
Flood risk 6/10 · Moderate
- FEMA flood zone
- X (unshaded)
- Chance of flooding over 30 yrs
- 0.7%
- Est. flood insurance / yr
- $507 – $1,088
Fire risk 3/10 · Minor
- Est. fire insurance / yr
- $1,222 – $2,270
Heat risk 9/10 · Severe
- Hot days now (above 109°F)
- 7 days/yr
- Hot days in 30 yrs
- 24 days/yr
Wind risk 9/10 · Severe
- Chance of severe wind over 30 yrs
- 99.0%
Air-quality risk 2/10 · Minimal
- Unhealthy air days now
- 2 days/yr
- Unhealthy air days in 30 yrs
- 2 days/yr
Risk factors via First Street. Map © Google.
Why this score? — see what drove the D- grade
The composite is a weighted blend of 9 inputs, each scored 0–100. Each bar is that input's sub-score; the figure is the points it added to the 100-point composite (weight × sub-score).
- Cash flow +12.5/30.0
- Rent growth +5.0/5.0
- ARV discount +4.2/15.0
- 1% rule +3.9/10.0
- DSCR +3.7/10.0
- Livability +3.3/5.0
- Schools +2.5/10.0
- Condition / age +2.5/5.0
- Appreciation +0.0/10.0
$205,000
🖨 Deal sheet 📄 Offer letter ✓ Due diligence
Listing remarks
Welcome to this Beautiful renovated one-story home in much sought after Sterling Green. Curb appeal begins at the inviting front porch, as you enter you are greeted with a vaulted ceiling with exposed beam, and a stunning brick fireplace. The kitchen/dinning room opens to a bright living room with French doors that leads you directly to the backyard, perfect for indoor-outdoor living. A Super-size extended covered patio is perfect for family fun and entertaining. This well maintained home offers neutral paint inside and out, elegant tile flooring through-out home. Home is equipped with individual breaker for a back-up generator system. Updates include: extended covered back patio, ceramic t
Key facts
- Guest bath
- Brick fireplace
- Vaulted ceiling
Tags
Property features AI
Finance
- Other: Seller disclosure available
- HOA & community: Sterling Green association; Association fee $270 annually
Exterior
- Parking: Attached garage (2 spaces); Driveway parking
- Security: Prewired for security; Leased security system; Smoke detectors
- Utilities: Public water; Public sewer
- Home design: Residential property; Built in 1978; Slab foundation; Composition roof; Single‑story (entry level: first); Subdivision lot with side yard; Concrete road access
- Construction: Brick construction
- Exterior features: Covered patio; Deck; Patio; Private yard; Back yard fencing; Shed(s); Storage
Interior
- Kitchen: Electric oven; Free‑standing range; Disposal
- Bedrooms: Primary bedroom (First level, approximately 14x11); Bedroom (First level, approximately 13x12.5); Bedroom (First level, approximately 11x10)
- Flooring: Tile floors
- Bathrooms: 2 full bathrooms
- Heating & cooling: Central heating (electric); Central air conditioning (electric); Attic fan
- Interior features: Kitchen/Family room combo; Kitchen/Dining combo; Pantry; Tub/shower; Vanity; Window treatments; Programmable thermostat; Gas log fireplace (one)
- Laundry & utility: Washer hookup; Electric dryer hookup; Utility room (First level, approximately 8x5.7)
Neighborhood map
What this means for you Summary
Snapshot
- This is a 3-bed/2.0-bath single-family listed at $205k.
Deal economics
- At list price, monthly cash flow is $-28 ($-342/yr) — negative.
- To cash-flow at today's rent, offer at most $200k (2.5% below list).
- To meet the 1% rule (rent ≥ 1% of price), the offer needs to be $183k (10.8% below list).
- Recommended offer: $183k (10.8% below list) — sets the bar for 1% rule.
- Cap rate 6.1% vs local median 4.8% in Channelview — meaningfully above typical; check what's discounted (condition, days-on-market, listing class) to confirm the premium yield is real.
Location & tenants
- Location reads 66/100 on livability (#598 in TX) — a middle-class / working-renter tenant base. Strengths: cost of living A+, housing A+; Watch: crime F, amenities F, commute F.
- Channelview ISD (suburban): math 27% / reading 30% proficiency, ranked #640 of 826 in TX (top 78%) — low school quality limits family demand, transient renter base, plan for 1-2y turnover; 70% free/reduced lunch — lower-income household profile, screen leases tightly.
- Zoned schools: Aguirre J H (math 24% / reading 28%, grade F, #1,222 of 1,662 statewide, top 74%, 975 students, 76% FRL); Channelview H S (math 24% / reading 35%, grade F, #1,112 of 1,632 statewide, top 70%, 2,893 students, 87% FRL).
- Market conditions: Rents rising fast (+16.9%/yr); 100 active listings in the ZIP; 3 comparable units currently listed for rent nearby; rentals leasing fast (median 3d on market — plan ~1-2 weeks tenant-placement turnaround); 29,883 units permitted in Harris County in 2024 (8,621 in 5+ unit buildings).
- This rent runs 35% of the median local income ($62k/yr) — at the standard rent-burdened threshold; future hikes will face affordability resistance.
Forward outlook
- Local home prices are declining (-3.0%/yr); year-one equity from $1k of loan paydown is wiped out by about $6k of value loss. Plan a longer hold.
- Harris County population projected at +47% by 2050 — long-run rental-demand tailwind backs the buy-and-hold thesis.
Negotiation context
- It's been on market 22 days — a 2% lower offer ($202k) is reasonable based on typical stale-listing flexibility.
- Current owner paid $46k; list at $205k implies a 346% gain — meaningful room to come down on a strong offer.
Risks & watch-outs
- Climate carrying-cost: major flood risk; severe wind risk, 99% chance of damaging wind over 30y; extreme-heat days projected 7→24/yr by 2055 (HVAC capex compounding) — expect insurance premiums to compound above CPI over the hold.
Questions for the listing agent
- What do current leases actually rent for vs. the listed asking? Can we see a recent rent roll and the last 12 months of T-12 income?
- Built in 1978 — when were the roof, HVAC, electrical panel, plumbing, and water heater last replaced?
- What does the HOA fee cover, when was the last increase, and are there any pending special assessments or reserve-fund shortfalls?
- Is there a deadline driving the sale (1031 exchange, divorce, estate, relocation)? That informs how much negotiation room exists.
- Schools are D-rated, which usually means shorter tenancies and higher turnover. Who's the typical renter profile here, and what's been the actual vacancy rate?
- Crime grade is F in this area — have there been break-ins, vandalism, or insurance claims at this property in the last 3 years? What carrier currently insures it and at what premium?
- The area grade is low — what's the realistic commute time and amenity access for the typical tenant pool here? Any planned neighborhood developments (good or bad) we should know about?
- What's the average days-on-market for RENTAL listings here right now (not sales)? A rising rental-DOM trend means longer vacancies and softer asking-rent achievability than the comps imply.
- What's the recent tenant-quality profile in this submarket — average credit score on applications, eviction rate, late-payment / NSF rate, and stable-employment percentage? A property-management company in the area should have these aggregated.
- How much new for-sale + rental construction is in the pipeline within 1–3 miles? Heavy new supply typically softens prices + rents 12–24 months out; constrained supply supports both.
Investment metrics
- 1% rule
- 0.89% ✗
- Cap rate
- 6.13%
- Cash-on-cash
- -0.60%
- DSCR
- 0.97
- GRM
- 9.3
CMA / ARV
- ARV (on-the-fly)
- $190,944
- Comps found
- 12
Show comp detail 12 sales within ~0.75 mi
| Address | Dist | Beds/Ba | Sqft | Sold | Price | $/sf | Match |
|---|---|---|---|---|---|---|---|
| 919 Earlsferry Dr | 0.05mi | 3/2.0 | 1,205 (-2%) | 7mo | $210,000 | $174 | 89 |
| 14735 Lerner Dr | 0.36mi | 3/2.0 | 1,282 (+5%) | 8mo | $219,000 | $171 | 69 |
| 917 Holbech Ln | 0.25mi | 3/2.0 | 1,077 (-12%) | 2mo | $125,000 | $116 | 66 |
| 1034 Little Prt | 0.39mi | 3/2.0 | 1,319 (+8%) | 4mo | $204,990 | $155 | 66 |
| 814 Overbluff St | 0.25mi | 3/1.5 | 1,124 (-8%) | 8mo | $189,000 | $168 | 66 |
| 15014 Groveshire St | 0.41mi | 3/2.0 | 1,150 (-6%) | 6mo | $190,000 | $165 | 65 |
| 714 Donfield St | 0.51mi | 3/2.0 | 1,154 (-6%) | 2mo | $139,990 | $121 | 65 |
| 1123 Maclesby Ln | 0.47mi | 4/2.0 (+1) | 1,176 (-4%) | 5mo | $189,900 | $161 | 62 |
| 14923 Lofton St | 0.73mi | 3/2.0 | 1,251 (+2%) | 2mo | $194,990 | $156 | 60 |
| 726 Brookview St | 0.35mi | 3/1.5 | 1,369 (+12%) | 3mo | $190,000 | $139 | 60 |
| 15116 Sheffield Ter | 0.28mi | 2/1.0 (-1) | 1,087 (-11%) | 2mo | $145,000 | $133 | 57 |
| 751 Terryhollow St | 0.56mi | 3/2.0 | 1,099 (-10%) | 8mo | $171,000 | $156 | 50 |
Match score weights: distance 35% · size 25% · config 20% · recency 20%. Top-matched comps best support the ARV.
Projected returns pro-forma
-3.0% appreciation · 8.0% rent growth · sell at horizon
- IRR
- -11.6%
- Equity multiple
- 0.56×
- Total profit
- $-25,305
- Equity at exit
- $30,566
- IRR
- 3.9%
- Equity multiple
- 1.35×
- Total profit
- $19,876
- Equity at exit
- $17,725
Cash invested: $57,400 (down + closing). Projections, not guarantees.
Landlord ↔ Tenant lean methodology
- Overall (STATE)
- 87 Strongly Landlord-Friendly
- State Texas
- 87 Strongly Landlord-Friendly · R+5
- County
- — inherits STATE
- City
- — inherits STATE
ZIP-level market 77530
- Rents YoY
- 16.9%
- Active inventory
- 100
- Price-to-rent
- 9.3×
Monthly cashflow live
- Estimated rent
- $1,829 medium interval (Pro) →
- Mortgage (P&I)
- −$1,075
- Tax from tax record
- −$290 /mo · $3,480/yr
- Insurance
- −$85
- HOA
- −$23
- Vacancy / Maint / Mgmt
- −$384
- Net cashflow
- $-28
Break-even live
UW: 25.0% down · 7.5% · 30yr · 1.5% tax · 5.0% vac · 8.0% maint · 8.0% mgmt
Financing live
Cash to close
- Down payment
- $51,250
- Closing costs
- $6,150
- Reserves months
- —
- Total cash needed
- —
Loan-product check · same deal, 3 products live
Conventional
25% down · 7.5% · 30yr
- Down + closing
- —
- Monthly P&I
- —
- Monthly cashflow
- —
- DSCR
- —
- Eligible?
- —
Personal DTI + credit; lowest rate.
DSCR
20% down · 8.5% · 30yr
- Down + closing
- —
- Monthly P&I
- —
- Monthly cashflow
- —
- DSCR
- —
- Eligible?
- —
No personal income docs; deal must DSCR.
Hard money
10% down · 12.0% · 12mo
- Down + closing
- —
- Monthly P&I
- —
- Monthly cashflow
- —
- DSCR
- —
- Eligible?
- —
Short-term bridge; refi at stabilization.
Rent comps 3 comps
| Address | Beds | Baths | Sqft | Rent | $/sqft | DOM | Units | Dist |
|---|---|---|---|---|---|---|---|---|
| 15255 Ferness Ln Channelview, TX | 4.0 | 2.0 | 1326 | $1,668 | $1.26 | 2d | 10 | 0.58mi |
| 1379 Dell Dale St Channelview, TX | 4.0 | 2.0 | 1444 | $1,893 | $1.31 | 5d | 1 | 1.02mi |
| 13925 Alderson St Houston, TX | 2.0 | 1.0 | 700 | $1,273 | $1.82 | 3d | 1 | 1.38mi |
HOA detail
- Monthly dues
- $23 · $276/yr
Listing history 10 events
-
2026-06-07days on market $205,000 Pending 22 DOM
-
2026-06-04days on market $205,000 Pending 21 DOM
-
2026-06-03days on market $205,000 Pending 20 DOM
-
2026-06-02days on market $205,000 Pending 19 DOM
-
2026-06-01days on market $205,000 Pending 18 DOM
-
2026-05-31days on market $205,000 Pending 17 DOM
-
2026-05-14$205,000 Active
-
1999-07-16soldstatus
-
1999-04-22soldstatus
-
1992-05-01soldstatus $46,000
ⓘ Source: listings_history table (triggers on properties + properties_extension) + one-shot
backfill from property_details.listing_events for pre-trigger history.
Tax reassessment forecast TX · Resets to sale price
- Current annual tax
- $3,480 · $290/mo
- Projected year-2 tax
- $3,752 · $313/mo
- Expected delta
- +$271/yr (+$23/mo · 7.8%)
ⓘ Screening estimate from a state-policy table — verify with the county assessor before closing.
Climate risk First Street
- Flood 6/10 Major FEMA zone X (unshaded) · 70% chance over 30 yrs
- Wildfire 3/10 Moderate
- Heat 9/10 Extreme 7 d/yr ≥109°F today · 24 d/yr by 30 yrs out
- Wind 9/10 Extreme 99% chance of damaging wind over 30 yrs
- Air quality 2/10 Low 2 unhealthy d/yr today · 2 by 30 yrs out
Nearby sold comps map
Loading sold comps map…
Walkable amenities ~0.75 mi
Loading nearby amenities…
Taxation est. · year 1
- Rental income
- $21,949
- − Mortgage interest
- −$11,483
- − Property taxes
- −$3,480
- − Insurance
- −$1,025
- − Repairs & maintenance
- −$1,756
- − Management
- −$1,756
- − HOA
- −$276
- − Depreciation
- −$5,964
- Taxable loss
- −$3,791
- Est. tax savings @ 24.0%
- +$910
- After-tax cash flow
- $568/yr
For passive investors: Depreciation is non-cash, so a rental often shows a tax loss while cash-flowing — sheltering income. Rental losses are passive: they offset passive income freely, and up to $25,000/yr can offset ordinary (W-2) income if you actively participate and your MAGI is under $100k (phasing out to $0 by $150k); unused losses carry forward. On sale, claimed depreciation is recaptured at up to 25%, and gains may owe capital-gains tax (a 1031 exchange can defer both). Figures are a year-1 estimate at your 24.0% rate — not tax advice; consult a CPA.
Schools (NCES district)
- District
- Channelview ISD
- NCES district ID
- 4813590
- Math proficiency
- 27% ▼ -22.00%
- Reading proficiency
- 30% ▼ -8.00%
- Median HH income
- $52,320
- Composite
- 25.18/100
- National rank
- #7513
- State rank
- #640 of 826 in TX
Livability — Channelview
- Score
- 66/100
- State rank
- #598
- US rank
- #11392
Category grades
Schools grade is shown separately in the Schools card above.
Census & demographics
- Census place
- Channelview, TX
- County
- Harris County · 4,702,590 people
- City population
- 31,527
- Metro
- Houston-The Woodlands-Sugar Land, TX
- Population (ZIP)
- 31,527
- Household income
- $62,195
- Rent vs Own
- Severe rent burden
- 966.0
Population outlook (Harris County) Hauer SSP2
- Today (2025)
- 5,571,493 people
- By 2030
- 6,089,821 · +9.3%
- By 2040
- 7,142,806 · +28.2%
- By 2050
- 8,185,864 · +46.9%
- By 2075
- 10,574,329 · +89.8%
- By 2100
- 12,109,958 · +117.4%
Race, ethnicity, and origin ACS 2023
- Neighborhood character
- Predominantly Hispanic (71%)
- Race & ethnicity
- Hispanic / Latino 71% Two or more races 31% White 16% Black 9% Asian 4% Native American 1%
- Hispanic origin (detail)
- Mexican 61%
- Common ancestry
- Slovak 1% Lithuanian 1%
- Foreign-born
- 33% · Canada, Vietnam, Jamaica
- Languages at home
- 37% English-only · Spanish 60% Other Asian/Pacific 1% Vietnamese 1%
Political lean MEDSL · Harris
- 2024 margin
- Lean D (+5.5) · D 52.0% · R 46.4% · Other 1.6%
- 2008→2024 swing
- +3.9pp toward D · 2008: 1.6pp · 2024: 5.5pp
- All cycles
- 2024: D+5.5 2020: D+13.3 2016: D+12.4 2012: D+0.1 2008: D+1.6
Not yet ingested
- Civics
- —
Market trends
- HPI YoY
- ▼ -172.05%
- Current HPI
- 292.1862
- Rent YoY
- ▲ 16.85%
- Metro
- Houston-The Woodlands-Sugar Land, TX
- State GDP YoY
- ▲ 3.95%
- F500 in state
- 110
Industry mix (Fortune 500 HQ in TX)
| Industry | F500 HQs | Revenue |
|---|---|---|
| Energy | 16 | $1,198B |
|
||
| Technology | 5 | $198B |
|
||
| Engineering / Construction | 4 | $72B |
|
||
| Energy Services | 3 | $60B |
|
||
| Utilities | 3 | $41B |
|
||
| Healthcare | 2 | $330B |
|
||
Price history
+345.7% since first listed4 events — show timeline
- 2026-05-14 Listed $205,000 HARMLS
- 1999-07-16 Sold (Public Records) — Public Records
- 1999-04-22 Sold (Public Records) — Public Records
- 1992-05-01 Sold (Public Records) $46,000 Public Records
Property tax history
+5.5%/yrLatest (2025): $3,480 · +2.3% YoY. Source: county tax records.
Cash-flow waterfall
monthlySold comps — $/sqft
last 12 mo · ≤1 miLoading sold comps…