3710 Chatham Ct · Joliet, IL
Flood risk 1/10 · Minimal
- FEMA flood zone
- X (unshaded)
- Chance of flooding over 30 yrs
- 0.0%
- Est. flood insurance / yr
- $507 – $1,088
Fire risk 1/10 · Minimal
- Est. fire insurance / yr
- $804 – $1,492
Heat risk 3/10 · Minor
- Hot days now (above 102°F)
- 7 days/yr
- Hot days in 30 yrs
- 15 days/yr
Wind risk 2/10 · Minimal
- Chance of severe wind over 30 yrs
- 1.0%
Air-quality risk 3/10 · Minor
- Unhealthy air days now
- 3 days/yr
- Unhealthy air days in 30 yrs
- 4 days/yr
Risk factors via First Street. Map © Google.
Why this score? — see what drove the D+ grade
The composite is a weighted blend of 9 inputs, each scored 0–100. Each bar is that input's sub-score; the figure is the points it added to the 100-point composite (weight × sub-score).
- ARV discount +14.5/15.0
- Cash flow +12.8/30.0
- Rent growth +4.4/5.0
- 1% rule +3.9/10.0
- Livability +3.9/5.0
- DSCR +3.8/10.0
- Schools +2.9/10.0
- Condition / age +2.5/5.0
- Appreciation +0.0/10.0
$304,910
🖨 Deal sheet 📄 Offer letter ✓ Due diligence
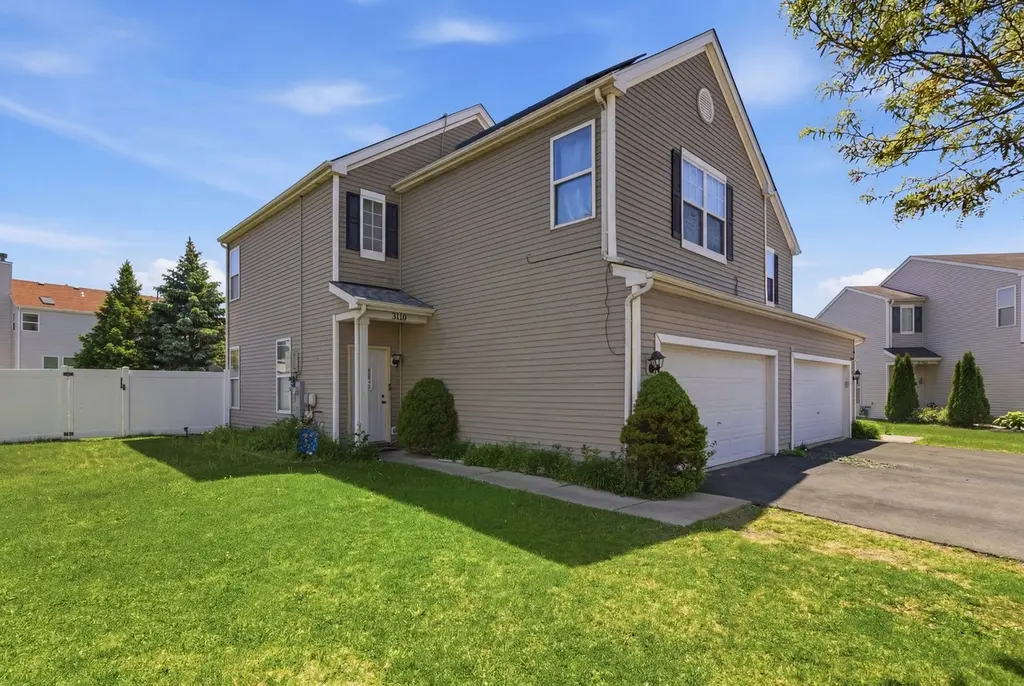
Listing remarks
Welcome to this charming family home located in a wonderful neighborhood of Joliet! This spacious 2-story home offers 3 bedrooms and 2.5 bathrooms with a layout designed for comfortable everyday living. Two of the bedrooms are especially spacious, perfect for growing families, guest rooms, or additional space to work or play from home. The main floor features a convenient half bath, while the second floor includes two full bathrooms for added comfort and convenience. Enjoy peace of mind with a brand-new roof installed in 2026 and a beautiful new white privacy fence, creating the perfect backyard space for kids, pets, family gatherings, or summer BBQs. The attached 2-car garage provides plen
Key facts
- Attached garage
- Great community
- Backyard space
Tags
Property features AI
Finance
- Other: Fee simple ownership with homeowners association
- HOA & community: Annual association fee of $135 (includes insurance); Association amenities include a park; Pets allowed (cats and dogs OK; max pet weight listed)
Exterior
- Parking: Attached garage (garage owned); Two garage spaces; two total parking spaces
- Utilities: Public water; Public sewer
- Home design: Attached single property; Townhouse — 2 stories; Entry level: 1
- Construction: Built approx. 21–25 years ago; Frame construction; Asphalt roof; Approximately 1,600 total finished square feet
- Exterior features: Asphalt driveway; Park access via association
Interior
- Kitchen: Range; Microwave; Dishwasher; Refrigerator; Eating area / breakfast bar
- Bedrooms: Three bedrooms (master bedroom on second level; two additional bedrooms on second level)
- Flooring: Laminate flooring throughout main living areas and bedrooms
- Bathrooms: Two full bathrooms and one half bathroom
- Heating & cooling: Natural gas heating; Central air conditioning
- Interior features: Six total rooms; Kitchen/Dining combo
- Laundry & utility: In-unit laundry (washer and dryer) located on second level
Neighborhood map
What this means for you Summary
Snapshot
- This is a 3-bed/2.5-bath townhouse listed at $305k.
Deal economics
- At list price, monthly cash flow is $-28 ($-338/yr) — negative.
- To cash-flow at today's rent, offer at most $300k (1.6% below list).
- To meet the 1% rule (rent ≥ 1% of price), the offer needs to be $272k (10.7% below list).
- Recommended offer: $272k (10.7% below list) — sets the bar for 1% rule.
- Cap rate 6.2% vs local median 4.8% in Joliet — meaningfully above typical; check what's discounted (condition, days-on-market, listing class) to confirm the premium yield is real.
Location & tenants
- Location reads 78/100 on livability (#153 in IL, #2,772 nationally) — a middle-class / working-renter tenant base. Strengths: commute A+, housing A+, cost of living A; Watch: amenities C-, health & safety C-, schools F.
- Plainfield SD 202 (suburban): math 25% / reading 32% proficiency, ranked #213 of 620 in IL (top 34%) — low school quality limits family demand, transient renter base, plan for 1-2y turnover; only 17% free/reduced lunch — higher-income household profile.
- Market conditions: Rents rising fast (+7.7%/yr); 35 active listings in the ZIP; 3 comparable units currently listed for rent nearby; rentals leasing fast (median 1d on market — plan ~1-2 weeks tenant-placement turnaround); solid renter incomes; 2,028 units permitted in Will County in 2024 (530 in 5+ unit buildings).
- This rent runs 43% of the median local income ($76k/yr) — at the standard rent-burdened threshold; future hikes will face affordability resistance.
Forward outlook
- Local home prices are declining (-3.0%/yr); year-one equity from $2k of loan paydown is wiped out by about $9k of value loss. Plan a longer hold.
- Will County population projected to shrink 4% by 2050 — rents likely to lag national; underwrite the cash flow, not the appreciation.
Negotiation context
- Only 7 days on market — expect competitive offers; lowballing is unlikely to land.
- Current owner paid $173k; list at $305k implies a 76% gain — meaningful room to come down on a strong offer.
Questions for the listing agent
- What do current leases actually rent for vs. the listed asking? Can we see a recent rent roll and the last 12 months of T-12 income?
- What does the HOA fee cover, when was the last increase, and are there any pending special assessments or reserve-fund shortfalls?
- Is there a deadline driving the sale (1031 exchange, divorce, estate, relocation)? That informs how much negotiation room exists.
- Schools are F-rated, which usually means shorter tenancies and higher turnover. Who's the typical renter profile here, and what's been the actual vacancy rate?
- The area grade is low — what's the realistic commute time and amenity access for the typical tenant pool here? Any planned neighborhood developments (good or bad) we should know about?
- What's the average days-on-market for RENTAL listings here right now (not sales)? A rising rental-DOM trend means longer vacancies and softer asking-rent achievability than the comps imply.
- What's the recent tenant-quality profile in this submarket — average credit score on applications, eviction rate, late-payment / NSF rate, and stable-employment percentage? A property-management company in the area should have these aggregated.
- How much new for-sale + rental construction is in the pipeline within 1–3 miles? Heavy new supply typically softens prices + rents 12–24 months out; constrained supply supports both.
Investment metrics
- 1% rule
- 0.89% ✗
- Cap rate
- 6.18%
- Cash-on-cash
- -0.40%
- DSCR
- 0.98
- GRM
- 9.3
CMA / ARV
- ARV (median comp)
- $361,226
- List price
- $304,910
- Delta
- -11.47%
- Verdict
- UNDERPRICED
- Comps
- 20 within 1.0 mi
Show comp detail 12 sales within ~0.75 mi
| Address | Dist | Beds/Ba | Sqft | Sold | Price | $/sf | Match |
|---|---|---|---|---|---|---|---|
| 3731 Indian Head Ln | 0.07mi | 3/2.5 | 1,584 (0%) | 4mo | $289,000 | $182 | 94 |
| 3864 Pathfinder Ln | 0.23mi | 2/1.5 (-1) | 1,590 (+0%) | 3mo | $254,500 | $160 | 77 |
| 3912 Pathfinder Ln | 0.28mi | 2/2.5 (-1) | 1,660 (+5%) | 2mo | $305,000 | $184 | 72 |
| 21552 Eich Dr #0 | 0.68mi | 3/2.5 | 1,550 (-2%) | 5mo | $287,000 | $185 | 61 |
| 3713 Mustang Rd | 0.38mi | 2/1.5 (-1) | 1,700 (+7%) | 2mo | $305,000 | $179 | 59 |
| 21520 Victory Lake Way #21520 | 0.71mi | 3/2.0 | 1,522 (-4%) | 1mo | $240,000 | $158 | 58 |
| 3800 Harms Rd | 0.58mi | 3/1.5 | 1,700 (+7%) | 1mo | $305,000 | $179 | 56 |
| 21531 Wolf Lake Way | 0.69mi | 2/2.0 (-1) | 1,640 (+4%) | 2mo | $290,000 | $177 | 53 |
| 12 Dan Ireland Dr | 0.39mi | 2/1.5 (-1) | 1,428 (-10%) | 7mo | $250,000 | $175 | 51 |
| 21543 Eich Dr | 0.71mi | 2/2.5 (-1) | 1,801 (+14%) | 1mo | $287,000 | $159 | 39 |
| 21533 Papoose Lake Ct | 0.68mi | 2/1.0 (-1) | 1,380 (-13%) | 0mo | $270,000 | $196 | 36 |
| 21522 Lake St Clair Dr | 0.69mi | 2/2.0 (-1) | 1,373 (-13%) | 4mo | $265,000 | $193 | 35 |
Match score weights: distance 35% · size 25% · config 20% · recency 20%. Top-matched comps best support the ARV.
Projected returns pro-forma
-3.0% appreciation · 7.65% rent growth · sell at horizon
- IRR
- -11.7%
- Equity multiple
- 0.56×
- Total profit
- $-37,778
- Equity at exit
- $45,463
- IRR
- 3.4%
- Equity multiple
- 1.30×
- Total profit
- $25,404
- Equity at exit
- $26,363
Cash invested: $85,375 (down + closing). Projections, not guarantees.
Landlord ↔ Tenant lean methodology
- Overall (STATE)
- 43 Moderately Tenant-Leaning
- State Illinois
- 43 Moderately Tenant-Leaning · D+7
- County
- — inherits STATE
- City
- — inherits STATE
ZIP-level market 60435
- Rents YoY
- 7.7%
- Active inventory
- 35
- Price-to-rent
- 9.3×
Monthly cashflow live
- Estimated rent
- $2,723 medium interval (Pro) →
- Mortgage (P&I)
- −$1,599
- Tax from tax record
- −$443 /mo · $5,311/yr
- Insurance
- −$127
- HOA
- −$11
- Vacancy / Maint / Mgmt
- −$572
- Net cashflow
- $-28
Break-even live
UW: 25.0% down · 7.5% · 30yr · 1.5% tax · 5.0% vac · 8.0% maint · 8.0% mgmt
Financing live
Cash to close
- Down payment
- $76,228
- Closing costs
- $9,147
- Reserves months
- —
- Total cash needed
- —
Loan-product check · same deal, 3 products live
Conventional
25% down · 7.5% · 30yr
- Down + closing
- —
- Monthly P&I
- —
- Monthly cashflow
- —
- DSCR
- —
- Eligible?
- —
Personal DTI + credit; lowest rate.
DSCR
20% down · 8.5% · 30yr
- Down + closing
- —
- Monthly P&I
- —
- Monthly cashflow
- —
- DSCR
- —
- Eligible?
- —
No personal income docs; deal must DSCR.
Hard money
10% down · 12.0% · 12mo
- Down + closing
- —
- Monthly P&I
- —
- Monthly cashflow
- —
- DSCR
- —
- Eligible?
- —
Short-term bridge; refi at stabilization.
Rent comps 3 comps
| Address | Beds | Baths | Sqft | Rent | $/sqft | DOM | Units | Dist |
|---|---|---|---|---|---|---|---|---|
| 16340 Crescent Lake Dr Crest Hill, IL | 2.0 | 2.0 | 1332 | $2,700 | $2.03 | 3d | 1 | 0.79mi |
| 579 S Scott Ln Romeoville, IL | 3.0 | 2.5 | 1564 | $2,950 | $1.89 | 1d | 1 | 1.06mi |
| 1716 William Dr Romeoville, IL | 3.0 | 3.5 | 1700 | $3,800 | $2.24 | 1d | 1 | 1.09mi |
HOA detail
- Monthly dues
- $11 · $132/yr
Listing history 9 events
-
2026-06-08days on market $304,910 Active 7 DOM
-
2026-06-07days on market $304,910 Active 6 DOM
-
2026-06-04days on market $304,910 Active 3 DOM
-
2026-06-03days on market $304,910 Active 2 DOM
-
2026-06-02days on market $304,910 Active 1 DOM
-
2026-06-01pricedays on market $304,910 Active 17 DOM
-
2026-05-31days on market $319,800 Active 16 DOM
-
2026-05-15$329,800 Active 934-char remark
-
2003-09-11soldstatus $173,000
ⓘ Source: listings_history table (triggers on properties + properties_extension) + one-shot
backfill from property_details.listing_events for pre-trigger history.
Tax reassessment forecast IL · Partial reset (capped growth)
- Current annual tax
- $5,311 · $443/mo
- Projected year-2 tax
- $6,116 · $510/mo
- Expected delta
- +$805/yr (+$67/mo · 15.2%)
ⓘ Screening estimate from a state-policy table — verify with the county assessor before closing.
Climate risk First Street
- Flood 1/10 Low FEMA zone X (unshaded) · 0% chance over 30 yrs
- Wildfire 1/10 Low
- Heat 3/10 Moderate 7 d/yr ≥102°F today · 15 d/yr by 30 yrs out
- Wind 2/10 Low 100% chance of damaging wind over 30 yrs
- Air quality 3/10 Moderate 3 unhealthy d/yr today · 4 by 30 yrs out
Nearby sold comps map
Loading sold comps map…
Walkable amenities ~0.75 mi
Loading nearby amenities…
Taxation est. · year 1
- Rental income
- $32,681
- − Mortgage interest
- −$17,080
- − Property taxes
- −$5,311
- − Insurance
- −$1,525
- − Repairs & maintenance
- −$2,614
- − Management
- −$2,614
- − HOA
- −$132
- − Depreciation
- −$8,870
- Taxable loss
- −$5,466
- Est. tax savings @ 24.0%
- +$1,312
- After-tax cash flow
- $974/yr
For passive investors: Depreciation is non-cash, so a rental often shows a tax loss while cash-flowing — sheltering income. Rental losses are passive: they offset passive income freely, and up to $25,000/yr can offset ordinary (W-2) income if you actively participate and your MAGI is under $100k (phasing out to $0 by $150k); unused losses carry forward. On sale, claimed depreciation is recaptured at up to 25%, and gains may owe capital-gains tax (a 1031 exchange can defer both). Figures are a year-1 estimate at your 24.0% rate — not tax advice; consult a CPA.
Schools (NCES district)
- District
- Plainfield SD 202
- NCES district ID
- 1731740
- Math proficiency
- 25% ▼ -16.00%
- Reading proficiency
- 32% ▼ -14.00%
- Median HH income
- $90,706
- Composite
- 28.83/100
- National rank
- #6653
- State rank
- #213 of 620 in IL
Livability — Joliet
- Score
- 78/100
- State rank
- #153
- US rank
- #2772
Category grades
Schools grade is shown separately in the Schools card above.
Census & demographics
- Census place
- Joliet, IL
- County
- Will County · 412,448 people
- City population
- 68,632
- Metro
- Chicago-Naperville-Elgin, IL-IN-WI
- Population (ZIP)
- 48,167
- Household income
- $76,369
- Rent vs Own
- Severe rent burden
- 1720.0
Population outlook (Will County) Hauer SSP2
- Today (2025)
- 705,368 people
- By 2030
- 708,154 · +0.4%
- By 2040
- 702,692 · -0.4%
- By 2050
- 680,249 · -3.6%
- By 2075
- 611,990 · -13.2%
- By 2100
- 516,215 · -26.8%
Race, ethnicity, and origin ACS 2023
- Neighborhood character
- Diverse neighborhood (Simpson 0.65)
- Race & ethnicity
- White 44% Hispanic / Latino 37% Black 15% Two or more races 14% Asian 1%
- Hispanic origin (detail)
- Mexican 33% Puerto Rican 2%
- Common ancestry
- Romanian 6% Lithuanian 1% Slovak 1%
- Foreign-born
- 16% · Canada
- Languages at home
- 71% English-only · Spanish 26% Russian/Polish/Slavic 1%
Political lean MEDSL · Will
- 2024 margin
- Toss-up / Even · D 50.1% · R 48.5% · Other 1.4%
- 2008→2024 swing
- -11.6pp toward R · 2008: 13.2pp · 2024: 1.6pp
- All cycles
- 2024: D+1.6 2020: D+8.3 2016: D+5.7 2012: D+3.7 2008: D+13.2
Not yet ingested
- Civics
- —
Market trends
- HPI YoY
- ▼ -171.52%
- Current HPI
- 210.278
- Rent YoY
- ▲ 7.65%
- Metro
- Chicago-Naperville-Elgin, IL-IN-WI
- State GDP YoY
- ▲ 1.59%
- F500 in state
- 60
Industry mix (Fortune 500 HQ in IL)
| Industry | F500 HQs | Revenue |
|---|---|---|
| Insurance | 4 | $201B |
|
||
| Consumer Goods | 4 | $87B |
|
||
| Industrial Machinery | 3 | $64B |
|
||
| Healthcare | 2 | $55B |
|
||
| Retail / Pharmacy | 1 | $148B |
|
||
| Agriculture / Food | 1 | $86B |
|
||
Price history
7 events — show timeline
- 2026-06-08 Listing Removed — MRED as Distributed by MLS Grid
- 2026-06-01 Listing Removed — MRED as Distributed by MLS Grid
- 2026-06-01 Price Changed — MRED as Distributed by MLS Grid
- 2026-05-26 Price Changed — MRED as Distributed by MLS Grid
- 2026-05-15 Listed — MRED as Distributed by MLS Grid
- 2026-05-15 Listed — MRED as Distributed by MLS Grid
- 2003-09-11 Sold (Public Records) $173,000 Public Records
Property tax history
+2.1%/yrLatest (2024): $5,311 · +4.9% YoY. Source: county tax records.
Cash-flow waterfall
monthlySold comps — $/sqft
last 12 mo · ≤1 miLoading sold comps…