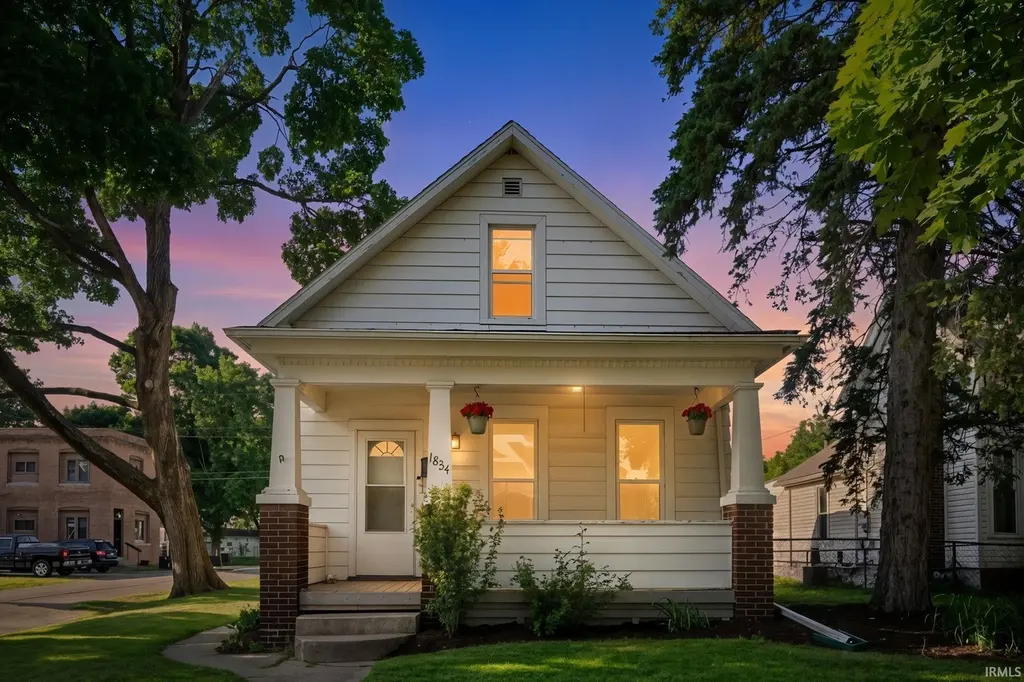
1834 Howell St · Fort Wayne, IN
Flood risk 1/10 · Minimal
- FEMA flood zone
- X (unshaded)
- Chance of flooding over 30 yrs
- 0.0%
- Est. flood insurance / yr
- $507 – $1,088
Fire risk 1/10 · Minimal
- Est. fire insurance / yr
- $717 – $1,331
Heat risk 3/10 · Minor
- Hot days now (above 100°F)
- 7 days/yr
- Hot days in 30 yrs
- 17 days/yr
Wind risk 2/10 · Minimal
- Chance of severe wind over 30 yrs
- —
Air-quality risk 3/10 · Minor
- Unhealthy air days now
- 2 days/yr
- Unhealthy air days in 30 yrs
- 3 days/yr
Risk factors via First Street. Map © Google.
Why this score? — see what drove the C- grade
The composite is a weighted blend of 9 inputs, each scored 0–100. Each bar is that input's sub-score; the figure is the points it added to the 100-point composite (weight × sub-score).
- Cash flow +20.2/30.0
- ARV discount +7.0/15.0
- DSCR +6.4/10.0
- 1% rule +4.4/10.0
- Rent growth +4.2/5.0
- Livability +4.2/5.0
- Condition / age +2.5/5.0
- Schools +2.2/10.0
- Appreciation +0.0/10.0
$149,999
🖨 Deal sheet 📄 Offer letter ✓ Due diligence
Listing remarks MLS
Check this out!!! Has all new flooring up and down, freshly painted, mostly new vinyl windows, new exterior doors and storm doors, new heating and central air, new garage door and opener. This house was very well maintained and is ready for new occupant.
Key facts
- Covered front porch
- Detached garage
- 6,300 sq ft lot
Tags
Property features AI
Exterior
- Parking: Detached 1-car garage
- Utilities: Public water; Public sewer
- Home design: Single-family residence (site-built); 2-story
- Construction: Aluminum siding
- Exterior features: Covered porch; Partial chain link fencing; Corner lot
Interior
- Kitchen: Laminate counters
- Bedrooms: 6 total rooms (bedroom count not specified)
- Bathrooms: 1 full bathroom; 1 half bathroom; One main-level bathroom
- Heating & cooling: Natural gas heating; Central air conditioning
- Interior features: Laminate counters; Partial unfinished basement; One fireplace
- Laundry & utility: Laundry located in basement
Neighborhood map
What this means for you Summary
Snapshot
- This is a 3-bed/1.5-bath single-family listed at $150k.
Deal economics
- At list price, monthly cash flow is $190 ($2k/yr) — positive.
- The deal already cash-flows at list — no discount required.
- To meet the 1% rule (rent ≥ 1% of price), the offer needs to be $141k (6.1% below list).
- Recommended offer: $141k (6.1% below list) — sets the bar for 1% rule.
- Cap rate 7.8% vs local median 4.8% in Fort Wayne — top-decile yield for the area; either an underpriced asset or a hidden risk that comps aren't pricing in. Stress-test before assuming the spread holds.
Location & tenants
- Location reads 84/100 on livability (#6 in IN, #676 nationally) — a professional / high-income tenant draw. Strengths: amenities A+, commute A+, cost of living A+; Watch: crime C-, employment D+.
- Fort Wayne Community Schools (urban): math 22% / reading 29% proficiency, ranked #263 of 301 in IN (top 87%) — low school quality limits family demand, transient renter base, plan for 1-2y turnover; 60% free/reduced lunch — lower-income household profile, screen leases tightly.
- Zoned schools: Washington Elementary School (math 27% / reading 17%, grade F, #790 of 994 statewide, top 81%, 238 students, 74% FRL); Portage Middle School (math 8% / reading 18%, grade F, #304 of 330 statewide, top 94%, 436 students, 79% FRL); Wayne High School (math 17% / reading 52%, grade F, #270 of 369 statewide, top 77%, 1,419 students, 68% FRL).
- Market conditions: Rents rising fast (+7.0%/yr); 87 active listings in the ZIP; 18 comparable units currently listed for rent nearby; rentals lingering (median 44d on market — plan ~5-8 weeks vacancy on turnover, expect pricing pressure); 50% of comp listings sitting > 30 days — soft ceiling on asking rent; 1,861 units permitted in Allen County in 2024 (576 in 5+ unit buildings).
- This rent runs 32% of the median local income ($53k/yr) — at the standard rent-burdened threshold; future hikes will face affordability resistance.
Forward outlook
- Local home prices are declining (-3.0%/yr); year-one equity from $1k of loan paydown is wiped out by about $4k of value loss. Plan a longer hold.
- Allen County population projected at +10% by 2050 — modest demand growth; plan on rents tracking national, not racing it.
- At projected returns (-3.0% appreciation + 7.0% rent growth), your $42k cash investment doubles in ~10 years — after that, you're playing with house money.
Negotiation context
- Only 6 days on market — expect competitive offers; lowballing is unlikely to land.
- 3 sale attempts since 9y ago with the ask held roughly flat each time — persistent listings suggest the price (not the market) is what's stuck; bring a comps-based counter.
- Current owner paid $68k; list at $150k implies a 120% gain — meaningful room to come down on a strong offer.
Risks & watch-outs
- Watch-outs: built in 1935 — expect roof / HVAC / electrical / plumbing capex.
Questions for the listing agent
- Built in 1935 — when were the roof, HVAC, electrical panel, plumbing, and water heater last replaced?
- Is there a deadline driving the sale (1031 exchange, divorce, estate, relocation)? That informs how much negotiation room exists.
- Schools are D-rated, which usually means shorter tenancies and higher turnover. Who's the typical renter profile here, and what's been the actual vacancy rate?
- What's the average days-on-market for RENTAL listings here right now (not sales)? A rising rental-DOM trend means longer vacancies and softer asking-rent achievability than the comps imply.
- What's the recent tenant-quality profile in this submarket — average credit score on applications, eviction rate, late-payment / NSF rate, and stable-employment percentage? A property-management company in the area should have these aggregated.
- How much new for-sale + rental construction is in the pipeline within 1–3 miles? Heavy new supply typically softens prices + rents 12–24 months out; constrained supply supports both.
Investment metrics
- 1% rule
- 0.94% ✗
- Cap rate
- 7.81%
- Cash-on-cash
- 5.43%
- DSCR
- 1.24
- GRM
- 8.9
CMA / ARV
- ARV (on-the-fly)
- $148,500
- Comps found
- 12
Show comp detail 12 sales within ~0.75 mi
| Address | Dist | Beds/Ba | Sqft | Sold | Price | $/sf | Match |
|---|---|---|---|---|---|---|---|
| 1603 Howell St | 0.28mi | 3/1.5 | 1,188 (0%) | 0mo | $129,900 | $109 | 87 |
| 1706 3rd St | 0.24mi | 2/1.0 (-1) | 1,199 (+1%) | 2mo | $150,000 | $125 | 79 |
| 2322 Montclair Ave | 0.35mi | 3/2.0 | 1,170 (-2%) | 6mo | $72,000 | $62 | 74 |
| 1316 Sinclair St | 0.46mi | 3/1.0 | 1,208 (+2%) | 3mo | $135,000 | $112 | 71 |
| 1646 Spring St | 0.38mi | 3/1.0 | 1,268 (+7%) | 2mo | $199,900 | $158 | 67 |
| 1901 Emma Ave | 0.49mi | 3/1.5 | 1,252 (+5%) | 3mo | $174,900 | $140 | 66 |
| 1318 Burgess St | 0.45mi | 2/1.0 (-1) | 1,152 (-3%) | 1mo | $57,000 | $49 | 66 |
| 1214 Spring St | 0.60mi | 3/1.0 | 1,164 (-2%) | 5mo | $154,500 | $133 | 62 |
| 1905 W Main St | 0.40mi | 4/1.5 (+1) | 1,320 (+11%) | 3mo | $128,250 | $97 | 55 |
| 1701 Fairhill Rd | 0.51mi | 3/1.5 | 1,320 (+11%) | 4mo | $139,000 | $105 | 54 |
| 1653 N Highlands Blvd | 0.45mi | 3/1.5 | 1,360 (+14%) | 3mo | $230,000 | $169 | 52 |
| 1830 Romane Dr | 0.73mi | 3/1.0 | 1,040 (-12%) | 10mo | $192,500 | $185 | 35 |
Match score weights: distance 35% · size 25% · config 20% · recency 20%. Top-matched comps best support the ARV.
Projected returns pro-forma
-3.0% appreciation · 6.98% rent growth · sell at horizon
- IRR
- -3.9%
- Equity multiple
- 0.85×
- Total profit
- $-6,390
- Equity at exit
- $22,365
- IRR
- 9.5%
- Equity multiple
- 1.86×
- Total profit
- $35,948
- Equity at exit
- $12,969
Cash invested: $42,000 (down + closing). Projections, not guarantees.
Landlord ↔ Tenant lean methodology
- Overall (STATE)
- 90 Strongly Landlord-Friendly
- State Indiana
- 90 Strongly Landlord-Friendly · R+11
- County
- — inherits STATE
- City
- — inherits STATE
ZIP-level market 46808
- Rents YoY
- 7.0%
- Active inventory
- 87
- Price-to-rent
- 8.9×
Monthly cashflow live
- Estimated rent
- $1,408 high interval (Pro) →
- Mortgage (P&I)
- −$787
- Tax from tax record
- −$74 /mo · $883/yr
- Insurance
- −$62
- HOA
- −$0
- Vacancy / Maint / Mgmt
- −$296
- Net cashflow
- $190
Break-even live
UW: 25.0% down · 7.5% · 30yr · 1.5% tax · 5.0% vac · 8.0% maint · 8.0% mgmt
Financing live
Cash to close
- Down payment
- $37,500
- Closing costs
- $4,500
- Reserves months
- —
- Total cash needed
- —
Loan-product check · same deal, 3 products live
Conventional
25% down · 7.5% · 30yr
- Down + closing
- —
- Monthly P&I
- —
- Monthly cashflow
- —
- DSCR
- —
- Eligible?
- —
Personal DTI + credit; lowest rate.
DSCR
20% down · 8.5% · 30yr
- Down + closing
- —
- Monthly P&I
- —
- Monthly cashflow
- —
- DSCR
- —
- Eligible?
- —
No personal income docs; deal must DSCR.
Hard money
10% down · 12.0% · 12mo
- Down + closing
- —
- Monthly P&I
- —
- Monthly cashflow
- —
- DSCR
- —
- Eligible?
- —
Short-term bridge; refi at stabilization.
Rent comps 18 comps
| Address | Beds | Baths | Sqft | Rent | $/sqft | DOM | Units | Dist |
|---|---|---|---|---|---|---|---|---|
| 1626 Howell St Unit 201 Fort Wayne, IN | 3.0 | 2.0 | 1200 | $1,700 | $1.42 | 21d | 1 | 0.22mi |
| 1502 3rd St Fort Wayne, IN | 3.0 | 1.5 | 1344 | $1,650 | $1.23 | 13d | 1 | 0.38mi |
| 1915 Ellen Ave Fort Wayne, IN | 2.0 | 1.0 | 1100 | $950 | $0.86 | 13d | 1 | 0.44mi |
| 1704 Sprunger Ave Fort Wayne, IN | 3.0 | 1.0 | 1141 | $1,400 | $1.23 | 43d | 1 | 0.49mi |
| 1437 Oakland St Fort Wayne, IN | 3.0 | 1.0 | 1000 | $1,250 | $1.25 | 43d | 1 | 0.68mi |
| 915 Garden St Fort Wayne, IN | 2.0 | 2.0 | 1275 | $1,650 | $1.29 | 13d | 1 | 0.82mi |
| 706 3rd St Unit 1 Fort Wayne, IN | 2.0 | 1.0 | 930 | $995 | $1.07 | 43d | 1 | 0.86mi |
| 901 W Wayne St Unit 3 Fort Wayne, IN | 2.0 | 2.0 | 1312 | $1,700 | $1.30 | 43d | 1 | 0.99mi |
| 835 Van Buren St Fort Wayne, IN | 2.0 | 1.0–2.0 | 750 | $1,995 | $2.66 | 13d | 29 | 1.02mi |
| 702 Archer Ave Fort Wayne, IN | 3.0 | 1.5 | 1273 | $1,499 | $1.18 | 44d | 1 | 1.02mi |
| 1332 Swinney Ave Fort Wayne, IN | 2.0 | 1.0 | 1035 | $1,300 | $1.26 | 43d | 1 | 1.13mi |
| 877 Lavina St Fort Wayne, IN | 1.0–3.0 | 1.0–2.0 | 997 | $2,980 | $2.99 | 43d | 17 | 1.19mi |
| 1104 Stophlet St Fort Wayne, IN | 3.0 | 1.5 | 1288 | $1,400 | $1.09 | 13d | 1 | 1.28mi |
| 1250 Ewing St Fort Wayne, IN | 2.0 | 1.0–2.0 | 980 | $2,081 | $2.12 | 21d | 24 | 1.36mi |
| 2718 Sherman Blvd Fort Wayne, IN | 2.0 | 1.0 | 900 | $925 | $1.03 | 21d | 1 | 1.36mi |
| 2215 Ontario St Fort Wayne, IN | 3.0 | 1.0 | 850 | $975 | $1.15 | 43d | 1 | 1.37mi |
| 2133 Riedmiller Ave Fort Wayne, IN | 3.0 | 1.0 | 1056 | $1,050 | $0.99 | 21d | 1 | 1.39mi |
| 1342 Guthrie St Fort Wayne, IN | 3.0 | 1.0 | 1200 | $899 | $0.75 | 43d | 1 | 1.47mi |
Listing history 15 events
-
2026-06-18days on market $149,999 Active 6 DOM
-
2026-06-17days on market $149,999 Active 5 DOM
-
2026-06-16days on market $149,999 Active 4 DOM
-
2026-06-15days on market $149,999 Active 3 DOM
-
2026-06-14statusdays on market $149,999 Active 1 DOM
-
2026-06-10remarks 422-char remark
-
2026-06-10status $149,999 Pending 9 DOM
-
2026-06-09days on market $149,999 Active 9 DOM
-
2026-06-09price $149,999 Active 8 DOM
-
2026-06-08days on market $152,500 Active 8 DOM
-
2026-06-07pricedays on market $152,500 Active 7 DOM
-
2026-06-03days on market $155,000 Active 3 DOM
-
2026-06-02days on market $155,000 Active 2 DOM
-
2026-05-31remarks 334-char remark
-
2026-05-31$155,000 Active 1 DOM
ⓘ Source: listings_history table (triggers on properties + properties_extension) + one-shot
backfill from property_details.listing_events for pre-trigger history.
Tax reassessment forecast IN · Partial reset (capped growth)
- Current annual tax
- $883 · $74/mo
- Projected year-2 tax
- $1,079 · $90/mo
- Expected delta
- +$196/yr (+$16/mo · 22.2%)
ⓘ Screening estimate from a state-policy table — verify with the county assessor before closing.
Climate risk First Street
- Flood 1/10 Low FEMA zone X (unshaded) · 0% chance over 30 yrs
- Wildfire 1/10 Low
- Heat 3/10 Moderate 7 d/yr ≥100°F today · 17 d/yr by 30 yrs out
- Wind 2/10 Low
- Air quality 3/10 Moderate 2 unhealthy d/yr today · 3 by 30 yrs out
Nearby sold comps map
Loading sold comps map…
Walkable amenities ~0.75 mi
Loading nearby amenities…
Taxation est. · year 1
- Rental income
- $16,902
- − Mortgage interest
- −$8,402
- − Property taxes
- −$883
- − Insurance
- −$750
- − Repairs & maintenance
- −$1,352
- − Management
- −$1,352
- − Depreciation
- −$4,364
- Taxable loss
- −$202
- Est. tax savings @ 24.0%
- +$48
- After-tax cash flow
- $2,328/yr
For passive investors: Depreciation is non-cash, so a rental often shows a tax loss while cash-flowing — sheltering income. Rental losses are passive: they offset passive income freely, and up to $25,000/yr can offset ordinary (W-2) income if you actively participate and your MAGI is under $100k (phasing out to $0 by $150k); unused losses carry forward. On sale, claimed depreciation is recaptured at up to 25%, and gains may owe capital-gains tax (a 1031 exchange can defer both). Figures are a year-1 estimate at your 24.0% rate — not tax advice; consult a CPA.
Schools (NCES district)
- District
- Fort Wayne Community Schools
- NCES district ID
- 1803630
- Math proficiency
- 22% ▼ -11.00%
- Reading proficiency
- 29% ▼ -7.00%
- Median HH income
- $41,951
- Composite
- 21.68/100
- National rank
- #8275
- State rank
- #263 of 301 in IN
Livability — Fort Wayne
- Score
- 84/100
- State rank
- #6
- US rank
- #676
Category grades
Schools grade is shown separately in the Schools card above.
Census & demographics
- Census place
- Fort Wayne, IN
- County
- Allen County · 326,813 people
- City population
- 326,813
- Metro
- Fort Wayne, IN
- Population (ZIP)
- 19,684
- Household income
- $53,359
- Rent vs Own
- Severe rent burden
- 625.0
Population outlook (Allen County) Hauer SSP2
- Today (2025)
- 394,020 people
- By 2030
- 405,128 · +2.8%
- By 2040
- 423,476 · +7.5%
- By 2050
- 435,137 · +10.4%
- By 2075
- 450,293 · +14.3%
- By 2100
- 424,101 · +7.6%
Race, ethnicity, and origin ACS 2023
- Neighborhood character
- Predominantly White (71%)
- Race & ethnicity
- White 71% Hispanic / Latino 13% Two or more races 9% Black 9% Asian 2%
- Hispanic origin (detail)
- Mexican 10% Puerto Rican 2%
- Common ancestry
- Romanian 3% Lithuanian 2% Slovak 2%
- Foreign-born
- 7% · Canada, Philippines, South Korea
- Languages at home
- 86% English-only · Spanish 10% Korean 2% Other Asian/Pacific 1%
Political lean MEDSL · Allen
- 2024 margin
- R (+12.5) · D 42.9% · R 55.4% · Other 1.7%
- 2008→2024 swing
- -8.1pp toward R · 2008: -4.3pp · 2024: -12.5pp
- All cycles
- 2024: R+12.5 2020: R+11.2 2016: R+19.6 2012: R+16.8 2008: R+4.3
Not yet ingested
- Civics
- —
Market trends
- HPI YoY
- ▼ -288.51%
- Current HPI
- 239.6115
- Rent YoY
- ▲ 6.98%
- Metro
- Fort Wayne, IN
- State GDP YoY
- ▲ 2.90%
- F500 in state
- 18
Industry mix (Fortune 500 HQ in IN)
| Industry | F500 HQs | Revenue |
|---|---|---|
| Industrial Machinery | 2 | $37B |
|
||
| Healthcare | 1 | $177B |
|
||
| Pharmaceuticals | 1 | $45B |
|
||
| Metals / Steel | 1 | $18B |
|
||
| Agriculture | 1 | $17B |
|
||
| Packaging | 1 | $12B |
|
||
Price history
+158.8% since first listed4 events — show timeline
- 2026-05-31 Listed $155,000 IRMLS
- 2018-04-05 Sold (MLS) $68,300 IRMLS
- 2018-03-15 Listed $68,300 IRMLS
- 2017-09-21 Listed $59,900 IRMLS
Property tax history
+1.2%/yrLatest (2024): $883 · +24.5% YoY. Source: county tax records.
Cash-flow waterfall
monthlySold comps — $/sqft
last 12 mo · ≤1 miLoading sold comps…