 Fourplex
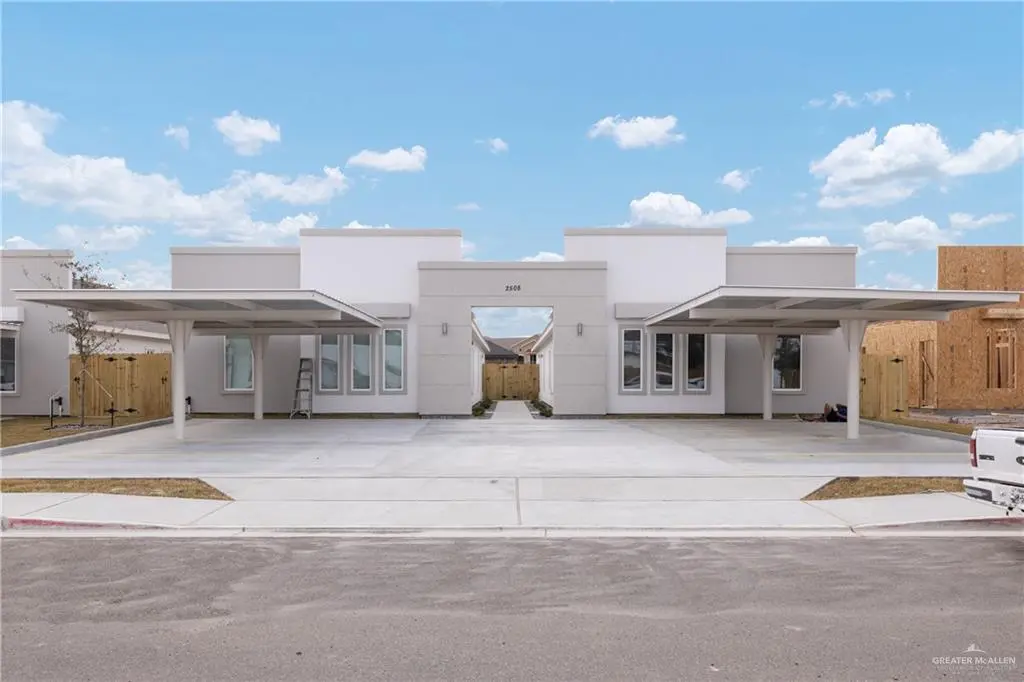
2508 E Harrison Ave · Alton, TX
Flood risk 1/10 · Minimal
- FEMA flood zone
- X
- Chance of flooding over 30 yrs
- 0.0%
- Est. flood insurance / yr
- $507 – $1,088
Fire risk 6/10 · Moderate
- Est. fire insurance / yr
- $1,222 – $2,270
Heat risk 9/10 · Severe
- Hot days now (above 112°F)
- 7 days/yr
- Hot days in 30 yrs
- 22 days/yr
Wind risk 8/10 · Major
- Chance of severe wind over 30 yrs
- 96.0%
Air-quality risk 2/10 · Minimal
- Unhealthy air days now
- 0 days/yr
- Unhealthy air days in 30 yrs
- 1 days/yr
Risk factors via First Street. Map © Google.
Why this score? — see what drove the C grade
The composite is a weighted blend of 9 inputs, each scored 0–100. Each bar is that input's sub-score; the figure is the points it added to the 100-point composite (weight × sub-score).
- Cash flow +16.6/30.0
- ARV discount +11.7/15.0
- Appreciation +10.0/10.0
- DSCR +5.2/10.0
- 1% rule +4.6/10.0
- Condition / age +4.0/5.0
- Rent growth +3.1/5.0
- Livability +2.9/5.0
- Schools +1.7/10.0
$469,000
🖨 Deal sheet 📄 Offer letter ✓ Due diligence
Multi-family units
County records classify this as Multi-Family (2-4 Unit). Listing-text estimate: 4 units. confirmed
Listing remarks MLS
Discover Your Next Investment Opportunity at Westwood Villas! Now available in Westwood Villas, this fourplex in Alton, Texas offers an excellent opportunity for both seasoned investors and first-time homebuyers looking to house-hack or generate rental income. Conveniently located along Stewart Rd and Lark Ave, this property provides easy access to major roads, schools, shopping, and everyday essentials. This modern fourplex features a highly desirable unit mix: Two (2) units: 2-bedroom, 2-bath and the other two (2) units: 3-bedroom, 2-bath. Each unit is thoughtfully designed with functional layouts to attract long-term tenants and provide steady rental potential. Whether you’re growing your portfolio or purchasing your first income-producing property, this fourplex offers flexibility, income opportunity, and long-term value in a rapidly developing area. Don’t miss this chance to own a strong multifamily property in one of Alton’s newest communities.
Key facts
- 9,739 sq ft lot
- Garage
- Built 2025
Neighborhood map
What this means for you Summary
Snapshot
- This is a 2×2bd/2ba + 2×3bd/2ba units multifamily listed at $469k. Condition is rated good.
Deal economics
- At list price, monthly cash flow is $287 ($3k/yr) — positive. Per door: $72/mo.
- The deal already cash-flows at list — no discount required.
- To meet the 1% rule (rent ≥ 1% of price), the offer needs to be $449k (4.2% below list).
- Recommended offer: $413k (12.0% below list) — sets the bar for market timing.
- Cap rate 7.0% vs local median 2.6% in Alton — top-decile yield for the area; either an underpriced asset or a hidden risk that comps aren't pricing in. Stress-test before assuming the spread holds.
Location & tenants
- Location reads 58/100 on livability (#1,230 in TX) — a working-class tenant base; expect higher turnover. Strengths: cost of living A+, housing A; Watch: schools F, crime F, amenities F.
- Mission CISD (urban): math 15% / reading 28% proficiency, ranked #775 of 826 in TX (top 94%) — low school quality limits family demand, transient renter base, plan for 1-2y turnover; 78% free/reduced lunch — lower-income household profile, screen leases tightly.
- Market conditions: Rents rising (+2.5%/yr); 623 active listings in the ZIP; 9 comparable units currently listed for rent nearby; rentals at typical pace (median 23d on market — plan ~3-4 weeks tenant-placement turnaround); 7,378 units permitted in Hidalgo County in 2024 (641 in 5+ unit buildings).
- At $4,493/mo this rent would consume 98% of the median local household income ($55k/yr) (locally 855% of renters already pay >50% of income on rent) — very limited rent-growth headroom before tenants either downsize or default.
Forward outlook
- In year one you build about $50k of equity ($3k loan paydown + $47k appreciation (10.0% local appreciation)).
- Hidalgo County population projected at +28% by 2050 — long-run rental-demand tailwind backs the buy-and-hold thesis.
- At projected returns (10.0% appreciation + 2.5% rent growth), your $131k cash investment doubles in ~3 years — after that, you're playing with house money.
- By year 2, paydown + projected appreciation supports a ~$81k cash-out refi (75% LTV) — recoverable capital for the next deal without selling this one.
Negotiation context
- It's been on market 189 days — a 12% lower offer ($413k) is reasonable based on typical stale-listing flexibility.
Risks & watch-outs
- Climate carrying-cost: severe wind risk, 96% chance of damaging wind over 30y; major wildfire risk; extreme-heat days projected 7→22/yr by 2055 (HVAC capex compounding) — expect insurance premiums to compound above CPI over the hold.
Questions for the listing agent
- It's been on market 189 days. Have you received any prior offers? Is the seller open to a 12% concession, seller financing, or rate buy-down credit?
- Can we see the unit-by-unit rent roll, current vacancy, and any below-market leases? What's the average tenancy length?
- What capital expenditures (roof, boiler, parking lot, exteriors) have been made in the last 5 years, and what's planned in the next 2?
- What does the HOA fee cover, when was the last increase, and are there any pending special assessments or reserve-fund shortfalls?
- Why hasn't it sold? Are there any deal-killer items the seller is aware of (foundation, flood, title, zoning, code violations)?
- Is there a deadline driving the sale (1031 exchange, divorce, estate, relocation)? That informs how much negotiation room exists.
- Schools are F-rated, which usually means shorter tenancies and higher turnover. Who's the typical renter profile here, and what's been the actual vacancy rate?
- Crime grade is F in this area — have there been break-ins, vandalism, or insurance claims at this property in the last 3 years? What carrier currently insures it and at what premium?
- What's the average days-on-market for RENTAL listings here right now (not sales)? A rising rental-DOM trend means longer vacancies and softer asking-rent achievability than the comps imply.
- What's the recent tenant-quality profile in this submarket — average credit score on applications, eviction rate, late-payment / NSF rate, and stable-employment percentage? A property-management company in the area should have these aggregated.
- How much new apartment / multifamily construction is in the pipeline within 1–3 miles? Heavy new supply (>2% of stock underway) typically softens rents 12–24 months out; light construction supports rent growth.
Investment metrics
- 1% rule
- 0.96% ✗
- Cap rate
- 7.03%
- Cash-on-cash
- 2.63%
- DSCR
- 1.12
- GRM
- 8.7
CMA / ARV
- ARV (median comp)
- $516,953
- List price
- $469,000
- Delta
- -9.28%
- Verdict
- FAIR
- Comps
- 20 within 1.0 mi
Show comp detail 12 sales within ~0.75 mi
| Address | Dist | Beds/Ba | Sqft | Sold | Price | $/sf | Match |
|---|---|---|---|---|---|---|---|
| 2508 E Harrison Ave | 0.00mi | —/— | 4,052 (0%) | 0mo | $469,000 | $116 | 100 |
| 2705 E Israel Ave | 0.02mi | —/— | 4,032 (-0%) | 10mo | $520,000 | $129 | 90 |
| 2605 E Israel Ave | 0.02mi | —/— | 4,032 (-0%) | 12mo | $535,000 | $133 | 88 |
| 2812 E Israel Ave | 0.05mi | —/— | 4,032 (-0%) | 12mo | $500,000 | $124 | 87 |
| 2513 E Israel Ave | 0.02mi | —/— | 4,319 (+7%) | 9mo | $535,000 | $124 | 81 |
| 2713 E Israel Ave | 0.02mi | —/— | 4,319 (+7%) | 10mo | $534,900 | $124 | 80 |
| 1410 S Michigan St | 0.56mi | —/— | 4,010 (-1%) | 0mo | $450,000 | $112 | 72 |
| 1521 W St. Francis Ave | 0.40mi | —/— | 3,992 (-2%) | 11mo | $489,000 | $122 | 70 |
| 1406 S Michigan St | 0.44mi | —/— | 4,010 (-1%) | 11mo | $465,000 | $116 | 69 |
| 1406 S Michigan St | 0.55mi | —/— | 4,010 (-1%) | 6mo | $465,000 | $116 | 68 |
| 1310 Harrison | 0.36mi | 12/8.0 | 4,200 (+4%) | 16mo | $495,500 | $118 | 64 |
| 1414 S Michigan St | 0.44mi | —/— | 4,190 (+3%) | 12mo | $505,000 | $121 | 64 |
Match score weights: distance 35% · size 25% · config 20% · recency 20%. Top-matched comps best support the ARV.
Projected returns pro-forma
10.0% appreciation · 2.45% rent growth · sell at horizon
- IRR
- 26.0%
- Equity multiple
- 3.07×
- Total profit
- $271,337
- Equity at exit
- $422,512
- IRR
- 22.7%
- Equity multiple
- 6.94×
- Total profit
- $779,906
- Equity at exit
- $911,164
Cash invested: $131,320 (down + closing). Projections, not guarantees.
Landlord ↔ Tenant lean methodology
- Overall (STATE)
- 87 Strongly Landlord-Friendly
- State Texas
- 87 Strongly Landlord-Friendly · R+5
- County
- — inherits STATE
- City
- — inherits STATE
ZIP-level market 78573
- Home prices YoY
- 8.0%
- Rents YoY
- 2.5%
- Active inventory
- 623
- Price-to-rent
- 35.8×
Monthly cashflow live
- Estimated rent
- $4,493 high interval (Pro) →
- Mortgage (P&I)
- −$2,459
- Tax est. 1.5%
- −$586 /mo · $7,035/yr
- Insurance
- −$195
- HOA
- −$21
- Vacancy / Maint / Mgmt
- −$944
- Net cashflow
- $287
Break-even live
4-unit breakdown (identical units grouped — click to expand)
| Units | Beds | Baths | Est. rent |
|---|---|---|---|
| 2× units | 2 | 2 | $2,186 |
| #1 | 2 | 2 | $1,093 |
| #2 | 2 | 2 | $1,093 |
| 2× units | 3 | 2 | $2,306 |
| #3 | 3 | 2 | $1,153 |
| #4 | 3 | 2 | $1,153 |
| Total (4 units) | $4,493 | ||
UW: 25.0% down · 7.5% · 30yr · 1.5% tax · 5.0% vac · 8.0% maint · 8.0% mgmt
Financing live
Cash to close
- Down payment
- $117,250
- Closing costs
- $14,070
- Reserves months
- —
- Total cash needed
- —
Loan-product check · same deal, 3 products live
Conventional
25% down · 7.5% · 30yr
- Down + closing
- —
- Monthly P&I
- —
- Monthly cashflow
- —
- DSCR
- —
- Eligible?
- —
Personal DTI + credit; lowest rate.
DSCR
20% down · 8.5% · 30yr
- Down + closing
- —
- Monthly P&I
- —
- Monthly cashflow
- —
- DSCR
- —
- Eligible?
- —
No personal income docs; deal must DSCR.
Hard money
10% down · 12.0% · 12mo
- Down + closing
- —
- Monthly P&I
- —
- Monthly cashflow
- —
- DSCR
- —
- Eligible?
- —
Short-term bridge; refi at stabilization.
Rent comps 9 comps
| Address | Beds | Baths | Sqft | Rent | $/sqft | DOM | Units | Dist |
|---|---|---|---|---|---|---|---|---|
| 1404 W Harrison Ave Unit 3 Alton, TX | 3.0 | 2.0 | 4320 | $1,100 | $0.25 | 43d | 1 | 0.33mi |
| 825 S Michigan St Mission, TX | 2.0 | 1.5 | 4144 | $685 | $0.17 | 23d | 1 | 0.46mi |
| 810 N Missouri St Unit 2 Alton, TX | 2.0 | 2.0 | 3960 | $950 | $0.24 | 43d | 1 | 0.88mi |
| 913 W Kohala Ave #3 Mission, TX | 2.0 | 2.0 | 4354 | $975 | $0.22 | 14d | 1 | 1.18mi |
| 1008 W Kohala Ave Unit 4 Alton, TX | 2.0 | 2.0 | 3596 | $1,100 | $0.31 | 23d | 1 | 1.20mi |
| 312 W Campeche Ave Unit 3 Alton, TX | 2.0 | 2.0 | 4050 | $1,000 | $0.25 | 23d | 1 | 1.22mi |
| 812 N Kentucky St Unit 2 Alton, TX | 3.0 | 2.0 | 4032 | $1,050 | $0.26 | 43d | 1 | 1.29mi |
| 1101 W Sunset Valley St Unit 3 Alton, TX | 2.0 | 2.0 | 4032 | $1,000 | $0.25 | 23d | 1 | 1.30mi |
| 116 W Campeche Ave Mission, TX | 2.0 | 2.0 | 4050 | $1,100 | $0.27 | 23d | 1 | 1.47mi |
HOA detail
- Monthly dues
- $21 · $252/yr
Listing history 10 events
-
2026-06-10days on market $469,000 Active 189 DOM
-
2026-06-09days on market $469,000 Active 188 DOM
-
2026-06-08days on market $469,000 Active 187 DOM
-
2026-06-07days on market $469,000 Active 186 DOM
-
2026-06-03days on market $469,000 Active 182 DOM
-
2026-06-02days on market $469,000 Active 181 DOM
-
2026-06-01days on market $469,000 Active 180 DOM
-
2026-05-31days on market $469,000 Active 179 DOM
-
2026-05-31days on market $469,000 Active 178 DOM
-
2025-12-03$469,000 Active 982-char remark
Show marketing remark (982 chars)
Discover Your Next Investment Opportunity at Westwood Villas! Now available in Westwood Villas, this fourplex in Alton, Texas offers an excellent opportunity for both seasoned investors and first-time homebuyers looking to house-hack or generate rental income. Conveniently located along Stewart Rd and Lark Ave, this property provides easy access to major roads, schools, shopping, and everyday essentials. This modern fourplex features a highly desirable unit mix: Two (2) units: 2-bedroom, 2-bath and the other two (2) units: 3-bedroom, 2-bath. Each unit is thoughtfully designed with functional layouts to attract long-term tenants and provide steady rental potential. Whether you’re growing your portfolio or purchasing your first income-producing property, this fourplex offers flexibility, income opportunity, and long-term value in a rapidly developing area. Don’t miss this chance to own a strong multifamily property in one of Alton’s newest communities.
ⓘ Source: listings_history table (triggers on properties + properties_extension) + one-shot
backfill from property_details.listing_events for pre-trigger history.
Climate risk First Street
- Flood 1/10 Low FEMA zone X · 0% chance over 30 yrs
- Wildfire 6/10 Major
- Heat 9/10 Extreme 7 d/yr ≥112°F today · 22 d/yr by 30 yrs out
- Wind 8/10 Severe 96% chance of damaging wind over 30 yrs
- Air quality 2/10 Low 0 unhealthy d/yr today · 1 by 30 yrs out
Nearby sold comps map
Loading sold comps map…
Walkable amenities ~0.75 mi
Loading nearby amenities…
Taxation est. · year 1
- Rental income
- $53,916
- − Mortgage interest
- −$26,271
- − Property taxes
- −$7,035
- − Insurance
- −$2,345
- − Repairs & maintenance
- −$4,313
- − Management
- −$4,313
- − HOA
- −$252
- − Depreciation
- −$13,644
- Taxable loss
- −$4,257
- Est. tax savings @ 24.0%
- +$1,022
- After-tax cash flow
- $4,470/yr
For passive investors: Depreciation is non-cash, so a rental often shows a tax loss while cash-flowing — sheltering income. Rental losses are passive: they offset passive income freely, and up to $25,000/yr can offset ordinary (W-2) income if you actively participate and your MAGI is under $100k (phasing out to $0 by $150k); unused losses carry forward. On sale, claimed depreciation is recaptured at up to 25%, and gains may owe capital-gains tax (a 1031 exchange can defer both). Figures are a year-1 estimate at your 24.0% rate — not tax advice; consult a CPA.
Condition & rehab AI · 6 photos
This fourplex is in excellent condition with no visible repairs needed. It offers a good investment opportunity with potential for rental or resale value enhancement through minor updates.
Value-add opportunities
- Both Paint exterior and interior walls — Fresh paint enhances curb appeal and interior aesthetics
- Both Install landscaping around the front yard — Landscaping improves curb appeal and adds value
- Both Install new flooring in bathrooms — New flooring in bathrooms enhances aesthetics and functionality
- Both Install new kitchen appliances — New appliances in the kitchen improve functionality and aesthetics
- Both Install new bathroom fixtures — New fixtures in bathrooms enhance functionality and aesthetics
Renovation cost estimate screening
Value-add ROI direction
- Both Paint exterior and interior walls — Fresh paint enhances curb appeal and interior aesthetics ↑
- Both Install landscaping around the front yard — Landscaping improves curb appeal and adds value ↑
- Both Install new flooring in bathrooms — New flooring in bathrooms enhances aesthetics and functionality ↑
- Both Install new kitchen appliances — New appliances in the kitchen improve functionality and aesthetics ↑
- Both Install new bathroom fixtures — New fixtures in bathrooms enhance functionality and aesthetics ↑
ⓘ Cost ranges are severity-bucket heuristics (US national rule-of-thumb). Get contractor quotes + a written scope before underwriting a rehab budget.
Schools (NCES district)
- District
- Mission CISD
- NCES district ID
- 4831040
- Math proficiency
- 15% ▼ -35.00%
- Reading proficiency
- 28% ▼ -15.00%
- Median HH income
- $32,855
- Composite
- 17.47/100
- National rank
- #9061
- State rank
- #775 of 826 in TX
Livability — Alton
- Score
- 58/100
- State rank
- #1230
- US rank
- #21479
Category grades
Schools grade is shown separately in the Schools card above.
Census & demographics
- Census place
- Alton, TX
- County
- Hidalgo County · 623,128 people
- City population
- 44,809
- Metro
- McAllen-Edinburg-Mission, TX
- Population (ZIP)
- 44,809
- Household income
- $55,000
- Rent vs Own
- Severe rent burden
- 855.0
Population outlook (Hidalgo County) Hauer SSP2
- Today (2025)
- 955,232 people
- By 2030
- 1,009,774 · +5.7%
- By 2040
- 1,120,332 · +17.3%
- By 2050
- 1,225,036 · +28.2%
- By 2075
- 1,439,189 · +50.7%
- By 2100
- 1,533,429 · +60.5%
Race, ethnicity, and origin ACS 2023
- Neighborhood character
- Predominantly Hispanic (96%)
- Race & ethnicity
- Hispanic / Latino 96% Two or more races 63% White 3%
- Hispanic origin (detail)
- Mexican 94%
- Foreign-born
- 28% · Canada
- Languages at home
- 12% English-only · Spanish 88%
Political lean MEDSL · Hidalgo
- 2024 margin
- Toss-up / Even · D 48.1% · R 51.0%
- 2008→2024 swing
- -41.6pp toward R · 2008: 38.7pp · 2024: -2.9pp
- All cycles
- 2024: R+2.9 2020: D+17.1 2016: D+40.5 2012: D+41.8 2008: D+38.7
Not yet ingested
- Civics
- —
Market trends
- HPI YoY
- ▲ 17.95%
- Current HPI
- 242.0711
- Rent YoY
- ▲ 2.45%
- Metro
- McAllen-Edinburg-Mission, TX
- State GDP YoY
- ▲ 3.95%
- F500 in state
- 110
Industry mix (Fortune 500 HQ in TX)
| Industry | F500 HQs | Revenue |
|---|---|---|
| Energy | 16 | $1,198B |
|
||
| Technology | 5 | $198B |
|
||
| Engineering / Construction | 4 | $72B |
|
||
| Energy Services | 3 | $60B |
|
||
| Utilities | 3 | $41B |
|
||
| Healthcare | 2 | $330B |
|
||
Price history
1 event — show timeline
- 2025-12-03 Listed $469,000 MCALLENMLS
Cash-flow waterfall
monthlySold comps — $/sqft
last 12 mo · ≤1 miLoading sold comps…