108 Curtis St · Aulander, NC
Flood risk 1/10 · Minimal
- FEMA flood zone
- X (unshaded)
- Chance of flooding over 30 yrs
- 0.0%
- Est. flood insurance / yr
- $507 – $1,088
Fire risk 3/10 · Minor
- Est. fire insurance / yr
- $906 – $1,684
Heat risk 8/10 · Major
- Hot days now (above 107°F)
- 7 days/yr
- Hot days in 30 yrs
- 16 days/yr
Wind risk 7/10 · Major
- Chance of severe wind over 30 yrs
- 78.0%
Air-quality risk 1/10 · Minimal
- Unhealthy air days now
- 0 days/yr
- Unhealthy air days in 30 yrs
- 0 days/yr
Risk factors via First Street. Map © Google.
Why this score? — see what drove the B grade
The composite is a weighted blend of 9 inputs, each scored 0–100. Each bar is that input's sub-score; the figure is the points it added to the 100-point composite (weight × sub-score).
- Cash flow +30.0/30.0
- 1% rule +10.0/10.0
- DSCR +10.0/10.0
- ARV discount +7.5/15.0
- Appreciation +6.2/10.0
- Livability +2.8/5.0
- Rent growth +2.5/5.0
- Schools +1.9/10.0
- Condition / age +1.0/5.0
$50,000
🖨 Deal sheet 📄 Offer letter ✓ Due diligence
Listing remarks
Home has been completed gutted after house fire in October 2024
Key facts
- Built 1960
Neighborhood map
What this means for you Summary
Snapshot
- This is a 3-bed/1.0-bath other listed at $50k. Condition is rated poor.
Deal economics
- At list price, monthly cash flow is $498 ($6k/yr) — positive.
- The deal already cash-flows at list — no discount required.
- Meets the 1% rule at list price ($1k rent vs $50k).
Location & tenants
- Location reads 56/100 on livability (#623 in NC) — a working-class tenant base; expect higher turnover. Strengths: cost of living A+, housing B; Watch: schools F, crime F, amenities F.
- Bertie County Schools (rural): math 17% / reading 31% proficiency, ranked #165 of 178 in NC (top 93%) — low school quality limits family demand, transient renter base, plan for 1-2y turnover; 80% free/reduced lunch — lower-income household profile, screen leases tightly.
- Market conditions: 7 active listings in the ZIP; 46 units permitted in Bertie County in 2024 (0 in 5+ unit buildings).
Forward outlook
- In year one you build about $2k of equity ($346 loan paydown + $1k appreciation (2.5% local appreciation)).
- Bertie County population projected at -30% by 2050 — secular population decline; favor cash flow + early exit over multi-decade hold.
- At projected returns (2.5% appreciation + 3.0% rent growth), your $14k cash investment doubles in ~2 years — after that, you're playing with house money.
Negotiation context
- Only 1 days on market — expect competitive offers; lowballing is unlikely to land.
Risks & watch-outs
- Climate carrying-cost: major wind risk, 78% chance of damaging wind over 30y; extreme-heat days projected 7→16/yr by 2055 (HVAC capex compounding) — expect insurance premiums to compound above CPI over the hold.
Questions for the listing agent
- Have any recent inspections been done? Can we get a copy of the seller's disclosures and any deferred-maintenance estimates?
- Built in 1960 — when were the roof, HVAC, electrical panel, plumbing, and water heater last replaced?
- Is there a deadline driving the sale (1031 exchange, divorce, estate, relocation)? That informs how much negotiation room exists.
- Schools are F-rated, which usually means shorter tenancies and higher turnover. Who's the typical renter profile here, and what's been the actual vacancy rate?
- Crime grade is F in this area — have there been break-ins, vandalism, or insurance claims at this property in the last 3 years? What carrier currently insures it and at what premium?
- What's the average days-on-market for RENTAL listings here right now (not sales)? A rising rental-DOM trend means longer vacancies and softer asking-rent achievability than the comps imply.
- What's the recent tenant-quality profile in this submarket — average credit score on applications, eviction rate, late-payment / NSF rate, and stable-employment percentage? A property-management company in the area should have these aggregated.
- How much new for-sale + rental construction is in the pipeline within 1–3 miles? Heavy new supply typically softens prices + rents 12–24 months out; constrained supply supports both.
Investment metrics
- 1% rule
- 2.14% ✓
- Cap rate
- 18.24%
- Cash-on-cash
- 42.68%
- DSCR
- 2.90
- GRM
- 3.9
CMA / ARV
No comps found within radius.
Projected returns pro-forma
2.49% appreciation · 3.0% rent growth · sell at horizon
- IRR
- 47.4%
- Equity multiple
- 3.60×
- Total profit
- $36,411
- Equity at exit
- $21,057
- IRR
- 47.6%
- Equity multiple
- 7.21×
- Total profit
- $86,909
- Equity at exit
- $31,384
Cash invested: $14,000 (down + closing). Projections, not guarantees.
Landlord ↔ Tenant lean methodology
- Overall (STATE)
- 85 Strongly Landlord-Friendly
- State North Carolina
- 85 Strongly Landlord-Friendly · R+3
- County
- — inherits STATE
- City
- — inherits STATE
ZIP-level market 27805
- Home prices YoY
- 1.8%
- Active inventory
- 7
- Price-to-rent
- 3.9×
Monthly cashflow live
- Estimated rent
- $1,068 medium interval (Pro) →
- Mortgage (P&I)
- −$262
- Tax est. 1.5%
- −$62 /mo · $750/yr
- Insurance
- −$21
- HOA
- −$0
- Vacancy / Maint / Mgmt
- −$224
- Net cashflow
- $498
Break-even live
UW: 25.0% down · 7.5% · 30yr · 1.5% tax · 5.0% vac · 8.0% maint · 8.0% mgmt
Financing live
Cash to close
- Down payment
- $12,500
- Closing costs
- $1,500
- Reserves months
- —
- Total cash needed
- —
Loan-product check · same deal, 3 products live
Conventional
25% down · 7.5% · 30yr
- Down + closing
- —
- Monthly P&I
- —
- Monthly cashflow
- —
- DSCR
- —
- Eligible?
- —
Personal DTI + credit; lowest rate.
DSCR
20% down · 8.5% · 30yr
- Down + closing
- —
- Monthly P&I
- —
- Monthly cashflow
- —
- DSCR
- —
- Eligible?
- —
No personal income docs; deal must DSCR.
Hard money
10% down · 12.0% · 12mo
- Down + closing
- —
- Monthly P&I
- —
- Monthly cashflow
- —
- DSCR
- —
- Eligible?
- —
Short-term bridge; refi at stabilization.
Listing history 1 events
-
2026-05-26$50,000 Active
ⓘ Source: listings_history table (triggers on properties + properties_extension) + one-shot
backfill from property_details.listing_events for pre-trigger history.
Climate risk First Street
- Flood 1/10 Low FEMA zone X (unshaded) · 0% chance over 30 yrs
- Wildfire 3/10 Moderate
- Heat 8/10 Severe 7 d/yr ≥107°F today · 16 d/yr by 30 yrs out
- Wind 7/10 Severe 78% chance of damaging wind over 30 yrs
- Air quality 1/10 Low 0 unhealthy d/yr today · 0 by 30 yrs out
Nearby sold comps map
Loading sold comps map…
Walkable amenities ~0.75 mi
Loading nearby amenities…
Taxation est. · year 1
- Rental income
- $12,812
- − Mortgage interest
- −$2,801
- − Property taxes
- −$750
- − Insurance
- −$250
- − Repairs & maintenance
- −$1,025
- − Management
- −$1,025
- − Depreciation
- −$1,455
- Taxable income
- $5,506
- Est. tax owed @ 24.0%
- −$1,322
- After-tax cash flow
- $4,653/yr
For passive investors: Depreciation is non-cash, so a rental often shows a tax loss while cash-flowing — sheltering income. Rental losses are passive: they offset passive income freely, and up to $25,000/yr can offset ordinary (W-2) income if you actively participate and your MAGI is under $100k (phasing out to $0 by $150k); unused losses carry forward. On sale, claimed depreciation is recaptured at up to 25%, and gains may owe capital-gains tax (a 1031 exchange can defer both). Figures are a year-1 estimate at your 24.0% rate — not tax advice; consult a CPA.
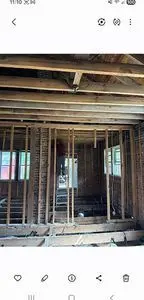
Condition & rehab AI · 2 photos
The home has been gutted after a fire and requires a complete rebuild. Significant repairs and updates are needed to make it habitable and marketable.
Repairs flagged
- Major Structural integrity — The home has been gutted after a fire
- Major Electrical system — The home has been gutted after a fire
- Major Plumbing system — The home has been gutted after a fire
- Major HVAC system — The home has been gutted after a fire
- Major Interior walls and flooring — The home has been gutted after a fire
Value-add opportunities
- Both Rebuild the entire home from the ground up — A complete rebuild would significantly increase both resale and rental value
- Resale Install modern appliances and fixtures — Modern appliances and fixtures would appeal to buyers
- Both Add energy-efficient windows and doors — Energy-efficient windows and doors would improve energy efficiency and appeal to buyers and renters
- Both Landscaping and curb appeal improvements — A well-maintained yard and curb appeal would attract more buyers and renters
Renovation cost estimate screening
| Repair item | Severity | Est. cost |
|---|---|---|
| Structural integrity · The home has been gutted after a fire | Major | $15,000–50,000 |
| Electrical system · The home has been gutted after a fire | Major | $15,000–50,000 |
| Plumbing system · The home has been gutted after a fire | Major | $15,000–50,000 |
| HVAC system · The home has been gutted after a fire | Major | $15,000–50,000 |
| Interior walls and flooring · The home has been gutted after a fire | Major | $15,000–50,000 |
| Total estimated repair cost · 5 items | $75,000–250,000 |
Value-add ROI direction
- Both Rebuild the entire home from the ground up — A complete rebuild would significantly increase both resale and rental value ↑
- Resale Install modern appliances and fixtures — Modern appliances and fixtures would appeal to buyers ↑
- Both Add energy-efficient windows and doors — Energy-efficient windows and doors would improve energy efficiency and appeal to buyers and renters ↑
- Both Landscaping and curb appeal improvements — A well-maintained yard and curb appeal would attract more buyers and renters ↑
ⓘ Cost ranges are severity-bucket heuristics (US national rule-of-thumb). Get contractor quotes + a written scope before underwriting a rehab budget.
Schools (NCES district)
- District
- Bertie County Schools
- NCES district ID
- 3700360
- Math proficiency
- 17% ▼ -7.00%
- Reading proficiency
- 31% ▼ -2.00%
- Median HH income
- $30,361
- Composite
- 19.3/100
- National rank
- #8797
- State rank
- #165 of 178 in NC
Livability — Aulander
- Score
- 56/100
- State rank
- #623
- US rank
- #22650
Category grades
Schools grade is shown separately in the Schools card above.
Census & demographics
- Census place
- Aulander, NC
- Population (ZIP)
- 3,187
Population outlook (Bertie County) Hauer SSP2
- Today (2025)
- 18,388 people
- By 2030
- 17,285 · -6.0%
- By 2040
- 14,982 · -18.5%
- By 2050
- 12,963 · -29.5%
- By 2075
- 10,051 · -45.3%
- By 2100
- 8,320 · -54.8%
Race, ethnicity, and origin ACS 2023
- Neighborhood character
- Majority Black (61%)
- Race & ethnicity
- Black 61% White 37% Two or more races 2%
- Common ancestry
- Italian 1% Danish 1%
- Foreign-born
- 1% · Canada
Political lean MEDSL · Bertie
- 2024 margin
- D (+15.7) · D 57.6% · R 41.9%
- 2008→2024 swing
- -14.9pp toward R · 2008: 30.6pp · 2024: 15.7pp
- All cycles
- 2024: D+15.7 2020: D+21.6 2016: D+25.2 2012: D+31.9 2008: D+30.6
Not yet ingested
- Civics
- —
Market trends
- HPI YoY
- ▲ 2.49%
- Current HPI
- 142.9672
- Rent YoY
- —
- Metro
- —
- State GDP YoY
- ▲ 3.28%
- F500 in state
- 26
Industry mix (Fortune 500 HQ in NC)
| Industry | F500 HQs | Revenue |
|---|---|---|
| Financial Services | 2 | $213B |
|
||
| Retail | 2 | $95B |
|
||
| Industrial Conglomerate | 1 | $38B |
|
||
| Metals / Steel | 1 | $35B |
|
||
| Utilities | 1 | $30B |
|
||
| Industrial Machinery | 1 | $19B |
|
||
Price history
1 event — show timeline
- 2026-05-26 Listed $50,000 FSBO.com
Cash-flow waterfall
monthlySold comps — $/sqft
last 12 mo · ≤1 miLoading sold comps…