5131 Saint Clair St · Detroit, MI
Flood risk 4/10 · Minor
- FEMA flood zone
- X (unshaded)
- Chance of flooding over 30 yrs
- 0.22%
- Est. flood insurance / yr
- $507 – $1,088
Fire risk 1/10 · Minimal
- Est. fire insurance / yr
- $784 – $1,456
Heat risk 3/10 · Minor
- Hot days now (above 96°F)
- 7 days/yr
- Hot days in 30 yrs
- 15 days/yr
Wind risk 2/10 · Minimal
- Chance of severe wind over 30 yrs
- —
Air-quality risk 3/10 · Minor
- Unhealthy air days now
- 2 days/yr
- Unhealthy air days in 30 yrs
- 5 days/yr
Risk factors via First Street. Map © Google.
Why this score? — see what drove the B grade
The composite is a weighted blend of 9 inputs, each scored 0–100. Each bar is that input's sub-score; the figure is the points it added to the 100-point composite (weight × sub-score).
- Cash flow +30.0/30.0
- ARV discount +15.0/15.0
- 1% rule +10.0/10.0
- DSCR +10.0/10.0
- Livability +3.7/5.0
- Rent growth +2.5/5.0
- Condition / age +2.5/5.0
- Schools +1.3/10.0
- Appreciation +0.0/10.0
$60,000
🖨 Deal sheet 📄 Offer letter ✓ Due diligence
Listing remarks
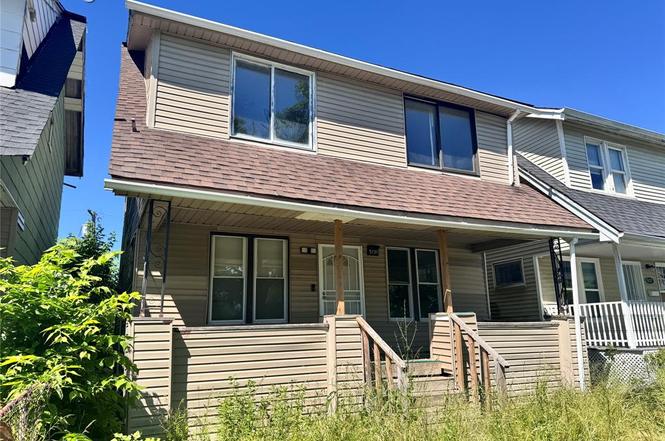
Discover a distinguished single-family residence at 5131 Saint Clair ST, Detroit, MI, USA. Constructed in 1919, this property offers a unique opportunity to own a piece of Detroit's rich architectural heritage, seamlessly blending historic charm with contemporary living potential. The residence encompasses three well-proportioned bedrooms, each providing a private retreat designed for comfort and personal expression. These spaces offer flexibility for various living arrangements, from private sleeping quarters to dedicated home offices or creative studios. For those seeking a property that offers both historical character and future potential, we invite your inquiry to schedule a private vi
Key facts
- 3,485 sq ft lot
- Built 1919
Property features AI
Exterior
- Utilities: Public water; Natural gas; Forced air heating
- Home design: Residential 2-story home; Built in 1919; Basement present
- Construction: Vinyl siding exterior; Basement foundation; Originally built in 1919
- Exterior features: Vinyl siding; Paved street frontage
Interior
- Kitchen: Kitchen on entry level (approx. 11 x 9) with laminate flooring
- Bedrooms: Three bedrooms on the second floor (approx. 11 x 11; 16 x 12; ~12); Bedrooms with carpet flooring
- Flooring: Carpet in living, dining and bedrooms; Laminate in kitchen; Ceramic in bathroom
- Bathrooms: One full bathroom on the second floor (approx. 10 x 6) with ceramic flooring
- Heating & cooling: Forced air heating; Natural gas fuel
- Interior features: 7 total rooms; Unfinished basement
Neighborhood map
What this means for you Summary
Snapshot
- This is a 3-bed/1.0-bath single-family listed at $60k.
Deal economics
- At list price, monthly cash flow is $616 ($7k/yr) — positive.
- The deal already cash-flows at list — no discount required.
- Meets the 1% rule at list price ($1k rent vs $60k).
- Cap rate 18.6% vs local median 10.2% in Detroit — top-decile yield for the area; either an underpriced asset or a hidden risk that comps aren't pricing in. Stress-test before assuming the spread holds.
Location & tenants
- Location reads 73/100 on livability (#218 in MI) — a middle-class / working-renter tenant base. Strengths: amenities A+, commute A+, cost of living A+; Watch: schools F, crime F, employment F.
- Detroit Public Schools Community District (urban): math 10% / reading 24% proficiency, ranked #499 of 540 in MI (top 92%) — low school quality limits family demand, transient renter base, plan for 1-2y turnover; 90% free/reduced lunch — lower-income household profile, screen leases tightly.
- Market conditions: 190 active listings in the ZIP; 27 comparable units currently listed for rent nearby; rentals at typical pace (median 24d on market — plan ~3-4 weeks tenant-placement turnaround); lower-income renter base — watch delinquency; 2,639 units permitted in Wayne County in 2024 (1,216 in 5+ unit buildings).
- At $1,304/mo this rent would consume 46% of the median local household income ($34k/yr) (locally 1202% of renters already pay >50% of income on rent) — very limited rent-growth headroom before tenants either downsize or default.
Forward outlook
- Local home prices are declining (-3.0%/yr); year-one equity from $415 of loan paydown is wiped out by about $2k of value loss. Plan a longer hold.
- Wayne County population projected at -17% by 2050 — secular population decline; favor cash flow + early exit over multi-decade hold.
- At projected returns (-3.0% appreciation + 3.0% rent growth), your $17k cash investment doubles in ~3 years — after that, you're playing with house money.
Negotiation context
- Only 1 days on market — expect competitive offers; lowballing is unlikely to land.
Risks & watch-outs
- Watch-outs: built in 1919 — expect roof / HVAC / electrical / plumbing capex.
Questions for the listing agent
- Built in 1919 — when were the roof, HVAC, electrical panel, plumbing, and water heater last replaced?
- Is there a deadline driving the sale (1031 exchange, divorce, estate, relocation)? That informs how much negotiation room exists.
- Schools are F-rated, which usually means shorter tenancies and higher turnover. Who's the typical renter profile here, and what's been the actual vacancy rate?
- Crime grade is F in this area — have there been break-ins, vandalism, or insurance claims at this property in the last 3 years? What carrier currently insures it and at what premium?
- What's the average days-on-market for RENTAL listings here right now (not sales)? A rising rental-DOM trend means longer vacancies and softer asking-rent achievability than the comps imply.
- What's the recent tenant-quality profile in this submarket — average credit score on applications, eviction rate, late-payment / NSF rate, and stable-employment percentage? A property-management company in the area should have these aggregated.
- How much new for-sale + rental construction is in the pipeline within 1–3 miles? Heavy new supply typically softens prices + rents 12–24 months out; constrained supply supports both.
Investment metrics
- 1% rule
- 2.17% ✓
- Cap rate
- 18.60%
- Cash-on-cash
- 43.97%
- DSCR
- 2.96
- GRM
- 3.8
CMA / ARV
- ARV (on-the-fly)
- $86,112
- Comps found
- 12
Show comp detail 12 sales within ~0.75 mi
| Address | Dist | Beds/Ba | Sqft | Sold | Price | $/sf | Match |
|---|---|---|---|---|---|---|---|
| 4472 French Rd | 0.40mi | 3/1.0 | 1,245 (-0%) | 4mo | $98,000 | $79 | 77 |
| 5855 Hurlbut St | 0.45mi | 3/1.0 | 1,296 (+4%) | 5mo | $119,900 | $93 | 68 |
| 5113 Bewick St | 0.12mi | 3/2.0 | 1,368 (+10%) | 12mo | $60,000 | $44 | 64 |
| 5832 Garland St | 0.45mi | 3/1.0 | 1,169 (-6%) | 6mo | $29,900 | $26 | 63 |
| 4533 Mcclellan St | 0.60mi | 3/1.0 | 1,194 (-4%) | 7mo | $86,000 | $72 | 59 |
| 4673 French Rd | 0.22mi | 3/1.0 | 1,060 (-15%) | 7mo | $16,500 | $16 | 59 |
| 4012 Lemay St | 0.62mi | 3/1.0 | 1,150 (-8%) | 7mo | $70,000 | $61 | 52 |
| 4046 Beniteau St | 0.68mi | 3/1.5 | 1,223 (-2%) | 15mo | $85,000 | $70 | 50 |
| 4078 Beniteau St | 0.66mi | 3/1.5 | 1,309 (+5%) | 15mo | $90,000 | $69 | 46 |
| 3789 Montclair St | 0.71mi | 3/1.0 | 1,110 (-11%) | 7mo | $32,000 | $29 | 43 |
| 5120 Belvidere St | 0.49mi | 3/2.0 | 1,098 (-12%) | 12mo | $83,500 | $76 | 43 |
| 5239 Crane St | 0.72mi | 3/1.0 | 1,404 (+12%) | 4mo | $24,500 | $17 | 42 |
Match score weights: distance 35% · size 25% · config 20% · recency 20%. Top-matched comps best support the ARV.
Projected returns pro-forma
-3.0% appreciation · 3.0% rent growth · sell at horizon
- IRR
- 40.9%
- Equity multiple
- 2.76×
- Total profit
- $29,503
- Equity at exit
- $8,946
- IRR
- 47.2%
- Equity multiple
- 5.54×
- Total profit
- $76,255
- Equity at exit
- $5,188
Cash invested: $16,800 (down + closing). Projections, not guarantees.
Landlord ↔ Tenant lean methodology
- Overall (STATE)
- 62 Landlord-Friendly
- State Michigan
- 62 Landlord-Friendly · EVEN
- County
- — inherits STATE
- City
- — inherits STATE
ZIP-level market 48213
- Active inventory
- 190
- Price-to-rent
- 3.8×
Monthly cashflow live
- Estimated rent
- $1,304 high interval (Pro) →
- Mortgage (P&I)
- −$315
- Tax est. 1.5%
- −$75 /mo · $900/yr
- Insurance
- −$25
- HOA
- −$0
- Vacancy / Maint / Mgmt
- −$274
- Net cashflow
- $616
Break-even live
UW: 25.0% down · 7.5% · 30yr · 1.5% tax · 5.0% vac · 8.0% maint · 8.0% mgmt
Financing live
Cash to close
- Down payment
- $15,000
- Closing costs
- $1,800
- Reserves months
- —
- Total cash needed
- —
Loan-product check · same deal, 3 products live
Conventional
25% down · 7.5% · 30yr
- Down + closing
- —
- Monthly P&I
- —
- Monthly cashflow
- —
- DSCR
- —
- Eligible?
- —
Personal DTI + credit; lowest rate.
DSCR
20% down · 8.5% · 30yr
- Down + closing
- —
- Monthly P&I
- —
- Monthly cashflow
- —
- DSCR
- —
- Eligible?
- —
No personal income docs; deal must DSCR.
Hard money
10% down · 12.0% · 12mo
- Down + closing
- —
- Monthly P&I
- —
- Monthly cashflow
- —
- DSCR
- —
- Eligible?
- —
Short-term bridge; refi at stabilization.
Rent comps 27 comps
| Address | Beds | Baths | Sqft | Rent | $/sqft | DOM | Units | Dist |
|---|---|---|---|---|---|---|---|---|
| 5045 Fairview St Detroit, MI | 3.0 | 1.0 | 1303 | $1,200 | $0.92 | 43d | 1 | 0.32mi |
| 5342 Cooper St Detroit, MI | 3.0 | 1.0 | 1125 | $1,200 | $1.07 | 24d | 1 | 0.36mi |
| 4487 French Rd Detroit, MI | 4.0 | 2.0 | 1280 | $1,800 | $1.41 | 43d | 1 | 0.41mi |
| 4190 Hurlbut St Unit 2 Detroit, MI | 2.0 | 1.0 | 900 | $945 | $1.05 | 15d | 1 | 0.60mi |
| 4055 Beniteau St Detroit, MI | 2.0 | 1.0 | 1000 | $900 | $0.90 | 17d | 1 | 0.67mi |
| 4735 Rohns St Unit 4A Detroit, MI | 2.0 | 1.0 | 850 | $1,000 | $1.18 | 1d | 1 | 0.71mi |
| 4735 Rohns St Unit 6A Detroit, MI | 2.0 | 1.0 | 850 | $1,100 | $1.29 | 1d | 1 | 0.71mi |
| 3937 Beniteau St Detroit, MI | 2.0 | 1.0 | 900 | $950 | $1.06 | 15d | 1 | 0.76mi |
| 3937 Beniteau St Unit 1 Detroit, MI | 2.0 | 1.0 | 1250 | $900 | $0.72 | 43d | 1 | 0.76mi |
| 8843 E Canfield St Detroit, MI | 4.0 | 2.0 | 1200 | $2,400 | $2.00 | 43d | 1 | 0.82mi |
| 3501 Garland St Detroit, MI | 2.0 | 1.0 | 1000 | $900 | $0.90 | 24d | 1 | 0.91mi |
| 3495 Garland St Detroit, MI | 2.0 | 1.0 | 1100 | $900 | $0.82 | 43d | 1 | 0.92mi |
| 5858 Seneca St Detroit, MI | 3.0 | 1.0 | 1348 | $999 | $0.74 | 17d | 1 | 0.95mi |
| 9354 Bessemore St Detroit, MI | 3.0 | 1.0 | 1125 | $1,294 | $1.15 | 17d | 1 | 1.00mi |
| 4169 Burns St Detroit, MI | 4.0 | 2.5 | 1326 | $2,300 | $1.73 | 24d | 1 | 1.02mi |
| 3049 Montclair St Unit 1 Detroit, MI | 2.0 | 1.0 | 850 | $950 | $1.12 | 43d | 1 | 1.03mi |
| 5380 Maxwell St Unit 5380 Detroit, MI | 2.0 | 1.0 | 1100 | $900 | $0.82 | 17d | 1 | 1.04mi |
| 3032 Hurlbut St Unit 1 Detroit, MI | 2.0 | 1.0 | 950 | $900 | $0.95 | 3d | 1 | 1.09mi |
| 3475 Crane St Detroit, MI | 3.0 | 1.5 | 1000 | $1,338 | $1.34 | 43d | 1 | 1.18mi |
| 9142 Isham Detroit, MI | 3.0 | 1.0 | 1000 | $1,344 | $1.34 | 17d | 1 | 1.19mi |
| 4811 Seyburn St Detroit, MI | 3.0 | 1.0 | 1196 | $1,037 | $0.87 | 17d | 1 | 1.26mi |
| 2544 Cadillac Blvd Unit 2 Detroit, MI | 2.0 | 1.0 | 973 | $825 | $0.85 | 24d | 1 | 1.33mi |
| 12210 Longview St Detroit, MI | 3.0 | 1.0 | 1020 | $1,100 | $1.08 | 43d | 1 | 1.42mi |
| 8215 Badger St Detroit, MI | 2.0 | 1.0 | 1000 | $1,000 | $1.00 | 15d | 1 | 1.42mi |
| 15111 E Vernor Hwy Unit 6 Detroit, MI | 2.0 | 1.0 | 900 | $1,200 | $1.33 | 24d | 1 | 1.43mi |
| 2282 Belvidere St Unit 102 Detroit, MI | 2.0 | 2.0 | 1000 | $1,250 | $1.25 | 43d | 1 | 1.45mi |
| 12051 Wilshire Dr Detroit, MI | 3.0 | 1.5 | 1224 | $1,250 | $1.02 | 17d | 1 | 1.48mi |
Listing history 4 events
-
2026-06-18statusdays on market $60,000 Active 1 DOM
-
2026-06-17days on market $60,000 Coming Soon 2 DOM
-
2026-06-15remarks 699-char remark
-
2026-06-15$60,000 Coming Soon 1 DOM
ⓘ Source: listings_history table (triggers on properties + properties_extension) + one-shot
backfill from property_details.listing_events for pre-trigger history.
Climate risk First Street
- Flood 4/10 Moderate FEMA zone X (unshaded) · 22% chance over 30 yrs
- Wildfire 1/10 Low
- Heat 3/10 Moderate 7 d/yr ≥96°F today · 15 d/yr by 30 yrs out
- Wind 2/10 Low
- Air quality 3/10 Moderate 2 unhealthy d/yr today · 5 by 30 yrs out
Nearby sold comps map
Loading sold comps map…
Walkable amenities ~0.75 mi
Loading nearby amenities…
Taxation est. · year 1
- Rental income
- $15,649
- − Mortgage interest
- −$3,361
- − Property taxes
- −$900
- − Insurance
- −$300
- − Repairs & maintenance
- −$1,252
- − Management
- −$1,252
- − Depreciation
- −$1,745
- Taxable income
- $6,839
- Est. tax owed @ 24.0%
- −$1,641
- After-tax cash flow
- $5,746/yr
For passive investors: Depreciation is non-cash, so a rental often shows a tax loss while cash-flowing — sheltering income. Rental losses are passive: they offset passive income freely, and up to $25,000/yr can offset ordinary (W-2) income if you actively participate and your MAGI is under $100k (phasing out to $0 by $150k); unused losses carry forward. On sale, claimed depreciation is recaptured at up to 25%, and gains may owe capital-gains tax (a 1031 exchange can defer both). Figures are a year-1 estimate at your 24.0% rate — not tax advice; consult a CPA.
Schools (NCES district)
- District
- Detroit Public Schools Community District
- NCES district ID
- 2601103
- Math proficiency
- 10% ▼ -2.00%
- Reading proficiency
- 24% ▲ 6.00%
- Median HH income
- $25,815
- Composite
- 13.06/100
- National rank
- #9564
- State rank
- #499 of 540 in MI
Livability — Detroit
- Score
- 73/100
- State rank
- #218
- US rank
- #5427
Category grades
Schools grade is shown separately in the Schools card above.
Census & demographics
- Census place
- Detroit, MI
- County
- Wayne County · 1,562,939 people
- City population
- 572,865
- Metro
- Detroit-Warren-Dearborn, MI
- Population (ZIP)
- 20,075
- Household income
- $34,003
- Rent vs Own
- Severe rent burden
- 1202.0
Population outlook (Wayne County) Hauer SSP2
- Today (2025)
- 1,675,273 people
- By 2030
- 1,620,300 · -3.3%
- By 2040
- 1,502,341 · -10.3%
- By 2050
- 1,384,039 · -17.4%
- By 2075
- 1,124,592 · -32.9%
- By 2100
- 881,193 · -47.4%
Race, ethnicity, and origin ACS 2023
- Neighborhood character
- Predominantly Black (92%)
- Race & ethnicity
- Black 92% White 4% Hispanic / Latino 2% Two or more races 1%
- Common ancestry
- Slovak 1%
- Foreign-born
- 2% · Canada
- Languages at home
- 97% English-only · Arabic 1% Spanish 1%
Political lean MEDSL · Wayne
- 2024 margin
- Strong D (+29.0) · D 62.7% · R 33.7% · Other 3.6%
- 2008→2024 swing
- -20.5pp toward R · 2008: 49.5pp · 2024: 29.0pp
- All cycles
- 2024: D+29.0 2020: D+38.1 2016: D+37.3 2012: D+46.9 2008: D+49.5
Not yet ingested
- Civics
- —
Market trends
- HPI YoY
- ▼ -122.86%
- Current HPI
- 217.2037
- Rent YoY
- —
- Metro
- Detroit-Warren-Dearborn, MI
- State GDP YoY
- ▲ 1.37%
- F500 in state
- 28
Industry mix (Fortune 500 HQ in MI)
| Industry | F500 HQs | Revenue |
|---|---|---|
| Automotive Parts | 3 | $48B |
|
||
| Automotive | 2 | $372B |
|
||
| Chemicals | 1 | $45B |
|
||
| Automotive Retail | 1 | $29B |
|
||
| Healthcare / Medical Devices | 1 | $23B |
|
||
| Automotive Technology | 1 | $20B |
|
||
Price history
1 event — show timeline
- 2026-06-15 Coming Soon $60,000 MiRealSource-MiMLS
Property tax history
-16.8%/yrLatest (2025): $67 · +0.0% YoY. Source: county tax records.
Cash-flow waterfall
monthlySold comps — $/sqft
last 12 mo · ≤1 miLoading sold comps…