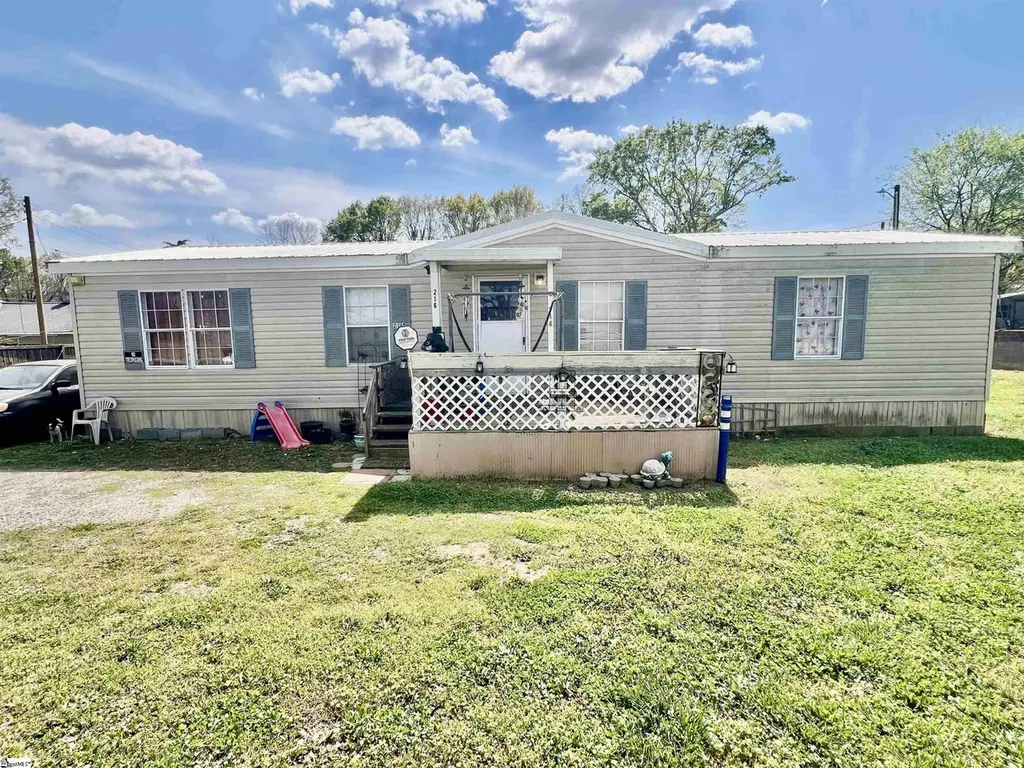
216 Pearman St · Homeland Park, SC
Flood risk 1/10 · Minimal
- FEMA flood zone
- X (unshaded)
- Chance of flooding over 30 yrs
- 0.0%
- Est. flood insurance / yr
- $507 – $1,088
Fire risk 4/10 · Minor
- Est. fire insurance / yr
- $783 – $1,453
Heat risk 5/10 · Moderate
- Hot days now (above 105°F)
- 7 days/yr
- Hot days in 30 yrs
- 16 days/yr
Wind risk 3/10 · Minor
- Chance of severe wind over 30 yrs
- 8.0%
Air-quality risk 3/10 · Minor
- Unhealthy air days now
- 3 days/yr
- Unhealthy air days in 30 yrs
- 3 days/yr
Risk factors via First Street. Map © Google.
Why this score? — see what drove the A- grade
The composite is a weighted blend of 9 inputs, each scored 0–100. Each bar is that input's sub-score; the figure is the points it added to the 100-point composite (weight × sub-score).
- Cash flow +30.0/30.0
- ARV discount +15.0/15.0
- 1% rule +10.0/10.0
- DSCR +10.0/10.0
- Appreciation +5.0/10.0
- Schools +3.9/10.0
- Livability +2.8/5.0
- Rent growth +2.5/5.0
- Condition / age +2.5/5.0
$84,500
🖨 Deal sheet 📄 Offer letter ✓ Due diligence
Listing remarks MLS
Three bedrooms Two baths, Great for a rental, Needs some work, This is a Fannie Mae . First 16 days owner occupant only.
Key facts
- Manageable lot
- New hvac
- Outdoor space
Tags
Property features AI
Finance
- HOA & community: No HOA fees or community amenities listed
Exterior
- Parking: Driveway parking (gravel); No garage
- Utilities: Public water; Public sewer; Electric water heater; No garbage pickup listed
- Home design: Single-story residential home; Approximately 21–30 years old; Lot roughly 1/2 acre or less; Approximate lot dimensions listed as 0.19
- Construction: Metal roof; Vinyl siding; Crawl space foundation
- Exterior features: Porch (other); Level lot
Interior
- Kitchen: Refrigerator; Electric cooktop
- Bedrooms: Primary bedroom with full bath and walk-in closet (main level); Two additional bedrooms (main level) — approx. 10 x 12 each; Primary bedroom approx. 13 x 13
- Flooring: Carpet; Vinyl
- Bathrooms: Two full bathrooms (both on main level)
- Heating & cooling: Electric heating; Electric cooling
- Interior features: 9-foot+ ceilings; Non-standard countertops
- Laundry & utility: Laundry on first floor
Neighborhood map
What this means for you Summary
Snapshot
- This is a 3-bed/2.0-bath manufactured listed at $84k.
Deal economics
- At list price, monthly cash flow is $585 ($7k/yr) — positive.
- The deal already cash-flows at list — no discount required.
- Meets the 1% rule at list price ($1k rent vs $84k).
- Recommended offer: $82k (3.0% below list) — sets the bar for market timing.
Location & tenants
- Location reads 56/100 on livability (#299 in SC) — a working-class tenant base; expect higher turnover. Strengths: cost of living A+, housing A-; Watch: health & safety C-, crime F, amenities F.
- Anderson 05 (suburban): math 44% / reading 49% proficiency, ranked #20 of 80 in SC (top 25%) — families likely to look elsewhere, expect single-tenant / working-renter base with shorter leases.
- Zoned schools: Varennes Elementary (math 18% / reading 18%, grade F, #508 of 597 statewide, top 86%, 370 students, 100% FRL) — zoned schools average 100% FRL vs 52% district-wide (48 pts higher); higher-poverty schools than district average — tighter screening recommended.
- Zoned-school proficiency averages 18% at this address vs 46% district-wide (-28 pts) — the specific schools serving this property underperform the Anderson 05 average; the district grade overstates school quality for this exact location.
- Market conditions: 1 active listings in the ZIP; 2 comparable units currently listed for rent nearby; 1,255 units permitted in Anderson County in 2024 (0 in 5+ unit buildings).
Forward outlook
- In year one you build about $3k of equity ($584 loan paydown + $3k appreciation (3.0% local appreciation)).
- Anderson County population projected at +14% by 2050 — modest demand growth; plan on rents tracking national, not racing it.
- At projected returns (3.0% appreciation + 3.0% rent growth), your $24k cash investment doubles in ~3 years — after that, you're playing with house money.
- By year 10, paydown + projected appreciation supports a ~$30k cash-out refi (75% LTV) — recoverable capital for the next deal without selling this one.
Negotiation context
- It's been on market 39 days — a 3% lower offer ($82k) is reasonable based on typical stale-listing flexibility.
- 2 sale attempts since 14y ago; this cycle's ask has dropped $14k (15%) from the opening price — seller is motivated, your offer sets the floor, not the list.
- Current owner paid $25k; list at $84k implies a 239% gain — meaningful room to come down on a strong offer.
Risks & watch-outs
- Climate carrying-cost: extreme-heat days projected 7→16/yr by 2055 (HVAC capex compounding) — expect insurance premiums to compound above CPI over the hold.
Questions for the listing agent
- It's been on market 39 days. Have you received any prior offers? Is the seller open to a 3% concession, seller financing, or rate buy-down credit?
- Is there a deadline driving the sale (1031 exchange, divorce, estate, relocation)? That informs how much negotiation room exists.
- Schools are F-rated, which usually means shorter tenancies and higher turnover. Who's the typical renter profile here, and what's been the actual vacancy rate?
- Crime grade is F in this area — have there been break-ins, vandalism, or insurance claims at this property in the last 3 years? What carrier currently insures it and at what premium?
- What's the average days-on-market for RENTAL listings here right now (not sales)? A rising rental-DOM trend means longer vacancies and softer asking-rent achievability than the comps imply.
- What's the recent tenant-quality profile in this submarket — average credit score on applications, eviction rate, late-payment / NSF rate, and stable-employment percentage? A property-management company in the area should have these aggregated.
- How much new for-sale + rental construction is in the pipeline within 1–3 miles? Heavy new supply typically softens prices + rents 12–24 months out; constrained supply supports both.
Investment metrics
- 1% rule
- 1.62% ✓
- Cap rate
- 14.60%
- Cash-on-cash
- 29.65%
- DSCR
- 2.32
- GRM
- 5.1
CMA / ARV
- ARV (on-the-fly)
- $149,314
- Comps found
- 4
Show comp detail 4 sales within ~0.75 mi
| Address | Dist | Beds/Ba | Sqft | Sold | Price | $/sf | Match |
|---|---|---|---|---|---|---|---|
| 216 Pearman St | 0.00mi | 3/2.0 | 1,200 (-3%) | 1mo | $82,000 | $68 | 95 |
| 109 Cheek St | 0.20mi | 3/2.0 | 1,240 (+0%) | 14mo | $159,900 | $129 | 78 |
| 221 Corning St | 0.59mi | 3/2.0 | 1,242 (+1%) | 11mo | $149,900 | $121 | 62 |
| 55 Lemans Dr | 0.74mi | 2/2.0 (-1) | 1,100 (-11%) | 0mo | $43,500 | $40 | 42 |
Match score weights: distance 35% · size 25% · config 20% · recency 20%. Top-matched comps best support the ARV.
Projected returns pro-forma
3.0% appreciation · 3.0% rent growth · sell at horizon
- IRR
- 35.5%
- Equity multiple
- 3.00×
- Total profit
- $47,386
- Equity at exit
- $37,995
- IRR
- 35.6%
- Equity multiple
- 5.92×
- Total profit
- $116,471
- Equity at exit
- $58,555
Cash invested: $23,660 (down + closing). Projections, not guarantees.
Landlord ↔ Tenant lean methodology
- Overall (STATE)
- 90 Strongly Landlord-Friendly
- State South Carolina
- 90 Strongly Landlord-Friendly · R+6
- County
- — inherits STATE
- City
- — inherits STATE
ZIP-level market 26921
- Active inventory
- 1
- Price-to-rent
- 5.1×
Monthly cashflow live
- Estimated rent
- $1,372 medium interval (Pro) →
- Mortgage (P&I)
- −$443
- Tax from tax record
- −$21 /mo · $248/yr
- Insurance
- −$35
- HOA
- −$0
- Vacancy / Maint / Mgmt
- −$288
- Net cashflow
- $585
Break-even live
UW: 25.0% down · 7.5% · 30yr · 1.5% tax · 5.0% vac · 8.0% maint · 8.0% mgmt
Financing live
Cash to close
- Down payment
- $21,125
- Closing costs
- $2,535
- Reserves months
- —
- Total cash needed
- —
Loan-product check · same deal, 3 products live
Conventional
25% down · 7.5% · 30yr
- Down + closing
- —
- Monthly P&I
- —
- Monthly cashflow
- —
- DSCR
- —
- Eligible?
- —
Personal DTI + credit; lowest rate.
DSCR
20% down · 8.5% · 30yr
- Down + closing
- —
- Monthly P&I
- —
- Monthly cashflow
- —
- DSCR
- —
- Eligible?
- —
No personal income docs; deal must DSCR.
Hard money
10% down · 12.0% · 12mo
- Down + closing
- —
- Monthly P&I
- —
- Monthly cashflow
- —
- DSCR
- —
- Eligible?
- —
Short-term bridge; refi at stabilization.
Rent comps 2 comps
| Address | Beds | Baths | Sqft | Rent | $/sqft | DOM | Units | Dist |
|---|---|---|---|---|---|---|---|---|
| 203B Cromer Rd Anderson, SC | 2.0 | 1.5 | 1000 | $1,395 | $1.40 | 2d | 1 | 0.16mi |
| 109 Corning St Unit A Anderson, SC | 2.0 | 2.0 | 1250 | $1,300 | $1.04 | 10d | 1 | 0.60mi |
Listing history 9 events
-
2026-05-03status Pending
-
2026-04-20price $84,500
-
2026-04-14price $89,900
-
2026-04-04price $94,000
-
2026-03-24$99,000 Active
-
2012-12-11soldstatus $24,900
-
2012-09-07soldstatus $11,000 120-char remark
Show marketing remark (120 chars)
Three bedrooms Two baths, Great for a rental, Needs some work, This is a Fannie Mae . First 16 days owner occupant only.
-
2012-07-23$20,900 120-char remark
Show marketing remark (120 chars)
Three bedrooms Two baths, Great for a rental, Needs some work, This is a Fannie Mae . First 16 days owner occupant only.
-
2002-11-22soldstatus $49,500
ⓘ Source: listings_history table (triggers on properties + properties_extension) + one-shot
backfill from property_details.listing_events for pre-trigger history.
Tax reassessment forecast SC · Resets to sale price
- Current annual tax
- $248 · $21/mo
- Projected year-2 tax
- $482 · $40/mo
- Expected delta
- +$233/yr (+$19/mo · 94.1%)
ⓘ Screening estimate from a state-policy table — verify with the county assessor before closing.
Climate risk First Street
- Flood 1/10 Low FEMA zone X (unshaded) · 0% chance over 30 yrs
- Wildfire 4/10 Moderate
- Heat 5/10 Major 7 d/yr ≥105°F today · 16 d/yr by 30 yrs out
- Wind 3/10 Moderate 8% chance of damaging wind over 30 yrs
- Air quality 3/10 Moderate 3 unhealthy d/yr today · 3 by 30 yrs out
Nearby sold comps map
Loading sold comps map…
Walkable amenities ~0.75 mi
Loading nearby amenities…
Taxation est. · year 1
- Rental income
- $16,461
- − Mortgage interest
- −$4,733
- − Property taxes
- −$248
- − Insurance
- −$422
- − Repairs & maintenance
- −$1,317
- − Management
- −$1,317
- − Depreciation
- −$2,458
- Taxable income
- $5,965
- Est. tax owed @ 24.0%
- −$1,432
- After-tax cash flow
- $5,584/yr
For passive investors: Depreciation is non-cash, so a rental often shows a tax loss while cash-flowing — sheltering income. Rental losses are passive: they offset passive income freely, and up to $25,000/yr can offset ordinary (W-2) income if you actively participate and your MAGI is under $100k (phasing out to $0 by $150k); unused losses carry forward. On sale, claimed depreciation is recaptured at up to 25%, and gains may owe capital-gains tax (a 1031 exchange can defer both). Figures are a year-1 estimate at your 24.0% rate — not tax advice; consult a CPA.
Schools (NCES district)
- District
- Anderson 05
- NCES district ID
- 4500900
- Math proficiency
- 44% ▼ -4.00%
- Reading proficiency
- 49% ▲ 2.00%
- Median HH income
- $39,718
- Composite
- 38.89/100
- National rank
- #4098
- State rank
- #20 of 80 in SC
Livability — Homeland Park
- Score
- 56/100
- State rank
- #299
- US rank
- #23092
Category grades
Schools grade is shown separately in the Schools card above.
Census & demographics
- Census place
- Homeland Park, SC
Population outlook (Anderson County) Hauer SSP2
- Today (2025)
- 210,546 people
- By 2030
- 217,791 · +3.4%
- By 2040
- 230,643 · +9.5%
- By 2050
- 240,220 · +14.1%
- By 2075
- 259,518 · +23.3%
- By 2100
- 258,696 · +22.9%
Not yet ingested
- Political lean
- —
- Race & ethnicity
- —
- Common origin
- —
- Civics
- —
Market trends
- HPI YoY
- —
- Current HPI
- —
- Rent YoY
- —
- Metro
- —
- State GDP YoY
- ▲ 4.51%
- F500 in state
- 2
Industry mix (Fortune 500 HQ in SC)
| Industry | F500 HQs | Revenue |
|---|---|---|
| Packaging | 1 | $7B |
|
||
Price history
+70.7% since first listed9 events — show timeline
- 2026-05-03 Pending — Greater Greenville MLS
- 2026-04-20 Price Changed $84,500 Greater Greenville MLS
- 2026-04-14 Price Changed $89,900 Greater Greenville MLS
- 2026-04-04 Price Changed $94,000 Greater Greenville MLS
- 2026-03-24 Listed $99,000 Greater Greenville MLS
- 2012-12-11 Sold (Public Records) $24,900 Public Records
- 2012-09-07 Sold (MLS) $11,000 WUMLS
- 2012-07-23 Listed $20,900 WUMLS
- 2002-11-22 Sold (Public Records) $49,500 Public Records
Property tax history
+2.6%/yrLatest (2025): $248 · +15.7% YoY. Source: county tax records.
Cash-flow waterfall
monthlySold comps — $/sqft
last 12 mo · ≤1 miLoading sold comps…