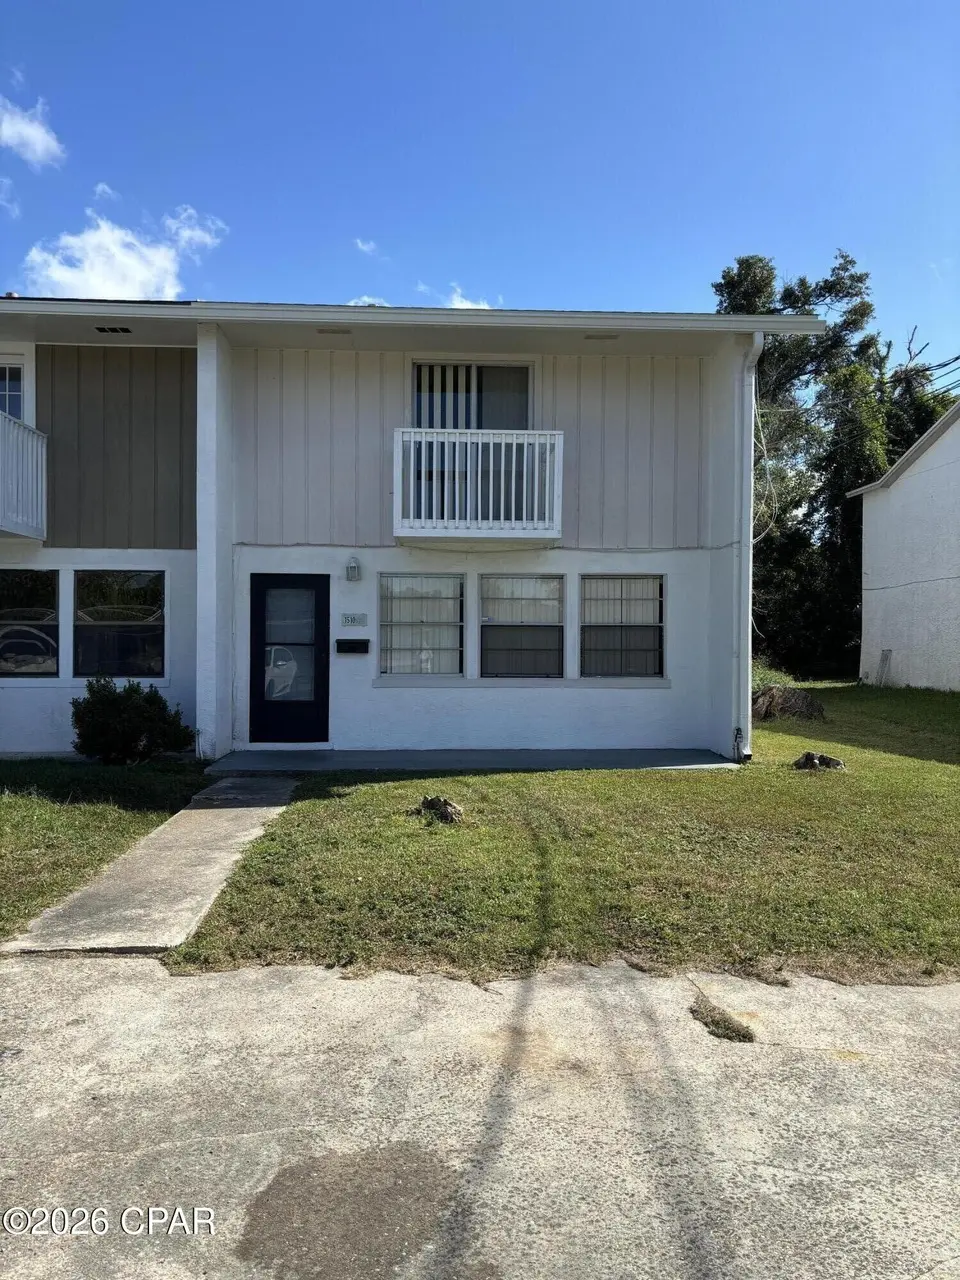
1510 Clay Ave Unit A · Panama City, FL
Flood risk 1/10 · Minimal
- FEMA flood zone
- X (unshaded)
- Chance of flooding over 30 yrs
- 0.0%
- Est. flood insurance / yr
- $507 – $1,088
Fire risk 1/10 · Minimal
- Est. fire insurance / yr
- $947 – $1,759
Heat risk 10/10 · Severe
- Hot days now (above 106°F)
- 7 days/yr
- Hot days in 30 yrs
- 22 days/yr
Wind risk 9/10 · Severe
- Chance of severe wind over 30 yrs
- 99.0%
Air-quality risk 1/10 · Minimal
- Unhealthy air days now
- 0 days/yr
- Unhealthy air days in 30 yrs
- 0 days/yr
Risk factors via First Street. Map © Google.
Why this score? — see what drove the B grade
The composite is a weighted blend of 9 inputs, each scored 0–100. Each bar is that input's sub-score; the figure is the points it added to the 100-point composite (weight × sub-score).
- Cash flow +26.4/30.0
- ARV discount +15.0/15.0
- DSCR +9.0/10.0
- 1% rule +7.3/10.0
- Schools +4.3/10.0
- Livability +3.6/5.0
- Rent growth +2.8/5.0
- Condition / age +2.5/5.0
- Appreciation +0.0/10.0
$137,500
🖨 Deal sheet 📄 Offer letter ✓ Due diligence
Listing remarks MLS
Move-in ready and affordably priced, this is the one you've been waiting for! Conveniently located near shopping, dining, schools, colleges, and the hospital, with the beach just a short 15-minute drive away. This 3-bedroom, 1.5-bath townhome is ready for its next owner. Downstairs features a spacious living room with large windows that bring in plenty of natural light, along with a kitchen and dining area with sliding glass doors leading to the back porch and yard. A half bath downstairs adds extra convenience. Upstairs, you'll find all three bedrooms and a full bathroom. Major updates include a 2020 HVAC system, 2020 roof, and 2020 water heater, as well as new windows upstairs and fresh paint, giving added peace of mind. Whether you're looking for a primary residence, investment property, or starter home, this one is worth a look!
Key facts
- Near schools
- Near dining
- Near shopping
Tags
Neighborhood map
What this means for you Summary
Snapshot
- This is a 3-bed/2.0-bath single-family listed at $138k.
Deal economics
- At list price, monthly cash flow is $361 ($4k/yr) — positive.
- The deal already cash-flows at list — no discount required.
- Meets the 1% rule at list price ($2k rent vs $138k).
- Cap rate 9.4% vs local median 4.7% in Panama City — top-decile yield for the area; either an underpriced asset or a hidden risk that comps aren't pricing in. Stress-test before assuming the spread holds.
Location & tenants
- Location reads 72/100 on livability (#350 in FL) — a middle-class / working-renter tenant base. Strengths: cost of living A+, housing A+, health & safety A+; Watch: crime F, amenities F, commute F.
- Bay (suburban): math 51% / reading 51% proficiency, ranked #29 of 73 in FL (top 40%) — acceptable for families but not a draw, mixed tenant base, ~2y average lease.
- Market conditions: Rents rising (+1.2%/yr); 381 active listings in the ZIP; 11 comparable units currently listed for rent nearby; rentals at typical pace (median 21d on market — plan ~3-4 weeks tenant-placement turnaround); 2,473 units permitted in Bay County in 2024 (559 in 5+ unit buildings).
Forward outlook
- Local home prices are declining (-3.0%/yr); year-one equity from $951 of loan paydown is wiped out by about $4k of value loss. Plan a longer hold.
- Bay County population projected at +24% by 2050 — long-run rental-demand tailwind backs the buy-and-hold thesis.
Negotiation context
- Only 3 days on market — expect competitive offers; lowballing is unlikely to land.
- 6 sale attempts since 18y ago with the ask held roughly flat each time — persistent listings suggest the price (not the market) is what's stuck; bring a comps-based counter.
- Current owner paid $105k; 31% above their basis — modest negotiation headroom, anchor on the comps not their cost.
Risks & watch-outs
- Climate carrying-cost: severe wind risk, 99% chance of damaging wind over 30y; extreme-heat days projected 7→22/yr by 2055 (HVAC capex compounding) — expect insurance premiums to compound above CPI over the hold.
Questions for the listing agent
- Built in 1971 — when were the roof, HVAC, electrical panel, plumbing, and water heater last replaced?
- Is there a deadline driving the sale (1031 exchange, divorce, estate, relocation)? That informs how much negotiation room exists.
- Schools are B-rated — typically a magnet for longer-tenancy family renters. What's the average tenant stay here, and is there a school-zone premium baked into asking?
- Crime grade is F in this area — have there been break-ins, vandalism, or insurance claims at this property in the last 3 years? What carrier currently insures it and at what premium?
- What's the average days-on-market for RENTAL listings here right now (not sales)? A rising rental-DOM trend means longer vacancies and softer asking-rent achievability than the comps imply.
- What's the recent tenant-quality profile in this submarket — average credit score on applications, eviction rate, late-payment / NSF rate, and stable-employment percentage? A property-management company in the area should have these aggregated.
- How much new for-sale + rental construction is in the pipeline within 1–3 miles? Heavy new supply typically softens prices + rents 12–24 months out; constrained supply supports both.
Investment metrics
- 1% rule
- 1.23% ✓
- Cap rate
- 9.44%
- Cash-on-cash
- 11.25%
- DSCR
- 1.50
- GRM
- 6.8
CMA / ARV
- ARV (on-the-fly)
- $224,010
- Comps found
- 7
Show comp detail 7 sales within ~0.75 mi
| Address | Dist | Beds/Ba | Sqft | Sold | Price | $/sf | Match |
|---|---|---|---|---|---|---|---|
| 1619 Lincoln Ave | 0.18mi | 3/1.5 | 1,143 (-3%) | 13mo | $238,000 | $208 | 74 |
| 1303 Fairy Ave | 0.55mi | 3/2.0 | 1,200 (+2%) | 22mo | $279,000 | $233 | 53 |
| 1712 Wilmont Ave | 0.45mi | 3/1.0 | 1,211 (+3%) | 22mo | $230,000 | $190 | 52 |
| 1903 Arthur Ave | 0.48mi | 3/1.0 | 1,069 (-9%) | 13mo | $185,000 | $173 | 47 |
| 2209 W 21st St | 0.69mi | 3/2.0 | 1,240 (+5%) | 19mo | $269,900 | $218 | 43 |
| 1711 Wilmont Ave Unit 1/2 | 0.48mi | 3/2.0 | 1,040 (-12%) | 21mo | $180,000 | $173 | 41 |
| 1903 Chestnut Ave | 0.65mi | 3/2.0 | 1,300 (+10%) | 18mo | $180,000 | $138 | 38 |
Match score weights: distance 35% · size 25% · config 20% · recency 20%. Top-matched comps best support the ARV.
Projected returns pro-forma
-3.0% appreciation · 1.24% rent growth · sell at horizon
- IRR
- -1.5%
- Equity multiple
- 0.94×
- Total profit
- $-2,185
- Equity at exit
- $20,502
- IRR
- 6.2%
- Equity multiple
- 1.42×
- Total profit
- $16,231
- Equity at exit
- $11,888
Cash invested: $38,500 (down + closing). Projections, not guarantees.
Landlord ↔ Tenant lean methodology
- Overall (STATE)
- 87 Strongly Landlord-Friendly
- State Florida
- 87 Strongly Landlord-Friendly · R+3
- County
- — inherits STATE
- City
- — inherits STATE
ZIP-level market 32405
- Rents YoY
- 1.2%
- Active inventory
- 381
- Price-to-rent
- 6.8×
Monthly cashflow live
- Estimated rent
- $1,688 high interval (Pro) →
- Mortgage (P&I)
- −$721
- Tax from tax record
- −$194 /mo · $2,328/yr
- Insurance
- −$57
- HOA
- −$0
- Vacancy / Maint / Mgmt
- −$354
- Net cashflow
- $361
Break-even live
UW: 25.0% down · 7.5% · 30yr · 1.5% tax · 5.0% vac · 8.0% maint · 8.0% mgmt
Financing live
Cash to close
- Down payment
- $34,375
- Closing costs
- $4,125
- Reserves months
- —
- Total cash needed
- —
Loan-product check · same deal, 3 products live
Conventional
25% down · 7.5% · 30yr
- Down + closing
- —
- Monthly P&I
- —
- Monthly cashflow
- —
- DSCR
- —
- Eligible?
- —
Personal DTI + credit; lowest rate.
DSCR
20% down · 8.5% · 30yr
- Down + closing
- —
- Monthly P&I
- —
- Monthly cashflow
- —
- DSCR
- —
- Eligible?
- —
No personal income docs; deal must DSCR.
Hard money
10% down · 12.0% · 12mo
- Down + closing
- —
- Monthly P&I
- —
- Monthly cashflow
- —
- DSCR
- —
- Eligible?
- —
Short-term bridge; refi at stabilization.
Rent comps 11 comps
| Address | Beds | Baths | Sqft | Rent | $/sqft | DOM | Units | Dist |
|---|---|---|---|---|---|---|---|---|
| 1301 Frankford Ave Apt B104 Panama City, FL | 2.0 | 1.0 | 780 | $1,000 | $1.28 | 13d | 1 | 0.27mi |
| 1804 Arthur Ave Panama City, FL | 3.0 | 1.5 | 1044 | $1,795 | $1.72 | 20d | 1 | 0.39mi |
| 1710 Drake Ave Panama City, FL | 3.0 | 2.0 | 1130 | $1,850 | $1.64 | 20d | 1 | 0.42mi |
| 2602 W 12th St Panama City, FL | 3.0 | 2.0 | 1400 | $2,095 | $1.50 | 20d | 1 | 0.49mi |
| 2100 W Beach Dr Unit F102 Panama City, FL | 2.0 | 1.0 | 970 | $1,700 | $1.75 | 20d | 1 | 0.71mi |
| 1827 Balboa Ave Panama City, FL | 3.0 | 2.5 | 1440 | $1,800 | $1.25 | 13d | 1 | 1.12mi |
| 3722 Burnham Way Panama City, FL | 3.0 | 2.0 | 1040 | $1,600 | $1.54 | 20d | 1 | 1.18mi |
| 901 W 19th St Panama City, FL | 1.0–2.0 | 1.0–2.0 | 787 | $1,168 | $1.48 | 20d | 5 | 1.23mi |
| 1913 Laurel Ave Unit A Panama City, FL | 2.0 | 2.5 | 1238 | $1,725 | $1.39 | 13d | 1 | 1.37mi |
| 723 W 19th St Panama City, FL | 2.0 | 2.0 | 1170 | $1,520 | $1.30 | 20d | 15 | 1.44mi |
| 4105 W 22nd St Unit 4105 Panama City, FL | 3.0 | 2.0 | 1000 | $1,395 | $1.40 | 20d | 1 | 1.47mi |
Listing history 11 events
-
2026-05-20$137,500 Active 844-char remark
Show marketing remark (844 chars)
Move-in ready and affordably priced, this is the one you've been waiting for! Conveniently located near shopping, dining, schools, colleges, and the hospital, with the beach just a short 15-minute drive away. This 3-bedroom, 1.5-bath townhome is ready for its next owner. Downstairs features a spacious living room with large windows that bring in plenty of natural light, along with a kitchen and dining area with sliding glass doors leading to the back porch and yard. A half bath downstairs adds extra convenience. Upstairs, you'll find all three bedrooms and a full bathroom. Major updates include a 2020 HVAC system, 2020 roof, and 2020 water heater, as well as new windows upstairs and fresh paint, giving added peace of mind. Whether you're looking for a primary residence, investment property, or starter home, this one is worth a look!
-
2026-04-16$1,375
-
2024-11-15historical $1,350
-
2024-11-07$1,350
-
2021-12-09historical
-
2020-10-05soldstatus $105,000
-
2020-03-17$110,000
-
2013-10-08soldstatus $42,000
-
2013-08-07$45,900
-
2008-01-30$170,000
-
2001-09-04soldstatus $54,000
ⓘ Source: listings_history table (triggers on properties + properties_extension) + one-shot
backfill from property_details.listing_events for pre-trigger history.
Tax reassessment forecast FL · Resets to sale price
- Current annual tax
- $2,328 · $194/mo
- Projected year-2 tax
- $2,328 · $194/mo
- Expected delta
- $0/yr ($0/mo · 0.0%)
ⓘ Screening estimate from a state-policy table — verify with the county assessor before closing.
Climate risk First Street
- Flood 1/10 Low FEMA zone X (unshaded) · 0% chance over 30 yrs
- Wildfire 1/10 Low
- Heat 10/10 Extreme 7 d/yr ≥106°F today · 22 d/yr by 30 yrs out
- Wind 9/10 Extreme 99% chance of damaging wind over 30 yrs
- Air quality 1/10 Low 0 unhealthy d/yr today · 0 by 30 yrs out
Nearby sold comps map
Loading sold comps map…
Walkable amenities ~0.75 mi
Loading nearby amenities…
Taxation est. · year 1
- Rental income
- $20,254
- − Mortgage interest
- −$7,702
- − Property taxes
- −$2,328
- − Insurance
- −$688
- − Repairs & maintenance
- −$1,620
- − Management
- −$1,620
- − Depreciation
- −$4,000
- Taxable income
- $2,296
- Est. tax owed @ 24.0%
- −$551
- After-tax cash flow
- $3,781/yr
For passive investors: Depreciation is non-cash, so a rental often shows a tax loss while cash-flowing — sheltering income. Rental losses are passive: they offset passive income freely, and up to $25,000/yr can offset ordinary (W-2) income if you actively participate and your MAGI is under $100k (phasing out to $0 by $150k); unused losses carry forward. On sale, claimed depreciation is recaptured at up to 25%, and gains may owe capital-gains tax (a 1031 exchange can defer both). Figures are a year-1 estimate at your 24.0% rate — not tax advice; consult a CPA.
Schools (NCES district)
- District
- Bay
- NCES district ID
- 1200090
- Math proficiency
- 51% ▼ -8.00%
- Reading proficiency
- 51% ▼ -7.00%
- Median HH income
- $47,740
- Composite
- 43.41/100
- National rank
- #3014
- State rank
- #29 of 73 in FL
Livability — Panama City
- Score
- 72/100
- State rank
- #350
- US rank
- #5823
Category grades
Schools grade is shown separately in the Schools card above.
Census & demographics
- Census place
- Panama City, FL
- County
- Bay County · 163,593 people
- City population
- 91,445
- Metro
- Panama City, FL
- Population (ZIP)
- 29,984
- Household income
- $73,373
- Rent vs Own
- Severe rent burden
- 1008.0
Population outlook (Bay County) Hauer SSP2
- Today (2025)
- 206,264 people
- By 2030
- 217,740 · +5.6%
- By 2040
- 238,738 · +15.7%
- By 2050
- 255,545 · +23.9%
- By 2075
- 288,295 · +39.8%
- By 2100
- 288,638 · +39.9%
Race, ethnicity, and origin ACS 2023
- Neighborhood character
- Predominantly White (67%)
- Race & ethnicity
- White 67% Black 17% Two or more races 8% Hispanic / Latino 7% Native American 1%
- Hispanic origin (detail)
- Mexican 2% Puerto Rican 3%
- Common ancestry
- Slovak 4% Lithuanian 2% Romanian 2%
- Foreign-born
- 7% · Canada
- Languages at home
- 89% English-only · Spanish 6% Arabic 1% French/Haitian/Cajun 1%
Political lean MEDSL · Bay
- 2024 margin
- Solid R (+47.4) · D 25.8% · R 73.1% · Other 1.1%
- 2008→2024 swing
- -6.6pp toward R · 2008: -40.7pp · 2024: -47.4pp
- All cycles
- 2024: R+47.4 2020: R+43.5 2016: R+46.3 2012: R+43.6 2008: R+40.7
Not yet ingested
- Civics
- —
Market trends
- HPI YoY
- ▼ -217.88%
- Current HPI
- 262.7854
- Rent YoY
- ▲ 1.24%
- Metro
- Panama City, FL
- State GDP YoY
- ▲ 3.28%
- F500 in state
- 36
Industry mix (Fortune 500 HQ in FL)
| Industry | F500 HQs | Revenue |
|---|---|---|
| Industrial Technology | 2 | $29B |
|
||
| Insurance | 2 | $17B |
|
||
| Retail | 1 | $60B |
|
||
| Technology Distribution | 1 | $58B |
|
||
| Homebuilding | 1 | $35B |
|
||
| Technology Manufacturing | 1 | $35B |
|
||
Price history
+154.6% since first listed11 events — show timeline
- 2026-05-20 Listed $137,500 CPARMLS
- 2026-04-16 Listed for Rent $1,375 APPFOLIO
- 2024-11-15 Rental Removed $1,350 APPFOLIO
- 2024-11-07 Listed for Rent $1,350 APPFOLIO
- 2021-12-09 Listing Removed — CPARMLS
- 2020-10-05 Sold (MLS) $105,000 CPARMLS
- 2020-03-17 Listed $110,000 CPARMLS
- 2013-10-08 Sold (MLS) $42,000 CPARMLS
- 2013-08-07 Listed $45,900 CPARMLS
- 2008-01-30 Listed $170,000 CPARMLS
- 2001-09-04 Sold (Public Records) $54,000 Public Records
Property tax history
+8.4%/yrLatest (2025): $2,328 · +8.8% YoY. Source: county tax records.
Cash-flow waterfall
monthlySold comps — $/sqft
last 12 mo · ≤1 miLoading sold comps…