 🏷️ Likely Rental
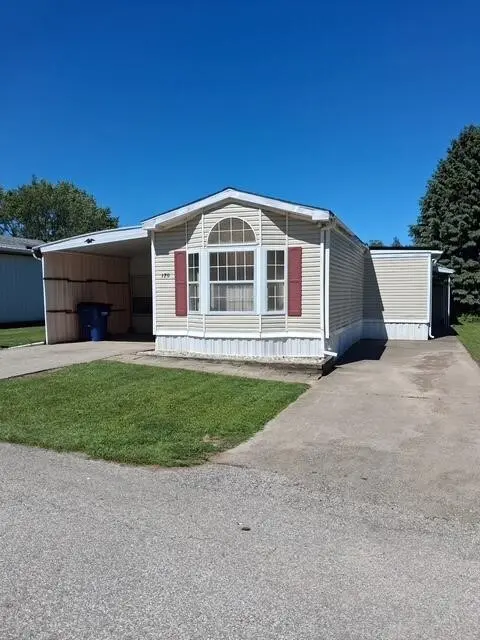
10644 W Main Unit 170 St · North East, PA
Flood risk 1/10 · Minimal
- FEMA flood zone
- X (unshaded)
- Chance of flooding over 30 yrs
- 0.0%
- Est. flood insurance / yr
- $473 – $860
Fire risk 1/10 · Minimal
- Est. fire insurance / yr
- $511 – $949
Heat risk 2/10 · Minimal
- Hot days now (above 91°F)
- 7 days/yr
- Hot days in 30 yrs
- 17 days/yr
Wind risk 1/10 · Minimal
- Chance of severe wind over 30 yrs
- —
Air-quality risk 2/10 · Minimal
- Unhealthy air days now
- 1 days/yr
- Unhealthy air days in 30 yrs
- 2 days/yr
Risk factors via First Street. Map © Google.
Why this score? — see what drove the B grade
The composite is a weighted blend of 9 inputs, each scored 0–100. Each bar is that input's sub-score; the figure is the points it added to the 100-point composite (weight × sub-score).
- Cash flow +30.0/30.0
- 1% rule +10.0/10.0
- DSCR +10.0/10.0
- ARV discount +7.5/15.0
- Schools +4.9/10.0
- Livability +4.4/5.0
- Rent growth +2.5/5.0
- Condition / age +2.2/5.0
- Appreciation +0.0/10.0
$35,000
🖨 Deal sheet (PDF) 📄 Offer letter ✓ Due diligence
Listing remarks MLS
Incredibly Affordable Mobile Home! Lot Rent Is $265/Month, Park Approval Required. No School Tax Because Of Homestead Exemption.
Key facts
- Two driveways
- Covered carport
- Storage building
Tags
Property features AI
Finance
- HOA & community: Homeowners association with monthly fee of $505 (includes trash)
Exterior
- Parking: 5 total parking spaces; 1-car garage; Carport; Paved parking areas
- Utilities: Public water; Public sewer
- Home design: Single-family residential property; Level lot; Paved road access; Zoning: R-1
- Construction: Vinyl siding; Composition roof; Slab foundation; Built as single-family residence
- Exterior features: Covered patio; Shed(s)
Interior
- Kitchen: Dishwasher; Disposal; Gas oven; Gas range; Refrigerator
- Bedrooms: Total rooms: 9
- Flooring: Carpet
- Bathrooms: 2 full bathrooms
- Heating & cooling: Forced air heating; Central air conditioning; Ceiling fans
- Interior features: Ceiling fans; Window coverings and drapes; Storage space
- Laundry & utility: Washer; Dryer
Neighborhood map
What this means for you Summary
Snapshot
- This is a 2-bed/2.0-bath single-family listed at $35k. Condition is rated fair.
Deal economics
- At list price, monthly cash flow is $260 ($3k/yr) — positive.
- The deal already cash-flows at list — no discount required.
- Meets the 1% rule at list price ($1k rent vs $35k).
- Recommended offer: $34k (1.5% below list) — sets the bar for market timing.
- Cap rate 15.2% vs local median 3.3% in North East — top-decile yield for the area; either an underpriced asset or a hidden risk that comps aren't pricing in. Stress-test before assuming the spread holds.
Location & tenants
- Location reads 88/100 on livability (#42 in PA, #233 nationally) — a professional / high-income tenant draw. Strengths: cost of living A+, housing A+, health & safety A+.
- North East SD (town): math 47% / reading 69% proficiency, ranked #88 of 539 in PA (top 16%) — acceptable for families but not a draw, mixed tenant base, ~2y average lease.
- Zoned schools: Earle C Davis Primary (315 students, 51% FRL); North East Ms (math 37% / reading 66%, grade C, #109 of 512 statewide, top 22%, 360 students, 54% FRL); North East Hs (math 92% / reading 84%, grade A, #4 of 437 statewide, top 1%, 526 students, 35% FRL).
- Market conditions: 62 active listings in the ZIP; 1 comparable units currently listed for rent nearby; 364 units permitted in Erie County in 2024 (188 in 5+ unit buildings).
Forward outlook
- Local home prices are declining (-3.0%/yr); year-one equity from $242 of loan paydown is wiped out by about $1k of value loss. Plan a longer hold.
- Erie County population projected at -14% by 2050 — secular population decline; favor cash flow + early exit over multi-decade hold.
- At projected returns (-3.0% appreciation + 3.0% rent growth), your $10k cash investment doubles in ~4 years — after that, you're playing with house money.
Negotiation context
- It's been on market 18 days — a 2% lower offer ($34k) is reasonable based on typical stale-listing flexibility.
- 2 sale attempts since 12y ago; this cycle's ask has dropped $7k (17%) from the opening price — seller is motivated, your offer sets the floor, not the list.
- Current owner paid $8k; list at $35k implies a 367% gain — meaningful room to come down on a strong offer.
Risks & watch-outs
- Watch-outs: HOA is 40% of rent.
Questions for the listing agent
- Have any recent inspections been done? Can we get a copy of the seller's disclosures and any deferred-maintenance estimates?
- What does the HOA fee cover, when was the last increase, and are there any pending special assessments or reserve-fund shortfalls?
- Is there a deadline driving the sale (1031 exchange, divorce, estate, relocation)? That informs how much negotiation room exists.
- Schools are B-rated — typically a magnet for longer-tenancy family renters. What's the average tenant stay here, and is there a school-zone premium baked into asking?
- What's the average days-on-market for RENTAL listings here right now (not sales)? A rising rental-DOM trend means longer vacancies and softer asking-rent achievability than the comps imply.
- What's the recent tenant-quality profile in this submarket — average credit score on applications, eviction rate, late-payment / NSF rate, and stable-employment percentage? A property-management company in the area should have these aggregated.
- How much new for-sale + rental construction is in the pipeline within 1–3 miles? Heavy new supply typically softens prices + rents 12–24 months out; constrained supply supports both.
Investment metrics
- 1% rule
- 3.64% ✓
- Cap rate
- 15.22%
- Cash-on-cash
- 31.88%
- DSCR
- 2.42
- GRM
- 2.3
CMA / ARV
- ARV (on-the-fly)
- $186,354
- Comps found
- 2
Show comp detail 2 sales within ~0.75 mi
| Address | Dist | Beds/Ba | Sqft | Sold | Price | $/sf | Match |
|---|---|---|---|---|---|---|---|
| 10644 W Main Lot 54 Rd | 0.11mi | 2/1.0 | 1,140 (-6%) | 4mo | $25,500 | $22 | 77 |
| 210 George St | 0.16mi | 3/1.5 (+1) | 1,048 (-14%) | 11mo | $159,900 | $153 | 54 |
Match score weights: distance 35% · size 25% · config 20% · recency 20%. Top-matched comps best support the ARV.
Projected returns pro-forma
-3.0% appreciation · 3.0% rent growth · sell at horizon
- IRR
- 27.4%
- Equity multiple
- 2.15×
- Total profit
- $11,241
- Equity at exit
- $5,219
- IRR
- 35.2%
- Equity multiple
- 4.31×
- Total profit
- $32,481
- Equity at exit
- $3,026
Cash invested: $9,800 (down + closing). Projections, not guarantees.
Landlord ↔ Tenant lean methodology
- Overall (STATE)
- 62 Landlord-Friendly
- State Pennsylvania
- 62 Landlord-Friendly · EVEN
- County
- — inherits STATE
- City
- — inherits STATE
ZIP-level market 16428
- Home prices YoY
- -26.0%
- Active inventory
- 62
- Price-to-rent
- 2.3×
Monthly cashflow live
- Estimated rent
- $1,275 medium interval (Pro) →
- Mortgage (P&I)
- −$184
- Tax est. 1.5%
- −$44 /mo · $525/yr
- Insurance
- −$15
- HOA
- −$505
- Vacancy / Maint / Mgmt
- −$268
- Net cashflow
- $260
Break-even live
Sensitivity live
| Price | -10% $285 | -5% $272 | +0% $260 | +5% $248 | +10% $236 |
|---|---|---|---|---|---|
| Rent | -10% $160 | -5% $210 | +0% $260 | +5% $311 | +10% $361 |
| Rate | -1.0pp $278 | -0.5pp $269 | base $260 | +0.5pp $251 | +1.0pp $242 |
UW: 25.0% down · 7.5% · 30yr · 1.5% tax · 5.0% vac · 8.0% maint · 8.0% mgmt
Financing live
Cash to close
- Down payment
- $8,750
- Closing costs
- $1,050
- Reserves months
- —
- Total cash needed
- —
Loan-product check · same deal, 3 products live
Conventional
25% down · 7.5% · 30yr
- Down + closing
- —
- Monthly P&I
- —
- Monthly cashflow
- —
- DSCR
- —
- Eligible?
- —
Personal DTI + credit; lowest rate.
DSCR
20% down · 8.5% · 30yr
- Down + closing
- —
- Monthly P&I
- —
- Monthly cashflow
- —
- DSCR
- —
- Eligible?
- —
No personal income docs; deal must DSCR.
Hard money
10% down · 12.0% · 12mo
- Down + closing
- —
- Monthly P&I
- —
- Monthly cashflow
- —
- DSCR
- —
- Eligible?
- —
Short-term bridge; refi at stabilization.
Rent comps 1 comps
| Address | Beds | Baths | Sqft | Rent | $/sqft | DOM | Units | Dist |
|---|---|---|---|---|---|---|---|---|
| 2007 N Pearl St North East, PA | 1.0–3.0 | 1.0–1.5 | 1125 | $1,275 | $1.13 | 45d | 2 | 1.17mi |
HOA detail
- Monthly dues
- $505 · $6,060/yr
Listing history 14 events
-
2026-06-22days on market $35,000 Active 18 DOM
-
2026-06-21days on market $35,000 Active 17 DOM
-
2026-06-21pricedays on market $35,000 Active 16 DOM
-
2026-06-18days on market $38,000 Active 14 DOM
-
2026-06-17days on market $38,000 Active 13 DOM
-
2026-06-16days on market $38,000 Active 12 DOM
-
2026-06-15days on market $38,000 Active 11 DOM
-
2026-06-13days on market $38,000 Active 9 DOM
-
2026-06-12pricedays on market $38,000 Active 8 DOM
-
2026-06-09days on market $42,000 Active 5 DOM
-
2026-06-08days on market $42,000 Active 4 DOM
-
2026-06-08days on market $42,000 Active 3 DOM
-
2026-06-07remarks 380-char remark
-
2026-06-07$42,000 Active 2 DOM
ⓘ Source: listings_history table (triggers on properties + properties_extension) + one-shot
backfill from property_details.listing_events for pre-trigger history.
Climate risk First Street
- Flood 1/10 Low FEMA zone X (unshaded) · 0% chance over 30 yrs
- Wildfire 1/10 Low
- Heat 2/10 Low 7 d/yr ≥91°F today · 17 d/yr by 30 yrs out
- Wind 1/10 Low
- Air quality 2/10 Low 1 unhealthy d/yr today · 2 by 30 yrs out
Nearby sold comps map
Loading sold comps map…
Walkable amenities ~0.75 mi
Loading nearby amenities…
Taxation est. · year 1
- Rental income
- $15,300
- − Mortgage interest
- −$1,961
- − Property taxes
- −$525
- − Insurance
- −$175
- − Repairs & maintenance
- −$1,224
- − Management
- −$1,224
- − HOA
- −$6,060
- − Depreciation
- −$1,018
- Taxable income
- $3,113
- Est. tax owed @ 24.0%
- −$747
- After-tax cash flow
- $2,377/yr
For passive investors: Depreciation is non-cash, so a rental often shows a tax loss while cash-flowing — sheltering income. Rental losses are passive: they offset passive income freely, and up to $25,000/yr can offset ordinary (W-2) income if you actively participate and your MAGI is under $100k (phasing out to $0 by $150k); unused losses carry forward. On sale, claimed depreciation is recaptured at up to 25%, and gains may owe capital-gains tax (a 1031 exchange can defer both). Figures are a year-1 estimate at your 24.0% rate — not tax advice; consult a CPA.
Condition & rehab AI · 12 photos
This mobile home is in fair condition with moderate repairs needed. Upgrading the kitchen and flooring would significantly increase its value.
Repairs flagged
- Moderate kitchen cabinets — dated and worn
- Moderate bathroom fixtures — dated and worn
- Moderate exterior siding — moderate wear
Value-add opportunities
- Both update kitchen cabinets and fixtures — modernizing kitchen would appeal to both buyers and renters
- Both replace carpeting with hardwood or tile — improves appearance and is easier to maintain
- Both paint interior walls — fresh paint enhances curb appeal and interior aesthetics
Renovation cost estimate screening
| Repair item | Severity | Est. cost |
|---|---|---|
| kitchen cabinets · dated and worn | Moderate | $3,000–15,000 |
| bathroom fixtures · dated and worn | Moderate | $3,000–15,000 |
| exterior siding · moderate wear | Moderate | $3,000–15,000 |
| Total estimated repair cost · 3 items | $9,000–45,000 |
Value-add ROI direction
- Both update kitchen cabinets and fixtures — modernizing kitchen would appeal to both buyers and renters ↑
- Both replace carpeting with hardwood or tile — improves appearance and is easier to maintain ↑
- Both paint interior walls — fresh paint enhances curb appeal and interior aesthetics ↑
ⓘ Cost ranges are severity-bucket heuristics (US national rule-of-thumb). Get contractor quotes + a written scope before underwriting a rehab budget.
Schools (NCES district)
- District
- North East SD
- NCES district ID
- 4217160
- Math proficiency
- 47% ▼ -15.00%
- Reading proficiency
- 69% ▼ -8.00%
- Median HH income
- $48,844
- Composite
- 49.22/100
- National rank
- #2037
- State rank
- #88 of 539 in PA
Livability — North East
- Score
- 88/100
- State rank
- #42
- US rank
- #233
Category grades
Schools grade is shown separately in the Schools card above.
Census & demographics
- Population (ZIP)
- 12,508
Population outlook (Erie County) Hauer SSP2
- Today (2025)
- 272,159 people
- By 2030
- 266,299 · -2.2%
- By 2040
- 250,987 · -7.8%
- By 2050
- 234,925 · -13.7%
- By 2075
- 199,164 · -26.8%
- By 2100
- 162,985 · -40.1%
Race, ethnicity, and origin ACS 2023
- Neighborhood character
- Predominantly White (91%)
- Race & ethnicity
- White 91% Two or more races 6% Hispanic / Latino 4%
- Common ancestry
- Romanian 13% Lithuanian 2% Italian 2%
- Foreign-born
- 1%
- Languages at home
- 98% English-only · Arabic 1% Spanish 1%
Political lean MEDSL · Erie
- 2024 margin
- Toss-up / Even · D 49.0% · R 50.0%
- 2008→2024 swing
- -20.9pp toward R · 2008: 19.9pp · 2024: -1.0pp
- All cycles
- 2024: R+1.0 2020: D+1.0 2016: R+2.0 2012: D+16.9 2008: D+19.9
Not yet ingested
- Civics
- —
Market trends
- HPI YoY
- ▼ -90.46%
- Current HPI
- 257.9847
- Rent YoY
- —
- Metro
- —
- State GDP YoY
- ▲ 1.68%
- F500 in state
- 34
Industry mix (Fortune 500 HQ in PA)
| Industry | F500 HQs | Revenue |
|---|---|---|
| Healthcare | 2 | $309B |
|
||
| Insurance | 2 | $27B |
|
||
| Telecommunications / Media | 1 | $124B |
|
||
| Industrial Distribution | 1 | $22B |
|
||
| Financial Services | 1 | $20B |
|
||
| Chemicals / Materials | 1 | $18B |
|
||
Price history
+366.7% since first listed3 events — show timeline
- 2026-06-04 Listed $42,000 GEBOR
- 2014-09-13 Sold (MLS) $7,500 GEBOR
- 2014-06-24 Listed $9,000 GEBOR
Cash-flow waterfall
monthlySold comps — $/sqft
last 12 mo · ≤1 miLoading sold comps…