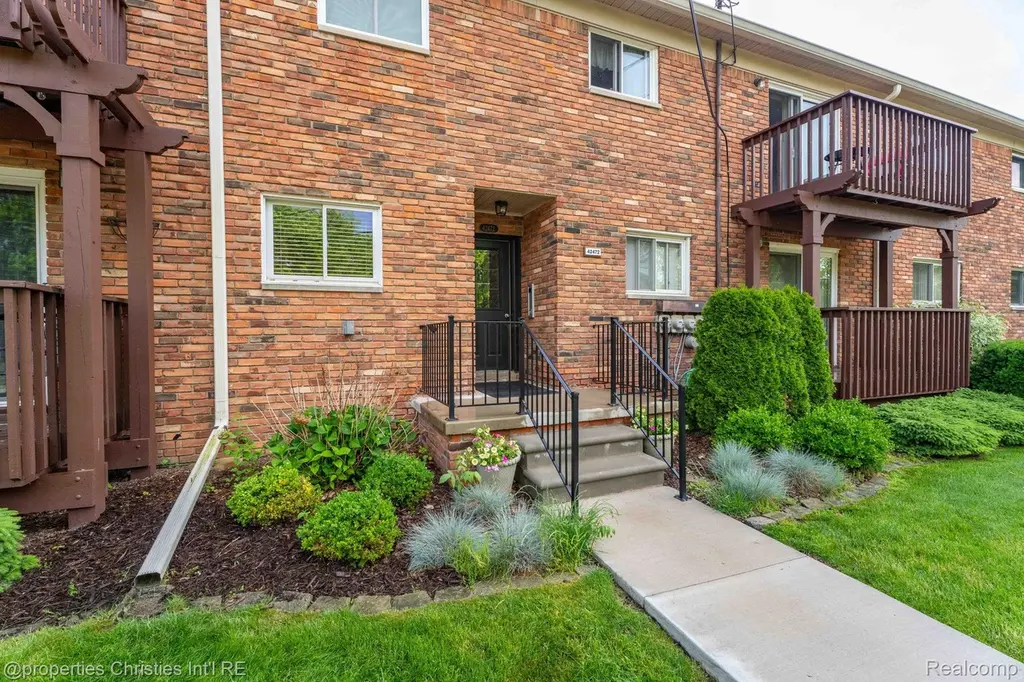
42472 Woodward Ave Unit B1 · Bloomfield, MI
Flood risk 1/10 · Minimal
- FEMA flood zone
- X (unshaded)
- Chance of flooding over 30 yrs
- 0.0%
- Est. flood insurance / yr
- $473 – $860
Fire risk 1/10 · Minimal
- Est. fire insurance / yr
- $784 – $1,456
Heat risk 2/10 · Minimal
- Hot days now (above 98°F)
- 7 days/yr
- Hot days in 30 yrs
- 15 days/yr
Wind risk 2/10 · Minimal
- Chance of severe wind over 30 yrs
- —
Air-quality risk 3/10 · Minor
- Unhealthy air days now
- 2 days/yr
- Unhealthy air days in 30 yrs
- 4 days/yr
Risk factors via First Street. Map © Google.
Why this score? — see what drove the C- grade
The composite is a weighted blend of 9 inputs, each scored 0–100. Each bar is that input's sub-score; the figure is the points it added to the 100-point composite (weight × sub-score).
- Cash flow +18.5/30.0
- ARV discount +7.5/15.0
- 1% rule +6.5/10.0
- Schools +6.5/10.0
- DSCR +5.8/10.0
- Rent growth +2.5/5.0
- Livability +2.5/5.0
- Condition / age +2.5/5.0
- Appreciation +0.0/10.0
$230,000
🖨 Deal sheet 📄 Offer letter ✓ Due diligence
Listing remarks MLS
Fantastic Bloomfield Hills First-Floor Condo! This beautifully maintained two-bedroom, two-bath residence offers effortless living in a prime location. From the moment you step inside, you'll appreciate the exceptional condition and pride of ownership throughout. The updated bathrooms feature timeless finishes, while the gleaming hardwood floors look as though they have never been walked on. The kitchen was completely renovated in 2008 and remains as stylish and pristine as the day it was completed. A spacious, light-filled living room provides the perfect setting for relaxing or entertaining, and the dining area opens to a charming private balcony where you can enjoy your morning coffee or unwind at the end of the day. The generous primary suite features three large closets, providing abundant storage space. Convenience continues with a private basement area that houses the mechanicals, washer, and dryer, while also offering the potential for additional living, hobby, or storage space. A covered carport is located just steps from your front door. Residents will love the community pool, conveniently located nearby for summertime enjoyment. Meticulously maintained and truly move-in ready, this is a rare opportunity to own a beautiful first-floor condo in sought-after Bloomfield Hills.
Key facts
- Private balcony
- Renovated kitchen
- Updated bathrooms
Tags
Property features AI
Finance
- Other: Pets allowed: contact for details
- HOA & community: Homeowners association with monthly fee; Monthly association fee $458; HOA covers gas, sewer, water, trash, snow removal, and grounds maintenance; Community pool; Sidewalks
Exterior
- Parking: No garage; Carport
- Security: Smoke detector(s)
- Utilities: Public water; Public sewer; Cable available
- Home design: Condominium; One story; Ground-level entry with steps; Brick veneer construction
- Construction: Brick veneer; Block foundation
- Exterior features: Balcony; Exterior lighting; Paved road
Interior
- Kitchen: Dishwasher; Microwave; Free-standing electric range; Free-standing refrigerator
- Bedrooms: 6 total rooms
- Bathrooms: 2 full bathrooms
- Heating & cooling: Forced air heating (natural gas); Central air; Ceiling fan(s)
- Interior features: Gas water heater; Disposal; Stainless steel appliances; Unfinished basement; Smoke detector(s)
- Laundry & utility: Laundry room; Washer; Dryer
Neighborhood map
What this means for you Summary
Snapshot
- This is a 2-bed/2.0-bath condo listed at $230k.
Deal economics
- At list price, monthly cash flow is $221 ($3k/yr) — positive.
- The deal already cash-flows at list — no discount required.
- Meets the 1% rule at list price ($3k rent vs $230k).
Location & tenants
- Location reads: area grade C — affects rentability + tenant quality, not the cash-flow math above.
- Bloomfield Hills Schools (suburban): math 65% / reading 74% proficiency, ranked #5 of 540 in MI (top 1%) — acceptable for families but not a draw, mixed tenant base, ~2y average lease; only 7% free/reduced lunch — higher-income household profile.
- Market conditions: 128 active listings in the ZIP; 9 comparable units currently listed for rent nearby; rentals leasing fast (median 13d on market — plan ~1-2 weeks tenant-placement turnaround); high-income renter base; 2,614 units permitted in Oakland County in 2024 (721 in 5+ unit buildings).
Forward outlook
- Local home prices are declining (-3.0%/yr); year-one equity from $2k of loan paydown is wiped out by about $7k of value loss. Plan a longer hold.
- Oakland County population projected at +10% by 2050 — modest demand growth; plan on rents tracking national, not racing it.
Negotiation context
- Only 7 days on market — expect competitive offers; lowballing is unlikely to land.
- 2 sale attempts with the ask held roughly flat each time — persistent listings suggest the price (not the market) is what's stuck; bring a comps-based counter.
- Current owner paid $140k; list at $230k implies a 64% gain — meaningful room to come down on a strong offer.
Questions for the listing agent
- Built in 1964 — when were the roof, HVAC, electrical panel, plumbing, and water heater last replaced?
- What does the HOA fee cover, when was the last increase, and are there any pending special assessments or reserve-fund shortfalls?
- Any open or pending special assessments — roof, HVAC, plumbing, elevator, façade? What's the per-unit balance and payoff schedule, and is the seller paying it off at close or rolling it to the buyer?
- Is there a deadline driving the sale (1031 exchange, divorce, estate, relocation)? That informs how much negotiation room exists.
- What's the average days-on-market for RENTAL listings here right now (not sales)? A rising rental-DOM trend means longer vacancies and softer asking-rent achievability than the comps imply.
- What's the recent tenant-quality profile in this submarket — average credit score on applications, eviction rate, late-payment / NSF rate, and stable-employment percentage? A property-management company in the area should have these aggregated.
- How much new apartment / multifamily construction is in the pipeline within 1–3 miles? Heavy new supply (>2% of stock underway) typically softens rents 12–24 months out; light construction supports rent growth.
Investment metrics
- 1% rule
- 1.15% ✓
- Cap rate
- 7.45%
- Cash-on-cash
- 4.12%
- DSCR
- 1.18
- GRM
- 7.3
CMA / ARV
No comps found within radius.
Projected returns pro-forma
-3.0% appreciation · 3.0% rent growth · sell at horizon
- IRR
- -9.8%
- Equity multiple
- 0.64×
- Total profit
- $-22,993
- Equity at exit
- $34,294
- IRR
- -0.2%
- Equity multiple
- 0.98×
- Total profit
- $-1,061
- Equity at exit
- $19,886
Cash invested: $64,400 (down + closing). Projections, not guarantees.
Landlord ↔ Tenant lean methodology
- Overall (STATE)
- 62 Landlord-Friendly
- State Michigan
- 62 Landlord-Friendly · EVEN
- County
- — inherits STATE
- City
- — inherits STATE
ZIP-level market 48304
- Active inventory
- 128
- Price-to-rent
- 7.3×
Monthly cashflow live
- Estimated rent
- $2,639 high interval (Pro) →
- Mortgage (P&I)
- −$1,206
- Tax from tax record
- −$104 /mo · $1,244/yr
- Insurance
- −$96
- HOA
- −$458
- Vacancy / Maint / Mgmt
- −$554
- Net cashflow
- $221
Break-even live
UW: 25.0% down · 7.5% · 30yr · 1.5% tax · 5.0% vac · 8.0% maint · 8.0% mgmt
Financing live
Cash to close
- Down payment
- $57,500
- Closing costs
- $6,900
- Reserves months
- —
- Total cash needed
- —
Loan-product check · same deal, 3 products live
Conventional
25% down · 7.5% · 30yr
- Down + closing
- —
- Monthly P&I
- —
- Monthly cashflow
- —
- DSCR
- —
- Eligible?
- —
Personal DTI + credit; lowest rate.
DSCR
20% down · 8.5% · 30yr
- Down + closing
- —
- Monthly P&I
- —
- Monthly cashflow
- —
- DSCR
- —
- Eligible?
- —
No personal income docs; deal must DSCR.
Hard money
10% down · 12.0% · 12mo
- Down + closing
- —
- Monthly P&I
- —
- Monthly cashflow
- —
- DSCR
- —
- Eligible?
- —
Short-term bridge; refi at stabilization.
Rent comps 9 comps
| Address | Beds | Baths | Sqft | Rent | $/sqft | DOM | Units | Dist |
|---|---|---|---|---|---|---|---|---|
| 42522 Woodward Ave Bloomfield Twp, MI | 2.0 | 2.0 | 1300 | $3,300 | $2.54 | 1d | 1 | 0.05mi |
| 42160 Woodward Ave Bloomfield Hills, MI | 2.0 | 2.0 | 1689 | $3,500 | $2.07 | 1d | 1 | 0.16mi |
| 100 W Hickory Grove Rd Bloomfield Hills, MI | 2.0 | 1.5–2.0 | 1032 | $1,700 | $1.65 | 12d | 2 | 0.21mi |
| 100 W Hickory Grove Rd Bloomfield Hills, MI | 2.0 | 1.0–2.0 | 1032 | $1,625 | $1.57 | 24d | 3 | 0.21mi |
| 444 N Fox Hills Dr #3 Bloomfield Twp, MI | 2.0 | 2.0 | 1089 | $1,598 | $1.47 | 23d | 1 | 0.91mi |
| 444 N Fox Hills Dr #7 Bloomfield Twp, MI | 2.0 | 2.0 | 1089 | $1,550 | $1.42 | 23d | 1 | 0.91mi |
| 433 Fox Hills Dr S #5 Bloomfield Hills, MI | 2.0 | 2.0 | 1089 | $1,700 | $1.56 | 12d | 1 | 0.93mi |
| 124 Alice Ave Bloomfield Township, MI | 3.0 | 1.0 | 1440 | $2,000 | $1.39 | 5d | 1 | 1.04mi |
| E Fox Hills Dr Bloomfield Twp, MI | 2.0 | 2.0 | 1055 | $1,300 | $1.23 | 16d | 1 | 1.08mi |
HOA detail condo
- Monthly dues
- $458 · $5,496/yr
- Likely covers
- pool
- Assessments
- None detected in remarks — confirm with the listing agent.
Listing history 7 events
-
2026-06-18days on market $230,000 Active 7 DOM
-
2026-06-17days on market $230,000 Active 6 DOM
-
2026-06-16days on market $230,000 Active 5 DOM
-
2026-06-15days on market $230,000 Active 4 DOM
-
2026-06-13days on market $230,000 Active 2 DOM
-
2026-06-13remarks 699-char remark
-
2026-06-13$230,000 Active 1 DOM
ⓘ Source: listings_history table (triggers on properties + properties_extension) + one-shot
backfill from property_details.listing_events for pre-trigger history.
Tax reassessment forecast MI · Partial reset (capped growth)
- Current annual tax
- $1,244 · $104/mo
- Projected year-2 tax
- $2,393 · $199/mo
- Expected delta
- +$1,149/yr (+$96/mo · 92.3%)
ⓘ Screening estimate from a state-policy table — verify with the county assessor before closing.
Climate risk First Street
- Flood 1/10 Low FEMA zone X (unshaded) · 0% chance over 30 yrs
- Wildfire 1/10 Low
- Heat 2/10 Low 7 d/yr ≥98°F today · 15 d/yr by 30 yrs out
- Wind 2/10 Low
- Air quality 3/10 Moderate 2 unhealthy d/yr today · 4 by 30 yrs out
Nearby sold comps map
Loading sold comps map…
Walkable amenities ~0.75 mi
Loading nearby amenities…
Taxation est. · year 1
- Rental income
- $31,664
- − Mortgage interest
- −$12,884
- − Property taxes
- −$1,244
- − Insurance
- −$1,150
- − Repairs & maintenance
- −$2,533
- − Management
- −$2,533
- − HOA
- −$5,496
- − Depreciation
- −$6,691
- Taxable loss
- −$867
- Est. tax savings @ 24.0%
- +$208
- After-tax cash flow
- $2,859/yr
For passive investors: Depreciation is non-cash, so a rental often shows a tax loss while cash-flowing — sheltering income. Rental losses are passive: they offset passive income freely, and up to $25,000/yr can offset ordinary (W-2) income if you actively participate and your MAGI is under $100k (phasing out to $0 by $150k); unused losses carry forward. On sale, claimed depreciation is recaptured at up to 25%, and gains may owe capital-gains tax (a 1031 exchange can defer both). Figures are a year-1 estimate at your 24.0% rate — not tax advice; consult a CPA.
Schools (NCES district)
- District
- Bloomfield Hills Schools
- NCES district ID
- 2606090
- Math proficiency
- 65% ▼ -2.00%
- Reading proficiency
- 74% ▲ 2.00%
- Median HH income
- $117,848
- Composite
- 65.41/100
- National rank
- #481
- State rank
- #5 of 540 in MI
Livability — Bloomfield
No livability data for this city. (Only ~50 U.S. cities are tracked.)
Census & demographics
- County
- Oakland County · 1,009,092 people
- Metro
- Detroit-Warren-Dearborn, MI
- Population (ZIP)
- 17,387
- Household income
- $143,204
- Rent vs Own
- Severe rent burden
- 85.0
Population outlook (Oakland County) Hauer SSP2
- Today (2025)
- 1,335,747 people
- By 2030
- 1,375,100 · +2.9%
- By 2040
- 1,435,385 · +7.5%
- By 2050
- 1,469,250 · +10.0%
- By 2075
- 1,531,946 · +14.7%
- By 2100
- 1,450,485 · +8.6%
Race, ethnicity, and origin ACS 2023
- Neighborhood character
- Predominantly White (79%)
- Race & ethnicity
- White 79% Asian 10% Two or more races 4% Black 4% Hispanic / Latino 2%
- Common ancestry
- Romanian 6% Lithuanian 3% Slovak 2%
- Foreign-born
- 17% · China, Canada, South Korea
- Languages at home
- 79% English-only · Other Indo-European 6% Arabic 5% Other Asian/Pacific 3%
Political lean MEDSL · Oakland
- 2024 margin
- D (+10.6) · D 54.4% · R 43.8% · Other 1.9%
- 2008→2024 swing
- -3.9pp toward R · 2008: 14.5pp · 2024: 10.6pp
- All cycles
- 2024: D+10.6 2020: D+14.1 2016: D+8.1 2012: D+8.1 2008: D+14.5
Not yet ingested
- Civics
- —
Market trends
- HPI YoY
- ▼ -195.96%
- Current HPI
- 160.6477
- Rent YoY
- —
- Metro
- Detroit-Warren-Dearborn, MI
- State GDP YoY
- ▲ 1.37%
- F500 in state
- 28
Industry mix (Fortune 500 HQ in MI)
| Industry | F500 HQs | Revenue |
|---|---|---|
| Automotive Parts | 3 | $48B |
|
||
| Automotive | 2 | $372B |
|
||
| Chemicals | 1 | $45B |
|
||
| Automotive Retail | 1 | $29B |
|
||
| Healthcare / Medical Devices | 1 | $23B |
|
||
| Automotive Technology | 1 | $20B |
|
||
Price history
+219.4% since first listed5 events — show timeline
- 2026-06-08 Listed $230,000 MiRealSource-MiMLS
- 2026-06-08 Listed $230,000 REALCOMP
- 2008-05-21 Sold (Public Records) $140,000 Public Records
- 1999-11-17 Sold (Public Records) $94,000 Public Records
- 1995-02-01 Sold (Public Records) $72,000 Public Records
Property tax history
+1.6%/yrLatest (2025): $1,244 · +2.1% YoY. Source: county tax records.
Cash-flow waterfall
monthlySold comps — $/sqft
last 12 mo · ≤1 miLoading sold comps…