4885 1st St NE #203 · St. Petersburg, FL
Flood risk 9/10 · Severe
- FEMA flood zone
- AE
- Chance of flooding over 30 yrs
- 0.99%
- Est. flood insurance / yr
- $1,737 – $8,500
Fire risk 1/10 · Minimal
- Est. fire insurance / yr
- $947 – $1,759
Heat risk 10/10 · Severe
- Hot days now (above 106°F)
- 7 days/yr
- Hot days in 30 yrs
- 28 days/yr
Wind risk 10/10 · Severe
- Chance of severe wind over 30 yrs
- 99.0%
Air-quality risk 3/10 · Minor
- Unhealthy air days now
- 2 days/yr
- Unhealthy air days in 30 yrs
- 3 days/yr
Risk factors via First Street. Map © Google.
Why this score? — see what drove the B- grade
The composite is a weighted blend of 9 inputs, each scored 0–100. Each bar is that input's sub-score; the figure is the points it added to the 100-point composite (weight × sub-score).
- Cash flow +29.2/30.0
- 1% rule +10.0/10.0
- DSCR +10.0/10.0
- ARV discount +7.5/15.0
- Schools +4.3/10.0
- Rent growth +3.1/5.0
- Livability +2.5/5.0
- Condition / age +2.5/5.0
- Appreciation +0.0/10.0
$139,900
🖨 Deal sheet 📄 Offer letter ✓ Due diligence
Listing remarks
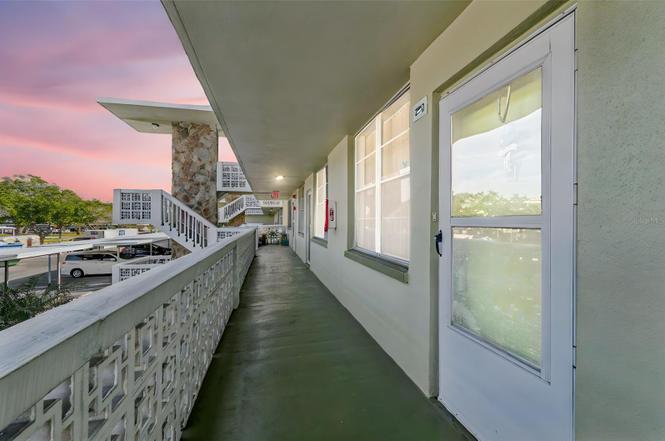
This well maintained unit offers 1,035 sq. ft. features 2 spacious bedrooms and 2 full bathrooms, split floor plan making it ideal for entertaining family and friends. This 2nd floor unit (with building elevator) offers great views of the central courtyard and peace of mind in northeast St Pete. You're just minutes away from shopping, dining and medical facilities. Great biking trail right in front of the community directly connected to downtown. Shopping is convenient at Northeast Park Center including Publix and Whole Foods. Enjoy fabulous community amenities and activities in the clubhouse, at the heated pool, shuffleboard courts, BBQ grills and well-maintained grounds and courtyard with
Key facts
- Shuffleboard courts
- Community amenities
- Split floor plan
Tags
Property features AI
Finance
- Other: Partially furnished; Living area reported as 1,035 (source: public records)
- Financial info: Total annual fees $6,816; Lease restrictions apply
- HOA & community: Monthly HOA fee of $568; HOA fee covers cable TV, common area taxes, pool, escrow reserves, insurance, internet, structure maintenance, grounds maintenance, pest control, sewer, trash and water; Association approval required; Association name listed as Pro Bayway Managment; Condominium land included; Community clubhouse and pool; Community mailbox; Cats allowed; Senior community
Exterior
- Parking: Visitor parking (directions note: please park in visitor section)
- Utilities: Public water; Public sewer; Cable available; Electricity available; Phone service available
- Home design: Condominium; Residential property; One story; Faces north; Entry on floor 2
- Construction: Concrete construction; Shingle roof; Slab foundation; Built as part of building number 4485
- Exterior features: Exterior lighting; Sidewalk
Interior
- Kitchen: Range; Refrigerator
- Bedrooms: 2 bedrooms
- Flooring: Vinyl
- Bathrooms: 2 full bathrooms
- Heating & cooling: Central heating; Central air conditioning
- Interior features: Window treatments; Building has an elevator
- Laundry & utility: Common area laundry
Neighborhood map
What this means for you Summary
Snapshot
- This is a 2-bed/2.0-bath condo listed at $140k.
Deal economics
- At list price, monthly cash flow is $62 ($748/yr) — positive.
- The deal already cash-flows at list — no discount required.
- Meets the 1% rule at list price ($2k rent vs $140k).
- Recommended offer: $123k (12.0% below list) — sets the bar for market timing.
- Cap rate 10.5% vs local median 2.6% in St. Petersburg — top-decile yield for the area; either an underpriced asset or a hidden risk that comps aren't pricing in. Stress-test before assuming the spread holds.
Location & tenants
- Location reads: area grade B — affects rentability + tenant quality, not the cash-flow math above.
- Pinellas (suburban): math 51% / reading 51% proficiency, ranked #31 of 73 in FL (top 42%) — acceptable for families but not a draw, mixed tenant base, ~2y average lease.
- Market conditions: Rents rising (+2.2%/yr); 451 active listings in the ZIP; 40 comparable units currently listed for rent nearby; rentals leasing fast (median 8d on market — plan ~1-2 weeks tenant-placement turnaround); solid renter incomes; 2,676 units permitted in Pinellas County in 2024 (1,422 in 5+ unit buildings).
Forward outlook
- Local home prices are declining (-3.0%/yr); year-one equity from $967 of loan paydown is wiped out by about $4k of value loss. Plan a longer hold.
- Pinellas County population projected at +14% by 2050 — modest demand growth; plan on rents tracking national, not racing it.
Negotiation context
- It's been on market 154 days — a 12% lower offer ($123k) is reasonable based on typical stale-listing flexibility.
- Current owner paid $54k; list at $140k implies a 159% gain — meaningful room to come down on a strong offer.
Risks & watch-outs
- Watch-outs: flood insurance adds $427/mo; HOA is 24% of rent.
- Climate carrying-cost: in FEMA flood zone AE (mandatory federal flood insurance); severe wind risk, 99% chance of damaging wind over 30y; extreme-heat days projected 7→28/yr by 2055 (HVAC capex compounding) — expect insurance premiums to compound above CPI over the hold.
Questions for the listing agent
- It's been on market 154 days. Have you received any prior offers? Is the seller open to a 12% concession, seller financing, or rate buy-down credit?
- Built in 1971 — when were the roof, HVAC, electrical panel, plumbing, and water heater last replaced?
- What's the actual annual flood-insurance premium (NFIP or private), and is the property in a SFHA with mandatory coverage?
- What does the HOA fee cover, when was the last increase, and are there any pending special assessments or reserve-fund shortfalls?
- Any open or pending special assessments — roof, HVAC, plumbing, elevator, façade? What's the per-unit balance and payoff schedule, and is the seller paying it off at close or rolling it to the buyer?
- Why hasn't it sold? Are there any deal-killer items the seller is aware of (foundation, flood, title, zoning, code violations)?
- Is there a deadline driving the sale (1031 exchange, divorce, estate, relocation)? That informs how much negotiation room exists.
- What's the average days-on-market for RENTAL listings here right now (not sales)? A rising rental-DOM trend means longer vacancies and softer asking-rent achievability than the comps imply.
- What's the recent tenant-quality profile in this submarket — average credit score on applications, eviction rate, late-payment / NSF rate, and stable-employment percentage? A property-management company in the area should have these aggregated.
- How much new apartment / multifamily construction is in the pipeline within 1–3 miles? Heavy new supply (>2% of stock underway) typically softens rents 12–24 months out; light construction supports rent growth.
Investment metrics
- 1% rule
- 1.70% ✓
- Cap rate
- 10.49%
- Cash-on-cash
- 14.98%
- DSCR
- 1.67
- GRM
- 4.9
CMA / ARV
No comps found within radius.
Projected returns pro-forma
-3.0% appreciation · 2.21% rent growth · sell at horizon
- IRR
- -14.4%
- Equity multiple
- 0.49×
- Total profit
- $-20,015
- Equity at exit
- $20,860
- IRR
- -7.4%
- Equity multiple
- 0.55×
- Total profit
- $-17,619
- Equity at exit
- $12,096
Cash invested: $39,172 (down + closing). Projections, not guarantees.
Landlord ↔ Tenant lean methodology
- Overall (STATE)
- 87 Strongly Landlord-Friendly
- State Florida
- 87 Strongly Landlord-Friendly · R+3
- County
- — inherits STATE
- City
- — inherits STATE
ZIP-level market 33703
- Rents YoY
- 2.2%
- Active inventory
- 451
- Price-to-rent
- 4.9×
Monthly cashflow live
- Estimated rent
- $2,374 high interval (Pro) →
- Mortgage (P&I)
- −$734
- Tax from tax record
- −$27 /mo · $320/yr
- Insurance
- −$58
- Flood insurance flood zone
- −$427 /mo · $5,118/yr
- HOA
- −$568
- Vacancy / Maint / Mgmt
- −$499
- Net cashflow
- $62
Break-even live
UW: 25.0% down · 7.5% · 30yr · 1.5% tax · 5.0% vac · 8.0% maint · 8.0% mgmt
Financing live
Cash to close
- Down payment
- $34,975
- Closing costs
- $4,197
- Reserves months
- —
- Total cash needed
- —
Loan-product check · same deal, 3 products live
Conventional
25% down · 7.5% · 30yr
- Down + closing
- —
- Monthly P&I
- —
- Monthly cashflow
- —
- DSCR
- —
- Eligible?
- —
Personal DTI + credit; lowest rate.
DSCR
20% down · 8.5% · 30yr
- Down + closing
- —
- Monthly P&I
- —
- Monthly cashflow
- —
- DSCR
- —
- Eligible?
- —
No personal income docs; deal must DSCR.
Hard money
10% down · 12.0% · 12mo
- Down + closing
- —
- Monthly P&I
- —
- Monthly cashflow
- —
- DSCR
- —
- Eligible?
- —
Short-term bridge; refi at stabilization.
Rent comps 40 comps
| Address | Beds | Baths | Sqft | Rent | $/sqft | DOM | Units | Dist |
|---|---|---|---|---|---|---|---|---|
| 135 48th Ave N Unit B St. Petersburg, FL | 1.0 | 1.0 | 800 | $2,495 | $3.12 | 24d | 1 | 0.08mi |
| 4681 1st St NE #209 Saint Petersburg, FL | 2.0 | 2.0 | 1120 | $2,250 | $2.01 | 24d | 1 | 0.09mi |
| 120 47th Ave N Saint Petersburg, FL | 1.0–2.0 | 1.0–2.0 | 914 | $1,999 | $2.19 | 2d | 8 | 0.12mi |
| 4651 1st St NE #306 Saint Petersburg, FL | 2.0 | 2.0 | 1120 | $2,900 | $2.59 | 4d | 1 | 0.15mi |
| 4880 Locust St NE St Petersburg, FL | 1.0 | 1.0–2.0 | 840 | $1,375 | $1.64 | 24d | 3 | 0.18mi |
| 4880 Locust St NE St Petersburg, FL | 1.0 | 1.5–2.0 | 930 | $1,500 | $1.61 | 4d | 2 | 0.18mi |
| 4920 Locust St NE St. Petersburg, FL | 2.0 | 2.0 | 1035 | $1,825 | $1.76 | 24d | 1 | 0.23mi |
| 363 48th Ave N Saint Petersburg, FL | 1.0 | 1.0 | 750 | $1,900 | $2.53 | 24d | 1 | 0.23mi |
| 4843 Napoli Ct NE Saint Petersburg, FL | 2.0 | 2.5 | 1210 | $3,200 | $2.64 | 4d | 1 | 0.35mi |
| 440 50th Ave N Saint Petersburg, FL | 1.0 | 1.0 | 825 | $2,100 | $2.55 | 24d | 1 | 0.37mi |
| 4200 1st St NE Unit 2 St. Petersburg, FL | 1.0 | 1.0 | 800 | $1,650 | $2.06 | 24d | 1 | 0.37mi |
| 131 41st Ave N Saint Petersburg, FL | 2.0 | 2.0 | 933 | $2,100 | $2.25 | 3d | 2 | 0.44mi |
| 617 Segovia Ct NE Saint Petersburg, FL | 2.0 | 2.5 | 1420 | $2,950 | $2.08 | 24d | 1 | 0.44mi |
| 411 42nd Ave NE Saint Petersburg, FL | 3.0 | 2.0 | 1365 | $3,500 | $2.56 | 17d | 1 | 0.44mi |
| 324 42nd Ave N Saint Petersburg, FL | 2.0 | 2.0 | 1434 | $3,600 | $2.51 | 4d | 1 | 0.45mi |
| 233 41st Ave NE Saint Petersburg, FL | 3.0 | 1.0 | 920 | $2,295 | $2.49 | 4d | 1 | 0.46mi |
| 375 54th Ter N St. Petersburg, FL | 1.0–2.0 | 1.0–2.0 | 966 | $3,323 | $3.44 | 2d | 13 | 0.46mi |
| 550 50th Ave N Saint Petersburg, FL | 2.0 | 1.0 | 765 | $1,700 | $2.22 | 7d | 2 | 0.46mi |
| 547 46th Ave N Saint Petersburg, FL | 2.0 | 1.0 | 837 | $2,000 | $2.39 | 7d | 1 | 0.48mi |
| 628 51st Ave N Saint Petersburg, FL | 3.0 | 2.5 | 1480 | $2,800 | $1.89 | 3d | 1 | 0.49mi |
| 101 40th Ave NE Saint Petersburg, FL | 3.0 | 1.0 | 1075 | $2,700 | $2.51 | 4d | 1 | 0.50mi |
| 617 52nd Ave N Saint Petersburg, FL | 3.0 | 2.5 | 1481 | $3,250 | $2.19 | 4d | 1 | 0.53mi |
| 5185 6th Way N St Petersburg, FL | 3.0 | 2.5 | 1480 | $3,150 | $2.13 | 4d | 1 | 0.53mi |
| 613 44th Ave N Saint Petersburg, FL | 2.0 | 1.0 | 1124 | $2,250 | $2.00 | 4d | 1 | 0.54mi |
| 426 Palm Ave N Unit 9 St. Petersburg, FL | 2.0 | 1.0 | 850 | $1,500 | $1.76 | 24d | 1 | 0.54mi |
| 5516 Pine Cir NE Saint Petersburg, FL | 3.0 | 1.0 | 1205 | $2,500 | $2.07 | 4d | 1 | 0.58mi |
| 5519 Commonwealth Ave N Saint Petersburg, FL | 2.0 | 1.0 | 852 | $2,900 | $3.40 | 4d | 1 | 0.64mi |
| 400 38th Ave NE St Petersburg, FL | 3.0 | 2.0 | 1166 | $5,400 | $4.63 | 24d | 1 | 0.70mi |
| 220 Southeast Blvd N St. Petersburg, FL | 2.0 | 1.0 | 850 | $2,000 | $2.35 | 16d | 1 | 0.79mi |
| 4628 Dr Martin Luther King Jr St N Saint Petersburg, FL | 3.0 | 2.0 | 1421 | $2,950 | $2.08 | 24d | 1 | 0.81mi |
| 517 Hampton Ave NE St Petersburg, FL | 3.0 | 2.0 | 896 | $2,950 | $3.29 | 24d | 1 | 0.83mi |
| 646 38th Ave N Saint Petersburg, FL | 2.0 | 1.0 | 978 | $2,400 | $2.45 | 4d | 1 | 0.83mi |
| 5210 Doctor Martin Luther King Junior St N St. Petersburg, FL | 3.0 | 2.0 | 1318 | $3,600 | $2.73 | 14d | 1 | 0.86mi |
| 5801 Magnolia St N Saint Petersburg, FL | 2.0 | 2.0 | 1147 | $2,250 | $1.96 | 4d | 1 | 0.93mi |
| 6360 1st St N #103 Saint Petersburg, FL | 1.0 | 1.0 | 755 | $1,499 | $1.99 | 4d | 1 | 0.97mi |
| 252 33rd Ave N St. Petersburg, FL | 1.0 | 1.0 | 700 | $1,995 | $2.85 | 18d | 1 | 0.99mi |
| 209 NW Jefferson Cir N Unit JEFFERSON209-15 St. Petersburg, FL | 2.0 | 1.0 | 740 | $1,275 | $1.72 | 3d | 1 | 1.00mi |
| 209 NW Jefferson Cir N Unit 15 St. Petersburg, FL | 2.0 | 1.0 | 740 | $1,275 | $1.72 | 24d | 1 | 1.00mi |
| 510 34th Ave N Saint Petersburg, FL | 2.0 | 2.0 | 1334 | $3,200 | $2.40 | 4d | 1 | 1.00mi |
| 209 NE Lincoln Cir N St Petersburg, FL | 2.0 | 1.5 | 855 | $1,498 | $1.75 | 24d | 2 | 1.03mi |
HOA detail condo
- Monthly dues
- $568 · $6,816/yr
- Likely covers
- landscapingpool
- Assessments
- None detected in remarks — confirm with the listing agent.
Listing history 15 events
-
2026-06-18days on market $139,900 Active 154 DOM
-
2026-06-17days on market $139,900 Active 153 DOM
-
2026-06-16days on market $139,900 Active 152 DOM
-
2026-06-15days on market $139,900 Active 151 DOM
-
2026-06-13days on market $139,900 Active 149 DOM
-
2026-06-09days on market $139,900 Active 145 DOM
-
2026-06-08days on market $139,900 Active 144 DOM
-
2026-06-07days on market $139,900 Active 143 DOM
-
2026-06-04days on market $139,900 Active 140 DOM
-
2026-06-03days on market $139,900 Active 139 DOM
-
2026-06-01days on market $139,900 Active 137 DOM
-
2026-05-31days on market $139,900 Active 136 DOM
-
2026-04-09price $139,900
-
2026-01-15$143,000 Active
-
2002-06-18soldstatus $54,000
ⓘ Source: listings_history table (triggers on properties + properties_extension) + one-shot
backfill from property_details.listing_events for pre-trigger history.
Tax reassessment forecast FL · Resets to sale price
- Current annual tax
- $320 · $27/mo
- Projected year-2 tax
- $1,161 · $97/mo
- Expected delta
- +$841/yr (+$70/mo · 262.4%)
ⓘ Screening estimate from a state-policy table — verify with the county assessor before closing.
Climate risk First Street
- Flood 9/10 Extreme FEMA zone AE · 99% chance over 30 yrs
- Wildfire 1/10 Low
- Heat 10/10 Extreme 7 d/yr ≥106°F today · 28 d/yr by 30 yrs out
- Wind 10/10 Extreme 99% chance of damaging wind over 30 yrs
- Air quality 3/10 Moderate 2 unhealthy d/yr today · 3 by 30 yrs out
Nearby sold comps map
Loading sold comps map…
Walkable amenities ~0.75 mi
Loading nearby amenities…
Taxation est. · year 1
- Rental income
- $28,489
- − Mortgage interest
- −$7,837
- − Property taxes
- −$320
- − Insurance
- −$5,818
- − Repairs & maintenance
- −$2,279
- − Management
- −$2,279
- − HOA
- −$6,816
- − Depreciation
- −$4,070
- Taxable loss
- −$930
- Est. tax savings @ 24.0%
- +$223
- After-tax cash flow
- $971/yr
For passive investors: Depreciation is non-cash, so a rental often shows a tax loss while cash-flowing — sheltering income. Rental losses are passive: they offset passive income freely, and up to $25,000/yr can offset ordinary (W-2) income if you actively participate and your MAGI is under $100k (phasing out to $0 by $150k); unused losses carry forward. On sale, claimed depreciation is recaptured at up to 25%, and gains may owe capital-gains tax (a 1031 exchange can defer both). Figures are a year-1 estimate at your 24.0% rate — not tax advice; consult a CPA.
Schools (NCES district)
- District
- Pinellas
- NCES district ID
- 1201560
- Math proficiency
- 51% ▼ -5.00%
- Reading proficiency
- 51% ▼ -3.00%
- Median HH income
- $46,270
- Composite
- 43.27/100
- National rank
- #3046
- State rank
- #31 of 73 in FL
Livability — St. Petersburg
No livability data for this city. (Only ~50 U.S. cities are tracked.)
Census & demographics
- Census place
- St. Petersburg, FL
- County
- Pinellas County · 939,478 people
- City population
- 249,151
- Metro
- Tampa-St. Petersburg-Clearwater, FL
- Population (ZIP)
- 25,264
- Household income
- $95,224
- Rent vs Own
- Severe rent burden
- 509.0
Population outlook (Pinellas County) Hauer SSP2
- Today (2025)
- 1,027,532 people
- By 2030
- 1,063,586 · +3.5%
- By 2040
- 1,125,020 · +9.5%
- By 2050
- 1,168,637 · +13.7%
- By 2075
- 1,265,188 · +23.1%
- By 2100
- 1,260,357 · +22.7%
Race, ethnicity, and origin ACS 2023
- Neighborhood character
- Predominantly White (76%)
- Race & ethnicity
- White 76% Hispanic / Latino 10% Two or more races 10% Black 5% Asian 4%
- Hispanic origin (detail)
- Mexican 1% Puerto Rican 2% Cuban 2%
- Common ancestry
- Lithuanian 4% Romanian 3% Italian 2%
- Foreign-born
- 9% · Canada, Vietnam
- Languages at home
- 87% English-only · Spanish 6% Russian/Polish/Slavic 2% Other Indo-European 1%
Political lean MEDSL · Pinellas
- 2024 margin
- Lean R (+5.2) · D 46.9% · R 52.1%
- 2008→2024 swing
- -13.5pp toward R · 2008: 8.3pp · 2024: -5.2pp
- All cycles
- 2024: R+5.2 2020: D+0.2 2016: R+1.1 2012: D+5.6 2008: D+8.3
Not yet ingested
- Civics
- —
Market trends
- HPI YoY
- ▼ -617.95%
- Current HPI
- 352.2886
- Rent YoY
- ▲ 2.21%
- Metro
- Tampa-St. Petersburg-Clearwater, FL
- State GDP YoY
- ▲ 3.28%
- F500 in state
- 36
Industry mix (Fortune 500 HQ in FL)
| Industry | F500 HQs | Revenue |
|---|---|---|
| Industrial Technology | 2 | $29B |
|
||
| Insurance | 2 | $17B |
|
||
| Retail | 1 | $60B |
|
||
| Technology Distribution | 1 | $58B |
|
||
| Homebuilding | 1 | $35B |
|
||
| Technology Manufacturing | 1 | $35B |
|
||
Price history
+159.1% since first listed3 events — show timeline
- 2026-04-09 Price Changed $139,900 Stellar MLS as Distributed by MLS Grid
- 2026-01-15 Listed $143,000 Stellar MLS as Distributed by MLS Grid
- 2002-06-18 Sold (Public Records) $54,000 Public Records
Property tax history
-7.3%/yrLatest (2025): $320 · +11.0% YoY. Source: county tax records.
Cash-flow waterfall
monthlySold comps — $/sqft
last 12 mo · ≤1 miLoading sold comps…