 🏗️ New Construction
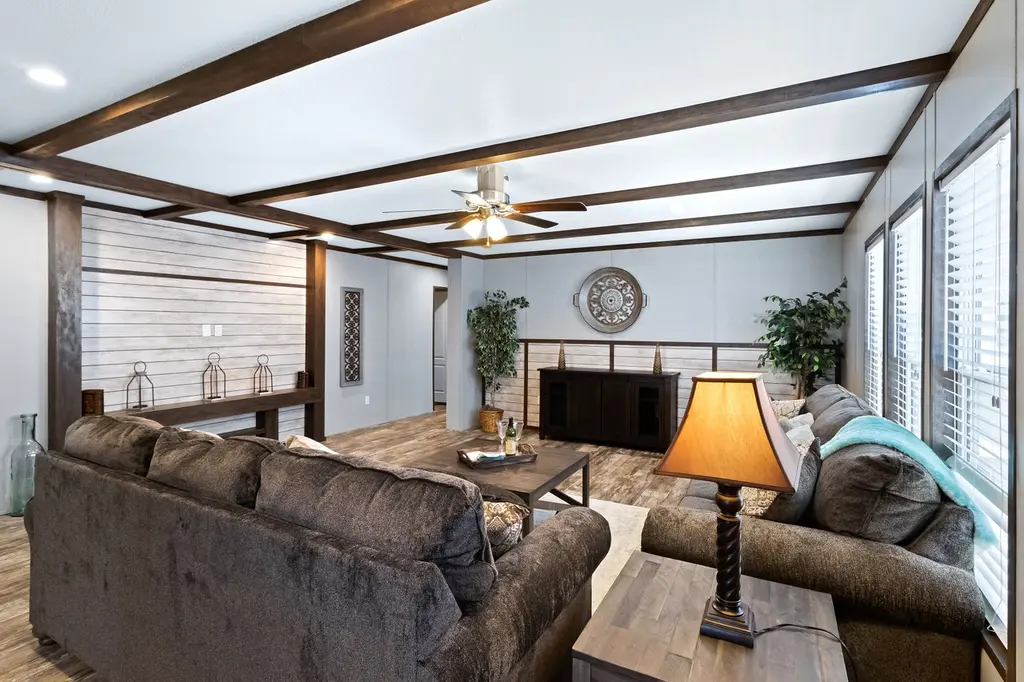
ELT32603A Plan · Splendora, TX
Flood risk No data
- FEMA flood zone
- —
- Chance of flooding over 30 yrs
- —
- Est. flood insurance / yr
- —
Fire risk No data
- Est. fire insurance / yr
- —
Heat risk No data
- Hot days now (above threshold)
- —
- Hot days in 30 yrs
- —
Wind risk No data
- Chance of severe wind over 30 yrs
- —
Air-quality risk No data
- Unhealthy air days now
- —
- Unhealthy air days in 30 yrs
- —
Risk factors via First Street. Map © Google.
Why this score? — see what drove the D grade
The composite is a weighted blend of 9 inputs, each scored 0–100. Each bar is that input's sub-score; the figure is the points it added to the 100-point composite (weight × sub-score).
- Cash flow +12.8/30.0
- ARV discount +7.5/15.0
- Condition / age +4.0/5.0
- DSCR +3.8/10.0
- 1% rule +3.6/10.0
- Livability +3.1/5.0
- Rent growth +2.5/5.0
- Schools +2.5/10.0
- Appreciation +1.8/10.0
$134,900
🖨 Deal sheet (PDF) 📄 Offer letter ✓ Due diligence
Listing remarks MLS
Skillfully designed affordable mid-size family home features extra large living room, bright modern door side country kitchen and dining room; large laundry/mud room; spacious master bedroom with glamorous ensuite featuring soaking tub, stall shower and double sinks; king size guest bedrooms and well located second bath with tub shower combination.
Key facts
- Glamorous ensuite
- Listed 688 days
Tags
Neighborhood map
What this means for you Summary
Snapshot
- This is a 3-bed/2.0-bath manufactured listed at $135k. Condition is rated good.
Deal economics
- At list price, monthly cash flow is $-19 ($-227/yr) — negative.
- The deal already cash-flows at list — no discount required.
- Meets the 1% rule at list price ($2k rent vs $135k).
- Recommended offer: $119k (12.0% below list) — sets the bar for market timing.
Location & tenants
- Location reads 62/100 on livability (#911 in TX) — a middle-class / working-renter tenant base. Strengths: cost of living A+, housing A+; Watch: schools F, amenities F, commute F.
- Splendora ISD (rural): math 25% / reading 31% proficiency, ranked #648 of 826 in TX (top 78%) — low school quality limits family demand, transient renter base, plan for 1-2y turnover.
- Market conditions: 542 active listings in the ZIP; 3 comparable units currently listed for rent nearby; rentals leasing fast (median 11d on market — plan ~1-2 weeks tenant-placement turnaround); solid renter incomes; 13,259 units permitted in Montgomery County in 2024 (1,402 in 5+ unit buildings).
Forward outlook
- Local home prices are declining (-3.0%/yr); year-one equity from $2k of loan paydown is wiped out by about $7k of value loss. Plan a longer hold.
- Montgomery County population projected at +65% by 2050 — long-run rental-demand tailwind backs the buy-and-hold thesis.
Negotiation context
- It's been on market 688 days — a 12% lower offer ($119k) is reasonable based on typical stale-listing flexibility.
Risks & watch-outs
- Watch-outs: property tax is 2.5% of price.
Questions for the listing agent
- What do current leases actually rent for vs. the listed asking? Can we see a recent rent roll and the last 12 months of T-12 income?
- It's been on market 688 days. Have you received any prior offers? Is the seller open to a 12% concession, seller financing, or rate buy-down credit?
- Property tax is high relative to price — has the assessment been appealed recently, and will the sale trigger a re-assessment?
- Why hasn't it sold? Are there any deal-killer items the seller is aware of (foundation, flood, title, zoning, code violations)?
- Is there a deadline driving the sale (1031 exchange, divorce, estate, relocation)? That informs how much negotiation room exists.
- Schools are F-rated, which usually means shorter tenancies and higher turnover. Who's the typical renter profile here, and what's been the actual vacancy rate?
- The area grade is low — what's the realistic commute time and amenity access for the typical tenant pool here? Any planned neighborhood developments (good or bad) we should know about?
- What's the average days-on-market for RENTAL listings here right now (not sales)? A rising rental-DOM trend means longer vacancies and softer asking-rent achievability than the comps imply.
- What's the recent tenant-quality profile in this submarket — average credit score on applications, eviction rate, late-payment / NSF rate, and stable-employment percentage? A property-management company in the area should have these aggregated.
- How much new for-sale + rental construction is in the pipeline within 1–3 miles? Heavy new supply typically softens prices + rents 12–24 months out; constrained supply supports both.
Investment metrics
- 1% rule
- 0.86% ✗
- Cap rate
- 6.19%
- Cash-on-cash
- -0.36%
- DSCR
- 0.98
- GRM
- 9.6
CMA / ARV
- ARV (median comp)
- $226,957
- List price
- $134,900
- Delta
- -40.56%
- Verdict
- UNDERPRICED
- Comps
- 4 within 2.0 mi
Projected returns pro-forma
-3.0% appreciation · 3.0% rent growth · sell at horizon
- IRR
- -16.9%
- Equity multiple
- 0.40×
- Total profit
- $-37,953
- Equity at exit
- $33,840
- IRR
- -8.7%
- Equity multiple
- 0.46×
- Total profit
- $-34,482
- Equity at exit
- $19,623
Cash invested: $63,548 (down + closing). Projections, not guarantees.
Landlord ↔ Tenant lean methodology
- Overall (STATE)
- 87 Strongly Landlord-Friendly
- State Texas
- 87 Strongly Landlord-Friendly · R+5
- County
- — inherits STATE
- City
- — inherits STATE
ZIP-level market 77372
- Home prices YoY
- -2.1%
- Active inventory
- 542
- Price-to-rent
- 5.7×
Monthly cashflow live
- Estimated rent
- $1,961 medium interval (Pro) →
- Mortgage (P&I)
- −$1,190
- Tax est. 1.5%
- −$284 /mo · $3,404/yr
- Insurance
- −$95
- HOA
- −$0
- Vacancy / Maint / Mgmt
- −$412
- Net cashflow
- $-19
Break-even live
Sensitivity live
| Price | -10% $138 | -5% $59 | +0% $-19 | +5% $-97 | +10% $-176 |
|---|---|---|---|---|---|
| Rent | -10% $-174 | -5% $-96 | +0% $-19 | +5% $59 | +10% $136 |
| Rate | -1.0pp $95 | -0.5pp $39 | base $-19 | +0.5pp $-78 | +1.0pp $-138 |
UW: 25.0% down · 7.5% · 30yr · 1.5% tax · 5.0% vac · 8.0% maint · 8.0% mgmt
Financing live
Cash to close
- Down payment
- $56,739
- Closing costs
- $6,809
- Reserves months
- —
- Total cash needed
- —
Loan-product check · same deal, 3 products live
Conventional
25% down · 7.5% · 30yr
- Down + closing
- —
- Monthly P&I
- —
- Monthly cashflow
- —
- DSCR
- —
- Eligible?
- —
Personal DTI + credit; lowest rate.
DSCR
20% down · 8.5% · 30yr
- Down + closing
- —
- Monthly P&I
- —
- Monthly cashflow
- —
- DSCR
- —
- Eligible?
- —
No personal income docs; deal must DSCR.
Hard money
10% down · 12.0% · 12mo
- Down + closing
- —
- Monthly P&I
- —
- Monthly cashflow
- —
- DSCR
- —
- Eligible?
- —
Short-term bridge; refi at stabilization.
Rent comps 3 comps
| Address | Beds | Baths | Sqft | Rent | $/sqft | DOM | Units | Dist |
|---|---|---|---|---|---|---|---|---|
| 25625 Chestnut Ln Splendora, TX | 3.0 | 2.0 | 1572 | $1,675 | $1.07 | 25d | 1 | 1.10mi |
| 25687 Roy Rogers Ct Splendora, TX | 4.0 | 3.0 | 1607 | $1,895 | $1.18 | 5d | 1 | 1.42mi |
| 25687 Roy Rogers Ct Splendora, TX | 4.0 | 2.5 | 1968 | $1,983 | $1.01 | 11d | 1 | 1.42mi |
Listing history 15 events
-
2026-06-18days on market $134,900 Active 688 DOM
-
2026-06-17days on market $134,900 Active 687 DOM
-
2026-06-16days on market $134,900 Active 686 DOM
-
2026-06-15days on market $134,900 Active 685 DOM
-
2026-06-13days on market $134,900 Active 683 DOM
-
2026-06-13days on market $134,900 Active 682 DOM
-
2026-06-09days on market $134,900 Active 679 DOM
-
2026-06-08days on market $134,900 Active 678 DOM
-
2026-06-07days on market $134,900 Active 677 DOM
-
2026-06-04days on market $134,900 Active 674 DOM
-
2026-06-03days on market $134,900 Active 673 DOM
-
2026-06-02days on market $134,900 Active 672 DOM
-
2026-06-01days on market $134,900 Active 671 DOM
-
2026-05-31days on market $134,900 Active 670 DOM
-
2024-07-30$134,900 Active 350-char remark
Show marketing remark (350 chars)
Skillfully designed affordable mid-size family home features extra large living room, bright modern door side country kitchen and dining room; large laundry/mud room; spacious master bedroom with glamorous ensuite featuring soaking tub, stall shower and double sinks; king size guest bedrooms and well located second bath with tub shower combination.
ⓘ Source: listings_history table (triggers on properties + properties_extension) + one-shot
backfill from property_details.listing_events for pre-trigger history.
Nearby sold comps map
Loading sold comps map…
Walkable amenities ~0.75 mi
Loading nearby amenities…
Taxation est. · year 1
- Rental income
- $23,537
- − Mortgage interest
- −$12,713
- − Property taxes
- −$3,404
- − Insurance
- −$1,135
- − Repairs & maintenance
- −$1,883
- − Management
- −$1,883
- − Depreciation
- −$6,602
- Taxable loss
- −$4,084
- Est. tax savings @ 24.0%
- +$980
- After-tax cash flow
- $753/yr
For passive investors: Depreciation is non-cash, so a rental often shows a tax loss while cash-flowing — sheltering income. Rental losses are passive: they offset passive income freely, and up to $25,000/yr can offset ordinary (W-2) income if you actively participate and your MAGI is under $100k (phasing out to $0 by $150k); unused losses carry forward. On sale, claimed depreciation is recaptured at up to 25%, and gains may owe capital-gains tax (a 1031 exchange can defer both). Figures are a year-1 estimate at your 24.0% rate — not tax advice; consult a CPA.
Condition & rehab AI · 12 photos
This manufactured home is in good condition with modern finishes and a spacious layout. A fresh coat of paint and some minor updates could significantly enhance its appeal.
Value-add opportunities
- Both Paint interior walls — Fresh paint can make a home look more inviting and modern
- Both Replace window treatments — New blinds or curtains can improve curb appeal and privacy
- Both Install smart home devices — Enhances convenience and energy efficiency
Renovation cost estimate screening
Value-add ROI direction
- Both Paint interior walls — Fresh paint can make a home look more inviting and modern ↑
- Both Replace window treatments — New blinds or curtains can improve curb appeal and privacy ↑
- Both Install smart home devices — Enhances convenience and energy efficiency ↑
ⓘ Cost ranges are severity-bucket heuristics (US national rule-of-thumb). Get contractor quotes + a written scope before underwriting a rehab budget.
Schools (NCES district)
- District
- Splendora ISD
- NCES district ID
- 4841070
- Math proficiency
- 25% ▼ -8.00%
- Reading proficiency
- 31% ▼ -1.00%
- Median HH income
- $54,166
- Composite
- 24.92/100
- National rank
- #7572
- State rank
- #648 of 826 in TX
Livability — Splendora
- Score
- 62/100
- State rank
- #911
- US rank
- #16335
Category grades
Schools grade is shown separately in the Schools card above.
Census & demographics
- Census place
- Splendora, TX
- County
- Montgomery County · 663,713 people
- City population
- 14,367
- Metro
- Houston-The Woodlands-Sugar Land, TX
- Population (ZIP)
- 14,367
- Household income
- $79,085
- Rent vs Own
- Severe rent burden
- 135.0
Population outlook (Montgomery County) Hauer SSP2
- Today (2025)
- 713,896 people
- By 2030
- 805,263 · +12.8%
- By 2040
- 992,708 · +39.1%
- By 2050
- 1,179,590 · +65.2%
- By 2075
- 1,628,084 · +128.1%
- By 2100
- 1,937,880 · +171.5%
Race, ethnicity, and origin ACS 2023
- Neighborhood character
- Majority White (61%)
- Race & ethnicity
- White 61% Hispanic / Latino 36% Two or more races 9% Native American 1%
- Hispanic origin (detail)
- Mexican 32%
- Common ancestry
- Lithuanian 4% Italian 2% Slovak 1%
- Foreign-born
- 9% · Canada
- Languages at home
- 71% English-only · Spanish 28%
Political lean MEDSL · Montgomery
- 2024 margin
- Solid R (+45.5) · D 26.8% · R 72.3%
- 2008→2024 swing
- +7.2pp toward D · 2008: -52.7pp · 2024: -45.5pp
- All cycles
- 2024: R+45.5 2020: R+43.8 2016: R+51.4 2012: R+60.7 2008: R+52.7
Not yet ingested
- Civics
- —
Market trends
- HPI YoY
- ▼ -6.47%
- Current HPI
- 306.9962
- Rent YoY
- —
- Metro
- Houston-The Woodlands-Sugar Land, TX
- State GDP YoY
- ▲ 3.95%
- F500 in state
- 110
Industry mix (Fortune 500 HQ in TX)
| Industry | F500 HQs | Revenue |
|---|---|---|
| Energy | 16 | $1,198B |
|
||
| Technology | 5 | $198B |
|
||
| Engineering / Construction | 4 | $72B |
|
||
| Energy Services | 3 | $60B |
|
||
| Utilities | 3 | $41B |
|
||
| Healthcare | 2 | $330B |
|
||
Price history
1 event — show timeline
- 2024-07-30 Listed $134,900 Zillow
Cash-flow waterfall
monthlySold comps — $/sqft
last 12 mo · ≤1 miLoading sold comps…