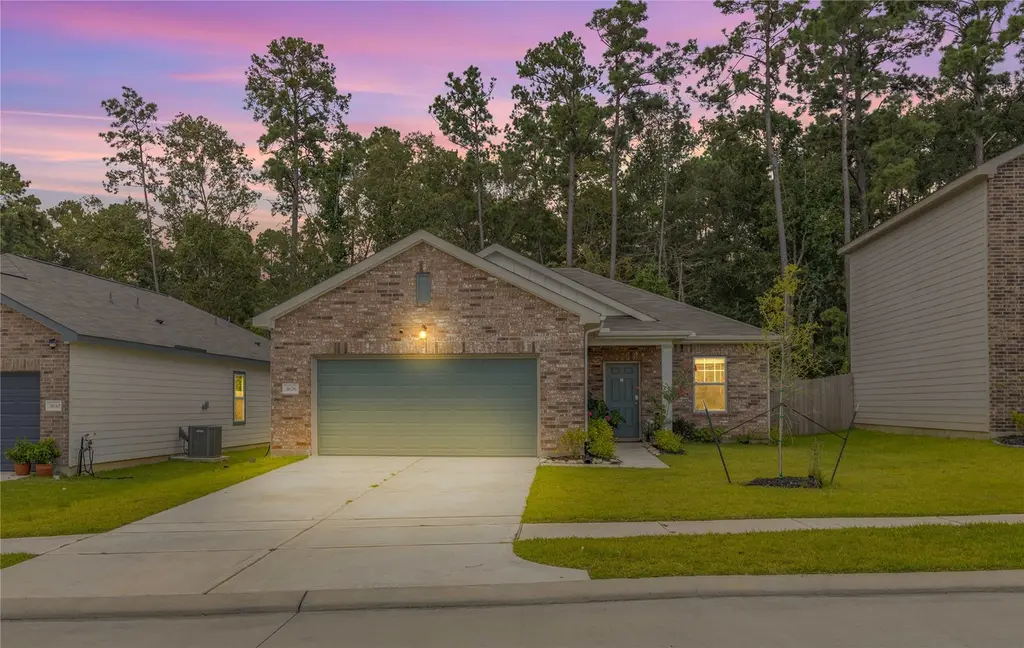
3626 Addington Ct · Houston, TX
Flood risk 1/10 · Minimal
- FEMA flood zone
- X (unshaded)
- Chance of flooding over 30 yrs
- 0.0%
- Est. flood insurance / yr
- $507 – $1,088
Fire risk 3/10 · Minor
- Est. fire insurance / yr
- $1,222 – $2,270
Heat risk 9/10 · Severe
- Hot days now (above 111°F)
- 7 days/yr
- Hot days in 30 yrs
- 23 days/yr
Wind risk 8/10 · Major
- Chance of severe wind over 30 yrs
- 99.0%
Air-quality risk 2/10 · Minimal
- Unhealthy air days now
- 1 days/yr
- Unhealthy air days in 30 yrs
- 2 days/yr
Risk factors via First Street. Map © Google.
Why this score? — see what drove the D grade
The composite is a weighted blend of 9 inputs, each scored 0–100. Each bar is that input's sub-score; the figure is the points it added to the 100-point composite (weight × sub-score).
- ARV discount +11.2/15.0
- Cash flow +9.2/30.0
- 1% rule +4.7/10.0
- Condition / age +4.0/5.0
- Livability +3.7/5.0
- Schools +3.1/10.0
- DSCR +2.6/10.0
- Rent growth +2.5/5.0
- Appreciation +0.7/10.0
$194,990
🖨 Deal sheet (PDF) 📄 Offer letter ✓ Due diligence
Listing remarks
Welcome to 3626 Addington Ct. This charming one-story home sits on a quiet cul-de-sac and was built in 2024! Still under the builder’s warranty, this 3-bedroom, 2-bathroom home features an open-concept layout with a spacious kitchen, dining, and family area that’s perfect for entertaining. The fully fenced backyard offers plenty of room, and best of all, no back neighbors! All appliances are included, making this home move-in ready. Energy-efficient features include a high-efficiency HVAC system, blown-in fiberglass insulation, Low-E windows, a digital thermostat, and attic vents. Located in a peaceful community with easy access to FM 2100, FM 1960 and HWY 99. Back on the ma
Key facts
- Low-e windows
- No back neighbors
- 5,967 sq ft lot
Tags
Property features AI
Finance
- Other: Community features include curbs and gutters
- HOA & community: Community association: Goodwin and Company; Association amenities include playground and park; Annual association fee
Exterior
- Parking: Attached garage; 2 garage spaces
- Security: Prewired for security; Leased security system; Smoke detectors
- Utilities: Public water; Public sewer
- Home design: Residential property; Built in 2024; Slab foundation; Composition roof; Brick and wood siding construction; Approximately 1,190 living area
- Construction: Brick and wood siding exterior; Composition roof; Slab foundation; Built by Starlight Homes
- Exterior features: Deck; Patio; Private yard; Fenced backyard; Located on a cul-de-sac; Subdivision setting; Concrete road access
Interior
- Kitchen: Dishwasher; Electric cooktop; Electric oven; Microwave; Disposal; Refrigerator
- Bedrooms: Primary bedroom on the first floor (approx. 14 x 11); Bedroom on the first floor (approx. 10 x 10); Bedroom on the first floor (approx. 10 x 9)
- Flooring: Carpet; Plank; Vinyl
- Bathrooms: 2 full bathrooms
- Heating & cooling: Central heating (electric); Central air conditioning (electric)
- Interior features: High ceilings; Kitchen and family room combo; Pantry; Programmable thermostat; Low emissivity windows; Ventilation system
- Laundry & utility: Washer hookup; Electric dryer hookup; Washer included; Dryer included
Neighborhood map
What this means for you Summary
Snapshot
- This is a 3-bed/2.0-bath single-family listed at $195k. Condition is rated good.
Deal economics
- At list price, monthly cash flow is $-147 ($-2k/yr) — negative.
- To cash-flow at today's rent, offer at most $169k (13.3% below list).
- To meet the 1% rule (rent ≥ 1% of price), the offer needs to be $188k (3.4% below list).
- Recommended offer: $169k (13.3% below list) — sets the bar for cash-flow.
- Cap rate 5.4% vs local median 3.2% in Houston — top-decile yield for the area; either an underpriced asset or a hidden risk that comps aren't pricing in. Stress-test before assuming the spread holds.
Location & tenants
- Location reads 74/100 on livability (#184 in TX, #4,771 nationally) — a middle-class / working-renter tenant base. Strengths: amenities A+, cost of living A+, housing A+; Watch: crime F.
- Huffman ISD (rural): math 32% / reading 35% proficiency, ranked #500 of 826 in TX (top 60%) — families likely to look elsewhere, expect single-tenant / working-renter base with shorter leases.
- Zoned schools: Falcon Ridge El (math 30% / reading 35%, grade F, #2,234 of 4,322 statewide, top 52%, 689 students, 49% FRL); Huffman Middle (math 36% / reading 32%, grade F, #892 of 1,662 statewide, top 55%, 907 students, 42% FRL); Hargrave H S (math 31% / reading 46%, grade F, #866 of 1,632 statewide, top 54%, 1,125 students, 36% FRL).
- Market conditions: 587 active listings in the ZIP; solid renter incomes; 29,883 units permitted in Harris County in 2024 (8,621 in 5+ unit buildings).
Forward outlook
- Local home prices are declining (-3.0%/yr); year-one equity from $1k of loan paydown is wiped out by about $6k of value loss. Plan a longer hold.
- Harris County population projected at +47% by 2050 — long-run rental-demand tailwind backs the buy-and-hold thesis.
Negotiation context
- It's been on market 60 days — a 3% lower offer ($189k) is reasonable based on typical stale-listing flexibility.
- 3 sale attempts with the ask held roughly flat each time — persistent listings suggest the price (not the market) is what's stuck; bring a comps-based counter.
Risks & watch-outs
- Watch-outs: property tax is 2.9% of price.
- Climate carrying-cost: severe wind risk, 99% chance of damaging wind over 30y; extreme-heat days projected 7→23/yr by 2055 (HVAC capex compounding) — expect insurance premiums to compound above CPI over the hold.
Questions for the listing agent
- What do current leases actually rent for vs. the listed asking? Can we see a recent rent roll and the last 12 months of T-12 income?
- It's been on market 60 days. Have you received any prior offers? Is the seller open to a 13% concession, seller financing, or rate buy-down credit?
- Property tax is high relative to price — has the assessment been appealed recently, and will the sale trigger a re-assessment?
- What does the HOA fee cover, when was the last increase, and are there any pending special assessments or reserve-fund shortfalls?
- Is there a deadline driving the sale (1031 exchange, divorce, estate, relocation)? That informs how much negotiation room exists.
- Schools are D-rated, which usually means shorter tenancies and higher turnover. Who's the typical renter profile here, and what's been the actual vacancy rate?
- Crime grade is F in this area — have there been break-ins, vandalism, or insurance claims at this property in the last 3 years? What carrier currently insures it and at what premium?
- The area grade is low — what's the realistic commute time and amenity access for the typical tenant pool here? Any planned neighborhood developments (good or bad) we should know about?
- What's the average days-on-market for RENTAL listings here right now (not sales)? A rising rental-DOM trend means longer vacancies and softer asking-rent achievability than the comps imply.
- What's the recent tenant-quality profile in this submarket — average credit score on applications, eviction rate, late-payment / NSF rate, and stable-employment percentage? A property-management company in the area should have these aggregated.
- How much new for-sale + rental construction is in the pipeline within 1–3 miles? Heavy new supply typically softens prices + rents 12–24 months out; constrained supply supports both.
Investment metrics
- 1% rule
- 0.97% ✗
- Cap rate
- 5.39%
- Cash-on-cash
- -3.23%
- DSCR
- 0.86
- GRM
- 8.6
CMA / ARV
- ARV (median comp)
- $212,349
- List price
- $194,990
- Delta
- -8.17%
- Verdict
- FAIR
- Comps
- 20 within 1.0 mi
Show comp detail 10 sales within ~0.75 mi
| Address | Dist | Beds/Ba | Sqft | Sold | Price | $/sf | Match |
|---|---|---|---|---|---|---|---|
| 28418 Selsdon Ct | 0.12mi | 3/2.0 | 1,206 (+1%) | 12mo | $189,990 | $158 | 82 |
| 3626 Addington Ct | 0.02mi | 3/2.0 | 1,206 (+1%) | 19mo | $219,990 | $182 | 81 |
| 3611 Addington Ct | 0.04mi | 3/2.0 | 1,206 (+1%) | 21mo | $249,990 | $207 | 79 |
| 3614 Admiralty Dr | 0.18mi | 3/2.0 | 1,206 (+1%) | 14mo | $199,990 | $166 | 78 |
| 3607 Admirality Dr | 0.21mi | 3/2.0 | 1,206 (+1%) | 14mo | $199,990 | $166 | 76 |
| 3519 Bishops Terrace Dr | 0.11mi | 3/2.0 | 1,206 (+1%) | 21mo | $219,990 | $182 | 75 |
| 28634 Oakden Ct | 0.36mi | 3/2.0 | 1,228 (+3%) | 19mo | $129,900 | $106 | 62 |
| 3538 Dryburgh Ct | 0.33mi | 3/2.0 | 1,366 (+15%) | 7mo | $177,900 | $130 | 54 |
| 28618 Islington Dr | 0.32mi | 3/2.0 | 1,366 (+15%) | 13mo | $170,000 | $124 | 50 |
| 3634 Kennington Ct | 0.33mi | 3/2.0 | 1,366 (+15%) | 16mo | $177,499 | $130 | 47 |
Match score weights: distance 35% · size 25% · config 20% · recency 20%. Top-matched comps best support the ARV.
Projected returns pro-forma
-3.0% appreciation · 3.0% rent growth · sell at horizon
- IRR
- -21.5%
- Equity multiple
- 0.25×
- Total profit
- $-40,743
- Equity at exit
- $29,074
- IRR
- -14.9%
- Equity multiple
- 0.14×
- Total profit
- $-46,687
- Equity at exit
- $16,859
Cash invested: $54,597 (down + closing). Projections, not guarantees.
Landlord ↔ Tenant lean methodology
- Overall (STATE)
- 87 Strongly Landlord-Friendly
- State Texas
- 87 Strongly Landlord-Friendly · R+5
- County
- — inherits STATE
- City
- — inherits STATE
ZIP-level market 77336
- Home prices YoY
- -1.8%
- Active inventory
- 587
- Price-to-rent
- 8.6×
Monthly cashflow live
- Estimated rent
- $1,883 medium interval (Pro) →
- Mortgage (P&I)
- −$1,023
- Tax from tax record
- −$472 /mo · $5,670/yr
- Insurance
- −$81
- HOA
- −$58
- Vacancy / Maint / Mgmt
- −$395
- Net cashflow
- $-147
Break-even live
Sensitivity live
| Price | -10% $-36 | -5% $-92 | +0% $-147 | +5% $-202 | +10% $-257 |
|---|---|---|---|---|---|
| Rent | -10% $-296 | -5% $-221 | +0% $-147 | +5% $-72 | +10% $2 |
| Rate | -1.0pp $-49 | -0.5pp $-97 | base $-147 | +0.5pp $-197 | +1.0pp $-249 |
UW: 25.0% down · 7.5% · 30yr · 1.5% tax · 5.0% vac · 8.0% maint · 8.0% mgmt
Financing live
Cash to close
- Down payment
- $48,748
- Closing costs
- $5,850
- Reserves months
- —
- Total cash needed
- —
Loan-product check · same deal, 3 products live
Conventional
25% down · 7.5% · 30yr
- Down + closing
- —
- Monthly P&I
- —
- Monthly cashflow
- —
- DSCR
- —
- Eligible?
- —
Personal DTI + credit; lowest rate.
DSCR
20% down · 8.5% · 30yr
- Down + closing
- —
- Monthly P&I
- —
- Monthly cashflow
- —
- DSCR
- —
- Eligible?
- —
No personal income docs; deal must DSCR.
Hard money
10% down · 12.0% · 12mo
- Down + closing
- —
- Monthly P&I
- —
- Monthly cashflow
- —
- DSCR
- —
- Eligible?
- —
Short-term bridge; refi at stabilization.
HOA detail
- Monthly dues
- $58 · $696/yr
Listing history 20 events
-
2026-06-21days on market $194,990 Active 60 DOM
-
2026-06-18days on market $194,990 Active 57 DOM
-
2026-06-17days on market $194,990 Active 56 DOM
-
2026-06-16days on market $194,990 Active 55 DOM
-
2026-06-15days on market $194,990 Active 54 DOM
-
2026-06-13days on market $194,990 Active 52 DOM
-
2026-06-09days on market $194,990 Active 48 DOM
-
2026-06-08days on market $194,990 Active 47 DOM
-
2026-06-07days on market $194,990 Active 46 DOM
-
2026-06-04days on market $194,990 Active 43 DOM
-
2026-06-03days on market $194,990 Active 42 DOM
-
2026-06-02days on market $194,990 Active 41 DOM
-
2026-06-01days on market $194,990 Active 40 DOM
-
2026-05-31days on market $194,990 Active 39 DOM
-
2026-04-22$194,990 Active 797-char remark
-
2026-03-01historical
-
2025-09-19status Active
-
2025-09-18historical
-
2025-09-04price $194,990
-
2025-09-04$194,000 Active
ⓘ Source: listings_history table (triggers on properties + properties_extension) + one-shot
backfill from property_details.listing_events for pre-trigger history.
Tax reassessment forecast TX · Resets to sale price
- Current annual tax
- $5,670 · $472/mo
- Projected year-2 tax
- $5,670 · $472/mo
- Expected delta
- $0/yr ($0/mo · 0.0%)
ⓘ Screening estimate from a state-policy table — verify with the county assessor before closing.
Climate risk First Street
- Flood 1/10 Low FEMA zone X (unshaded) · 0% chance over 30 yrs
- Wildfire 3/10 Moderate
- Heat 9/10 Extreme 7 d/yr ≥111°F today · 23 d/yr by 30 yrs out
- Wind 8/10 Severe 99% chance of damaging wind over 30 yrs
- Air quality 2/10 Low 1 unhealthy d/yr today · 2 by 30 yrs out
Nearby sold comps map
Loading sold comps map…
Walkable amenities ~0.75 mi
Loading nearby amenities…
Taxation est. · year 1
- Rental income
- $22,594
- − Mortgage interest
- −$10,922
- − Property taxes
- −$5,670
- − Insurance
- −$975
- − Repairs & maintenance
- −$1,808
- − Management
- −$1,808
- − HOA
- −$696
- − Depreciation
- −$5,672
- Taxable loss
- −$4,956
- Est. tax savings @ 24.0%
- +$1,190
- After-tax cash flow
- $-572/yr
For passive investors: Depreciation is non-cash, so a rental often shows a tax loss while cash-flowing — sheltering income. Rental losses are passive: they offset passive income freely, and up to $25,000/yr can offset ordinary (W-2) income if you actively participate and your MAGI is under $100k (phasing out to $0 by $150k); unused losses carry forward. On sale, claimed depreciation is recaptured at up to 25%, and gains may owe capital-gains tax (a 1031 exchange can defer both). Figures are a year-1 estimate at your 24.0% rate — not tax advice; consult a CPA.
Condition & rehab AI · 6 photos
This move-in ready, one-story home on a quiet cul-de-sac features an open-concept layout, modern appliances, and energy-efficient features. It offers a good condition score and is ready for minor updates to enhance its value further.
Value-add opportunities
- Both Painting exterior and interior walls — Fresh paint enhances curb appeal and interior aesthetics.
- Both Landscaping improvements — Enhances curb appeal and adds value to the property.
- Both Replace worn-out flooring — Hardwood floors are in good condition, but replacing them could add value and appeal.
- Both Upgrade kitchen appliances — Modern appliances are present, but upgrading them could add value and appeal.
- Both Install smart home features — Adding smart home features can increase both resale and rental value by enhancing convenience and energy efficiency.
Renovation cost estimate screening
Value-add ROI direction
- Both Painting exterior and interior walls — Fresh paint enhances curb appeal and interior aesthetics. ↑
- Both Landscaping improvements — Enhances curb appeal and adds value to the property. ↑
- Both Replace worn-out flooring — Hardwood floors are in good condition, but replacing them could add value and appeal. ↑
- Both Upgrade kitchen appliances — Modern appliances are present, but upgrading them could add value and appeal. ↑
- Both Install smart home features — Adding smart home features can increase both resale and rental value by enhancing convenience and energy efficiency. ↑
ⓘ Cost ranges are severity-bucket heuristics (US national rule-of-thumb). Get contractor quotes + a written scope before underwriting a rehab budget.
Schools (NCES district)
- District
- Huffman ISD
- NCES district ID
- 4823820
- Math proficiency
- 32% ▼ -9.00%
- Reading proficiency
- 35% ▼ -9.00%
- Median HH income
- $65,848
- Composite
- 30.61/100
- National rank
- #6195
- State rank
- #500 of 826 in TX
Livability — Houston
- Score
- 74/100
- State rank
- #184
- US rank
- #4771
Category grades
Schools grade is shown separately in the Schools card above.
Census & demographics
- County
- Harris County · 4,702,590 people
- City population
- 3,226,434
- Metro
- Houston-The Woodlands-Sugar Land, TX
- Population (ZIP)
- 14,342
- Household income
- $96,404
- Rent vs Own
- Severe rent burden
- 377.0
Population outlook (Harris County) Hauer SSP2
- Today (2025)
- 5,571,493 people
- By 2030
- 6,089,821 · +9.3%
- By 2040
- 7,142,806 · +28.2%
- By 2050
- 8,185,864 · +46.9%
- By 2075
- 10,574,329 · +89.8%
- By 2100
- 12,109,958 · +117.4%
Race, ethnicity, and origin ACS 2023
- Neighborhood character
- Majority White (65%)
- Race & ethnicity
- White 65% Hispanic / Latino 23% Two or more races 9% Black 5% Native American 4%
- Hispanic origin (detail)
- Mexican 20%
- Common ancestry
- Lithuanian 4% Slovak 2% Romanian 2%
- Foreign-born
- 9% · Canada
- Languages at home
- 79% English-only · Spanish 18% Other Indo-European 2%
Political lean MEDSL · Harris
- 2024 margin
- Lean D (+5.5) · D 52.0% · R 46.4% · Other 1.6%
- 2008→2024 swing
- +3.9pp toward D · 2008: 1.6pp · 2024: 5.5pp
- All cycles
- 2024: D+5.5 2020: D+13.3 2016: D+12.4 2012: D+0.1 2008: D+1.6
Not yet ingested
- Civics
- —
Market trends
- HPI YoY
- ▼ -8.59%
- Current HPI
- 472.03
- Rent YoY
- —
- Metro
- Houston-The Woodlands-Sugar Land, TX
- State GDP YoY
- ▲ 3.95%
- F500 in state
- 110
Industry mix (Fortune 500 HQ in TX)
| Industry | F500 HQs | Revenue |
|---|---|---|
| Energy | 16 | $1,198B |
|
||
| Technology | 5 | $198B |
|
||
| Engineering / Construction | 4 | $72B |
|
||
| Energy Services | 3 | $60B |
|
||
| Utilities | 3 | $41B |
|
||
| Healthcare | 2 | $330B |
|
||
Price history
+0.5% since first listed6 events — show timeline
- 2026-04-22 Listed $194,990 HARMLS
- 2026-03-01 Listing Removed — HARMLS
- 2025-09-19 Relisted — HARMLS
- 2025-09-18 Listing Removed — HARMLS
- 2025-09-04 Price Changed $194,990 HARMLS
- 2025-09-04 Listed $194,000 HARMLS
Property tax history
+268.4%/yrLatest (2025): $5,670 · +1078.1% YoY. Source: county tax records.
Cash-flow waterfall
monthlySold comps — $/sqft
last 12 mo · ≤1 miLoading sold comps…