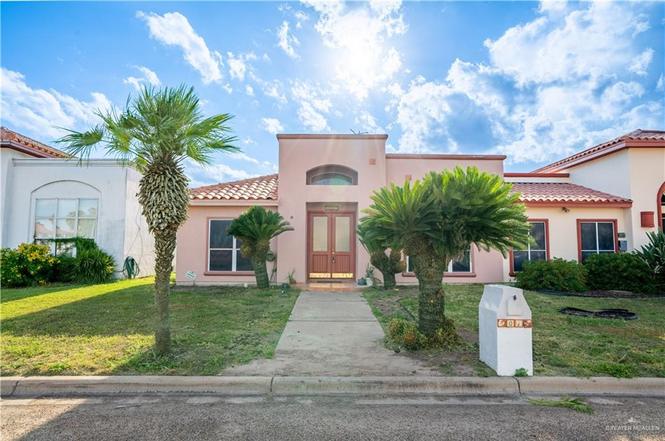
4018 Santo Cielo St · Weslaco, TX
Flood risk 1/10 · Minimal
- FEMA flood zone
- X (shaded)
- Chance of flooding over 30 yrs
- 0.0%
- Est. flood insurance / yr
- $507 – $1,088
Fire risk 6/10 · Moderate
- Est. fire insurance / yr
- $1,222 – $2,270
Heat risk 9/10 · Severe
- Hot days now (above 110°F)
- 7 days/yr
- Hot days in 30 yrs
- 23 days/yr
Wind risk 8/10 · Major
- Chance of severe wind over 30 yrs
- 99.0%
Air-quality risk 1/10 · Minimal
- Unhealthy air days now
- 0 days/yr
- Unhealthy air days in 30 yrs
- 0 days/yr
Risk factors via First Street. Map © Google.
Why this score? — see what drove the B+ grade
The composite is a weighted blend of 9 inputs, each scored 0–100. Each bar is that input's sub-score; the figure is the points it added to the 100-point composite (weight × sub-score).
- Cash flow +27.5/30.0
- ARV discount +14.7/15.0
- DSCR +9.7/10.0
- 1% rule +8.7/10.0
- Appreciation +4.7/10.0
- Livability +3.6/5.0
- Rent growth +2.5/5.0
- Condition / age +2.5/5.0
- Schools +2.2/10.0
$205,000
🖨 Deal sheet 📄 Offer letter ✓ Due diligence
Listing remarks
Welcome to 4018 Santo Cielo, a beautiful townhome in the exclusive Tierra Santa Golf Course Community in South Weslaco. Enjoy the security of a gated neighborhood and access to the large community pool. Love Golf food and drinks? This townhome is just steps from Tony's Grill this 2-bedroom, 2-bath home offers 1,544 sq ft of living space with high ceilings, freshly painted walls, and a semi-open concept kitchen, living, and dining areas. The property features a rear entry 2-car garage and a low HOA fee of only $83 per month. Perfect for comfort, convenience, and a vibrant community lifestyle.
Key facts
- Gated neighborhood
- Community pool
- $83 HOA
Tags
Neighborhood map
What this means for you Summary
Snapshot
- This is a 3-bed/2.0-bath single-family listed at $205k.
Deal economics
- At list price, monthly cash flow is $608 ($7k/yr) — positive.
- The deal already cash-flows at list — no discount required.
- Meets the 1% rule at list price ($3k rent vs $205k).
- Recommended offer: $180k (12.0% below list) — sets the bar for market timing.
- Cap rate 9.8% vs local median 4.1% in Weslaco — top-decile yield for the area; either an underpriced asset or a hidden risk that comps aren't pricing in. Stress-test before assuming the spread holds.
Location & tenants
- Location reads 72/100 on livability (#277 in TX) — a middle-class / working-renter tenant base. Strengths: cost of living A+, housing A+, health & safety A+; Watch: employment D+, crime F, amenities F.
- Weslaco ISD (suburban): math 23% / reading 31% proficiency, ranked #705 of 826 in TX (top 85%) — low school quality limits family demand, transient renter base, plan for 1-2y turnover.
- Zoned schools: Memorial El (math 40% / reading 50%, grade D-, #1,133 of 4,322 statewide, top 27%, 1,075 students, 67% FRL); Central Middle (math 33% / reading 40%, grade F, #786 of 1,662 statewide, top 48%, 974 students, 70% FRL); Weslaco H S (math 25% / reading 33%, grade F, #1,147 of 1,632 statewide, top 71%, 2,553 students, 73% FRL).
- Market conditions: 708 active listings in the ZIP; 1 comparable units currently listed for rent nearby; 7,378 units permitted in Hidalgo County in 2024 (641 in 5+ unit buildings).
Forward outlook
- In year one you build about $219 of equity ($1k loan paydown + $-1k appreciation (-0.6% local appreciation)).
- Hidalgo County population projected at +28% by 2050 — long-run rental-demand tailwind backs the buy-and-hold thesis.
- At projected returns (-0.6% appreciation + 3.0% rent growth), your $57k cash investment doubles in ~7 years — after that, you're playing with house money.
Negotiation context
- It's been on market 133 days — a 12% lower offer ($180k) is reasonable based on typical stale-listing flexibility.
- 2 sale attempts with the ask held roughly flat each time — persistent listings suggest the price (not the market) is what's stuck; bring a comps-based counter.
Risks & watch-outs
- Climate carrying-cost: severe wind risk, 99% chance of damaging wind over 30y; major wildfire risk; extreme-heat days projected 7→23/yr by 2055 (HVAC capex compounding) — expect insurance premiums to compound above CPI over the hold.
Questions for the listing agent
- It's been on market 133 days. Have you received any prior offers? Is the seller open to a 12% concession, seller financing, or rate buy-down credit?
- What does the HOA fee cover, when was the last increase, and are there any pending special assessments or reserve-fund shortfalls?
- Why hasn't it sold? Are there any deal-killer items the seller is aware of (foundation, flood, title, zoning, code violations)?
- Is there a deadline driving the sale (1031 exchange, divorce, estate, relocation)? That informs how much negotiation room exists.
- Crime grade is F in this area — have there been break-ins, vandalism, or insurance claims at this property in the last 3 years? What carrier currently insures it and at what premium?
- What's the average days-on-market for RENTAL listings here right now (not sales)? A rising rental-DOM trend means longer vacancies and softer asking-rent achievability than the comps imply.
- What's the recent tenant-quality profile in this submarket — average credit score on applications, eviction rate, late-payment / NSF rate, and stable-employment percentage? A property-management company in the area should have these aggregated.
- How much new for-sale + rental construction is in the pipeline within 1–3 miles? Heavy new supply typically softens prices + rents 12–24 months out; constrained supply supports both.
Investment metrics
- 1% rule
- 1.37% ✓
- Cap rate
- 9.85%
- Cash-on-cash
- 12.70%
- DSCR
- 1.57
- GRM
- 6.1
CMA / ARV
- ARV (on-the-fly)
- $243,952
- Comps found
- 12
Show comp detail 12 sales within ~0.75 mi
| Address | Dist | Beds/Ba | Sqft | Sold | Price | $/sf | Match |
|---|---|---|---|---|---|---|---|
| 3817 Santo Cielo St | 0.10mi | 3/2.0 | 1,575 (+2%) | 7mo | $249,900 | $159 | 86 |
| 3527 Sawgrass St | 0.30mi | 3/2.0 | 1,370 (-11%) | 3mo | $214,900 | $157 | 65 |
| 3523 Sawgrass St | 0.31mi | 3/2.0 | 1,333 (-14%) | 2mo | $207,000 | $155 | 61 |
| 3503 Emma Dr | 0.41mi | 3/2.0 | 1,400 (-9%) | 8mo | $225,500 | $161 | 59 |
| 3505 Pinehurst St | 0.35mi | 3/2.0 | 1,398 (-10%) | 11mo | $199,900 | $143 | 59 |
| 3409 Emma Dr | 0.52mi | 3/2.5 | 1,607 (+4%) | 10mo | $249,000 | $155 | 59 |
| 3506 Emma Dr | 0.47mi | 3/2.0 | 1,402 (-9%) | 6mo | $218,000 | $155 | 58 |
| 1421 Tierra Bella St | 0.32mi | 4/2.0 (+1) | 1,700 (+10%) | 7mo | $315,000 | $185 | 57 |
| 3617 Sawgrass St | 0.25mi | 3/2.0 | 1,370 (-11%) | 15mo | $219,500 | $160 | 57 |
| 3521 Pinehurst St | 0.29mi | 3/2.0 | 1,325 (-14%) | 19mo | $209,000 | $158 | 47 |
| 3501 Emma Dr | 0.45mi | 3/2.0 | 1,326 (-14%) | 19mo | $219,000 | $165 | 40 |
| 3407 Emma Dr | 0.51mi | 3/2.5 | 1,349 (-13%) | 18mo | $210,000 | $156 | 38 |
Match score weights: distance 35% · size 25% · config 20% · recency 20%. Top-matched comps best support the ARV.
Projected returns pro-forma
-0.58% appreciation · 3.0% rent growth · sell at horizon
- IRR
- 10.3%
- Equity multiple
- 1.48×
- Total profit
- $27,297
- Equity at exit
- $53,607
- IRR
- 15.9%
- Equity multiple
- 2.66×
- Total profit
- $95,014
- Equity at exit
- $59,887
Cash invested: $57,400 (down + closing). Projections, not guarantees.
Landlord ↔ Tenant lean methodology
- Overall (STATE)
- 87 Strongly Landlord-Friendly
- State Texas
- 87 Strongly Landlord-Friendly · R+5
- County
- — inherits STATE
- City
- — inherits STATE
ZIP-level market 78596
- Home prices YoY
- -0.2%
- Active inventory
- 708
- Price-to-rent
- 6.1×
Monthly cashflow live
- Estimated rent
- $2,800 medium interval (Pro) →
- Mortgage (P&I)
- −$1,075
- Tax from tax record
- −$361 /mo · $4,331/yr
- Insurance
- −$85
- HOA
- −$83
- Vacancy / Maint / Mgmt
- −$588
- Net cashflow
- $608
Break-even live
UW: 25.0% down · 7.5% · 30yr · 1.5% tax · 5.0% vac · 8.0% maint · 8.0% mgmt
Financing live
Cash to close
- Down payment
- $51,250
- Closing costs
- $6,150
- Reserves months
- —
- Total cash needed
- —
Loan-product check · same deal, 3 products live
Conventional
25% down · 7.5% · 30yr
- Down + closing
- —
- Monthly P&I
- —
- Monthly cashflow
- —
- DSCR
- —
- Eligible?
- —
Personal DTI + credit; lowest rate.
DSCR
20% down · 8.5% · 30yr
- Down + closing
- —
- Monthly P&I
- —
- Monthly cashflow
- —
- DSCR
- —
- Eligible?
- —
No personal income docs; deal must DSCR.
Hard money
10% down · 12.0% · 12mo
- Down + closing
- —
- Monthly P&I
- —
- Monthly cashflow
- —
- DSCR
- —
- Eligible?
- —
Short-term bridge; refi at stabilization.
Rent comps 1 comps
| Address | Beds | Baths | Sqft | Rent | $/sqft | DOM | Units | Dist |
|---|---|---|---|---|---|---|---|---|
| 3818 Tierra Escondida Weslaco, TX | 3.0 | 3.5 | 1846 | $2,800 | $1.52 | 44d | 1 | 0.43mi |
HOA detail
- Monthly dues
- $83 · $996/yr
- Likely covers
- poolsecurity
Listing history 9 events
-
2026-04-13status Pending
-
2026-04-12historical Option
-
2026-02-18price $205,000
-
2025-11-30$215,000 Active
-
2025-08-14$215,000 Active
-
2022-07-07soldstatus
-
2007-07-24soldstatus
-
2004-04-29soldstatus
-
2000-07-25soldstatus
ⓘ Source: listings_history table (triggers on properties + properties_extension) + one-shot
backfill from property_details.listing_events for pre-trigger history.
Tax reassessment forecast TX · Resets to sale price
- Current annual tax
- $4,331 · $361/mo
- Projected year-2 tax
- $4,331 · $361/mo
- Expected delta
- $0/yr ($0/mo · 0.0%)
ⓘ Screening estimate from a state-policy table — verify with the county assessor before closing.
Climate risk First Street
- Flood 1/10 Low FEMA zone X (shaded) · 0% chance over 30 yrs
- Wildfire 6/10 Major
- Heat 9/10 Extreme 7 d/yr ≥110°F today · 23 d/yr by 30 yrs out
- Wind 8/10 Severe 99% chance of damaging wind over 30 yrs
- Air quality 1/10 Low 0 unhealthy d/yr today · 0 by 30 yrs out
Nearby sold comps map
Loading sold comps map…
Walkable amenities ~0.75 mi
Loading nearby amenities…
Taxation est. · year 1
- Rental income
- $33,600
- − Mortgage interest
- −$11,483
- − Property taxes
- −$4,331
- − Insurance
- −$1,025
- − Repairs & maintenance
- −$2,688
- − Management
- −$2,688
- − HOA
- −$996
- − Depreciation
- −$5,964
- Taxable income
- $4,425
- Est. tax owed @ 24.0%
- −$1,062
- After-tax cash flow
- $6,229/yr
For passive investors: Depreciation is non-cash, so a rental often shows a tax loss while cash-flowing — sheltering income. Rental losses are passive: they offset passive income freely, and up to $25,000/yr can offset ordinary (W-2) income if you actively participate and your MAGI is under $100k (phasing out to $0 by $150k); unused losses carry forward. On sale, claimed depreciation is recaptured at up to 25%, and gains may owe capital-gains tax (a 1031 exchange can defer both). Figures are a year-1 estimate at your 24.0% rate — not tax advice; consult a CPA.
Schools (NCES district)
- District
- Weslaco ISD
- NCES district ID
- 4844960
- Math proficiency
- 23% ▼ -29.00%
- Reading proficiency
- 31% ▼ -9.00%
- Median HH income
- $32,867
- Composite
- 22.05/100
- National rank
- #8196
- State rank
- #705 of 826 in TX
Livability — Weslaco
- Score
- 72/100
- State rank
- #277
- US rank
- #6469
Category grades
Schools grade is shown separately in the Schools card above.
Census & demographics
- Census place
- Weslaco, TX
- Population (ZIP)
- 38,942
Population outlook (Hidalgo County) Hauer SSP2
- Today (2025)
- 955,232 people
- By 2030
- 1,009,774 · +5.7%
- By 2040
- 1,120,332 · +17.3%
- By 2050
- 1,225,036 · +28.2%
- By 2075
- 1,439,189 · +50.7%
- By 2100
- 1,533,429 · +60.5%
Race, ethnicity, and origin ACS 2023
- Neighborhood character
- Predominantly Hispanic (86%)
- Race & ethnicity
- Hispanic / Latino 86% Two or more races 38% White 13%
- Hispanic origin (detail)
- Mexican 82%
- Common ancestry
- Slovak 1%
- Foreign-born
- 17% · Canada
- Languages at home
- 27% English-only · Spanish 72%
Political lean MEDSL · Hidalgo
- 2024 margin
- Toss-up / Even · D 48.1% · R 51.0%
- 2008→2024 swing
- -41.6pp toward R · 2008: 38.7pp · 2024: -2.9pp
- All cycles
- 2024: R+2.9 2020: D+17.1 2016: D+40.5 2012: D+41.8 2008: D+38.7
Not yet ingested
- Civics
- —
Market trends
- HPI YoY
- ▼ -0.58%
- Current HPI
- 261.5117
- Rent YoY
- —
- Metro
- —
- State GDP YoY
- ▲ 3.95%
- F500 in state
- 110
Industry mix (Fortune 500 HQ in TX)
| Industry | F500 HQs | Revenue |
|---|---|---|
| Energy | 16 | $1,198B |
|
||
| Technology | 5 | $198B |
|
||
| Engineering / Construction | 4 | $72B |
|
||
| Energy Services | 3 | $60B |
|
||
| Utilities | 3 | $41B |
|
||
| Healthcare | 2 | $330B |
|
||
Price history
-4.7% since first listed9 events — show timeline
- 2026-04-13 Pending — MCALLENMLS
- 2026-04-12 Contingent — MCALLENMLS
- 2026-02-18 Price Changed $205,000 MCALLENMLS
- 2025-11-30 Listed $215,000 MCALLENMLS
- 2025-08-14 Listed $215,000 MCALLENMLS
- 2022-07-07 Sold (Public Records) — Public Records
- 2007-07-24 Sold (Public Records) — Public Records
- 2004-04-29 Sold (Public Records) — Public Records
- 2000-07-25 Sold (Public Records) — Public Records
Property tax history
+3.2%/yrLatest (2025): $4,331 · -2.9% YoY. Source: county tax records.
Cash-flow waterfall
monthlySold comps — $/sqft
last 12 mo · ≤1 miLoading sold comps…