 Duplex
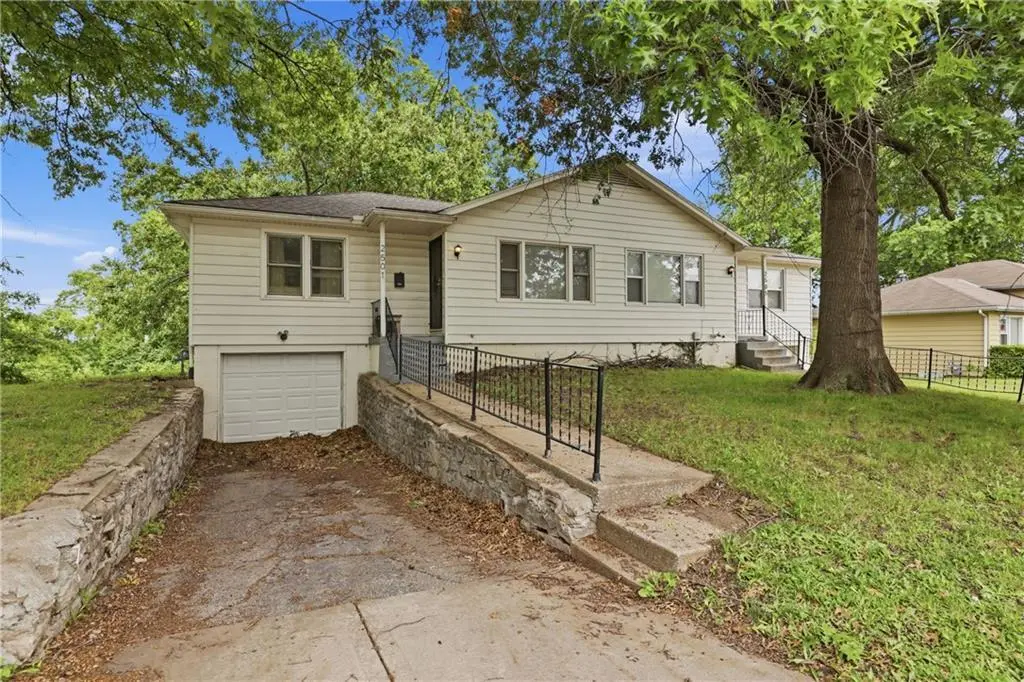
2501 Oakley Ave · Kansas City, MO
Flood risk 1/10 · Minimal
- FEMA flood zone
- X (unshaded)
- Chance of flooding over 30 yrs
- 0.0%
- Est. flood insurance / yr
- $473 – $860
Fire risk 1/10 · Minimal
- Est. fire insurance / yr
- $1,054 – $1,958
Heat risk 4/10 · Minor
- Hot days now (above 106°F)
- 7 days/yr
- Hot days in 30 yrs
- 16 days/yr
Wind risk 2/10 · Minimal
- Chance of severe wind over 30 yrs
- —
Air-quality risk 3/10 · Minor
- Unhealthy air days now
- 2 days/yr
- Unhealthy air days in 30 yrs
- 3 days/yr
Risk factors via First Street. Map © Google.
Why this score? — see what drove the B- grade
The composite is a weighted blend of 9 inputs, each scored 0–100. Each bar is that input's sub-score; the figure is the points it added to the 100-point composite (weight × sub-score).
- Cash flow +30.0/30.0
- DSCR +10.0/10.0
- 1% rule +7.7/10.0
- ARV discount +7.5/15.0
- Livability +3.9/5.0
- Rent growth +2.7/5.0
- Condition / age +2.5/5.0
- Schools +1.5/10.0
- Appreciation +1.1/10.0
$179,900
🖨 Deal sheet 📄 Offer letter ✓ Due diligence
Multi-family units
County records classify this as Multi-Family (2-4 Unit). Listing-text estimate: 2 units. confirmed
Listing remarks MLS
Fixer upper duplex. New roof was installed last month. Fenced yard, basement garages and off street parking for 6 cars. Situated on an interior street on a hill at the top of a hill. Previously leased at $600 a month, tenants paid all their own utilities and took care of the yards. Property is being sold AS IS. Buyers agent to verify all figures, numbers and estimates in marketing. Building is being sold AS IS.
Key facts
- New furnace
- New hot water heater
- Easy highway access
Tags
Property features AI
Finance
- Other: Current occupancy rate over 95%
- Financial info: Gross income reported as $16,680; Operating expenses include insurance and real estate taxes
- HOA & community: No association fees
Exterior
- Parking: Attached garage with space for 2 vehicles
- Utilities: Public water; Public sewer; Individual heat and air; Individual water heaters
- Home design: Residential income property (duplex); Single-story building
- Construction: Wood-frame construction; Composition roof
- Exterior features: Property not in a flood plain; Lot recorded as 10,650 square feet (public records)
Interior
- Kitchen: Appliances not specified
- Bedrooms: Three 2-bedroom units (each unit is 2-bedroom)
- Bathrooms: Each unit has 1 bathroom
- Heating & cooling: Natural gas heating; Electric cooling
- Interior features: Full basement; Individual heating and air systems; Individual water heaters
- Laundry & utility: Laundry details not specified
Neighborhood map
What this means for you Summary
Snapshot
- This is a 2 × 3-bed/1.5-bath units multifamily listed at $180k.
Deal economics
- At list price, monthly cash flow is $744 ($9k/yr) — positive. Per door: $372/mo.
- The deal already cash-flows at list — no discount required.
- Meets the 1% rule at list price ($2k rent vs $180k).
- Cap rate 11.3% vs local median 3.9% in Kansas City — top-decile yield for the area; either an underpriced asset or a hidden risk that comps aren't pricing in. Stress-test before assuming the spread holds.
Location & tenants
- Location reads 78/100 on livability (#28 in MO, #2,671 nationally) — a middle-class / working-renter tenant base. Strengths: amenities A+, commute A+, cost of living A+; Watch: schools C-, crime F.
- Kansas City 33 (urban): math 12% / reading 24% proficiency, ranked #308 of 324 in MO (top 95%) — low school quality limits family demand, transient renter base, plan for 1-2y turnover; 75% free/reduced lunch — lower-income household profile, screen leases tightly.
- Market conditions: Rents flat; 108 active listings in the ZIP; 16 comparable units currently listed for rent nearby; rentals at typical pace (median 16d on market — plan ~3-4 weeks tenant-placement turnaround); lower-income renter base — watch delinquency; 4,002 units permitted in Jackson County in 2024 (2,271 in 5+ unit buildings).
- At $2,282/mo this rent would consume 83% of the median local household income ($33k/yr) (locally 1943% of renters already pay >50% of income on rent) — very limited rent-growth headroom before tenants either downsize or default.
Forward outlook
- Local home prices are declining (-3.0%/yr); year-one equity from $1k of loan paydown is wiped out by about $5k of value loss. Plan a longer hold.
- Jackson County population projected at +4% by 2050 — modest demand growth; plan on rents tracking national, not racing it.
- At projected returns (-3.0% appreciation + 0.9% rent growth), your $50k cash investment doubles in ~8 years — after that, you're playing with house money.
Negotiation context
- Only 9 days on market — expect competitive offers; lowballing is unlikely to land.
- 7 sale attempts since 27y ago with the ask held roughly flat each time — persistent listings suggest the price (not the market) is what's stuck; bring a comps-based counter.
- Current owner paid $62k; list at $180k implies a 189% gain — meaningful room to come down on a strong offer.
Questions for the listing agent
- Can we see the unit-by-unit rent roll, current vacancy, and any below-market leases? What's the average tenancy length?
- What capital expenditures (roof, boiler, parking lot, exteriors) have been made in the last 5 years, and what's planned in the next 2?
- Built in 1961 — when were the roof, HVAC, electrical panel, plumbing, and water heater last replaced?
- Is there a deadline driving the sale (1031 exchange, divorce, estate, relocation)? That informs how much negotiation room exists.
- Crime grade is F in this area — have there been break-ins, vandalism, or insurance claims at this property in the last 3 years? What carrier currently insures it and at what premium?
- What's the average days-on-market for RENTAL listings here right now (not sales)? A rising rental-DOM trend means longer vacancies and softer asking-rent achievability than the comps imply.
- What's the recent tenant-quality profile in this submarket — average credit score on applications, eviction rate, late-payment / NSF rate, and stable-employment percentage? A property-management company in the area should have these aggregated.
- How much new apartment / multifamily construction is in the pipeline within 1–3 miles? Heavy new supply (>2% of stock underway) typically softens rents 12–24 months out; light construction supports rent growth.
Investment metrics
- 1% rule
- 1.27% ✓
- Cap rate
- 11.26%
- Cash-on-cash
- 17.74%
- DSCR
- 1.79
- GRM
- 6.6
CMA / ARV
No comps found within radius.
Projected returns pro-forma
-3.0% appreciation · 0.94% rent growth · sell at horizon
- IRR
- 7.0%
- Equity multiple
- 1.27×
- Total profit
- $13,551
- Equity at exit
- $26,824
- IRR
- 14.6%
- Equity multiple
- 2.08×
- Total profit
- $54,286
- Equity at exit
- $15,554
Cash invested: $50,372 (down + closing). Projections, not guarantees.
Landlord ↔ Tenant lean methodology
- Overall (STATE)
- 81 Strongly Landlord-Friendly
- State Missouri
- 81 Strongly Landlord-Friendly · R+10
- County
- — inherits STATE
- City
- — inherits STATE
ZIP-level market 64127
- Home prices YoY
- -2.6%
- Rents YoY
- 0.9%
- Active inventory
- 108
- Price-to-rent
- 13.1×
Monthly cashflow live
- Estimated rent
- $2,282 medium interval (Pro) →
- Mortgage (P&I)
- −$943
- Tax from tax record
- −$40 /mo · $479/yr
- Insurance
- −$75
- HOA
- −$0
- Vacancy / Maint / Mgmt
- −$479
- Net cashflow
- $744
Break-even live
2-unit breakdown (identical units grouped — click to expand)
| Units | Beds | Baths | Est. rent |
|---|---|---|---|
| 2× units | 3 | 1.5 | $2,282 |
| #1 | 3 | 1.5 | $1,141 |
| #2 | 3 | 1.5 | $1,141 |
| Total (2 units) | $2,282 | ||
UW: 25.0% down · 7.5% · 30yr · 1.5% tax · 5.0% vac · 8.0% maint · 8.0% mgmt
Financing live
Cash to close
- Down payment
- $44,975
- Closing costs
- $5,397
- Reserves months
- —
- Total cash needed
- —
Loan-product check · same deal, 3 products live
Conventional
25% down · 7.5% · 30yr
- Down + closing
- —
- Monthly P&I
- —
- Monthly cashflow
- —
- DSCR
- —
- Eligible?
- —
Personal DTI + credit; lowest rate.
DSCR
20% down · 8.5% · 30yr
- Down + closing
- —
- Monthly P&I
- —
- Monthly cashflow
- —
- DSCR
- —
- Eligible?
- —
No personal income docs; deal must DSCR.
Hard money
10% down · 12.0% · 12mo
- Down + closing
- —
- Monthly P&I
- —
- Monthly cashflow
- —
- DSCR
- —
- Eligible?
- —
Short-term bridge; refi at stabilization.
Rent comps 16 comps
| Address | Beds | Baths | Sqft | Rent | $/sqft | DOM | Units | Dist |
|---|---|---|---|---|---|---|---|---|
| 2855 Van Brunt Blvd Unit A Kansas City, MO | 2.0 | 1.0 | 744 | $1,080 | $1.45 | 43d | 1 | 0.47mi |
| 5108 E 30th St Kansas City, MO | 3.0 | 1.0 | 960 | $1,400 | $1.46 | 3d | 1 | 0.65mi |
| 2454 Cypress Ave Kansas City, MO | 3.0 | 1.0 | 800 | $1,300 | $1.62 | 4d | 1 | 0.76mi |
| 3243 Denver Dr Kansas City, MO | 1.0–3.0 | 1.0 | 862 | $1,088 | $1.26 | 43d | 1 | 0.92mi |
| 1616 Hardesty Ave Unit 1-108 Kansas City, MO | 1.0 | 1.0 | 634 | $1,150 | $1.81 | 21d | 1 | 0.93mi |
| 3032 Elmwood Ave Kansas City, MO | 3.0 | 1.0 | 1027 | $1,275 | $1.24 | 7d | 1 | 0.95mi |
| 3118 Chelsea Ave Kansas City, MO | 2.0 | 1.0 | 864 | $980 | $1.13 | 43d | 1 | 0.95mi |
| 2447 Norton Ave Kansas City, MO | 2.0 | 1.0 | 800 | $976 | $1.22 | 16d | 1 | 0.96mi |
| 2424 Norton Ave Unit B Kansas City, MO | 3.0 | 1.0 | 982 | $1,150 | $1.17 | 16d | 1 | 1.00mi |
| 1603 Elmwood Ave Kansas City, MO | 2.0 | 1.0 | 1064 | $1,031 | $0.97 | 12d | 1 | 1.12mi |
| 2225 Askew Ave Kansas City, MO | 2.0 | 1.0 | 864 | $1,050 | $1.22 | 43d | 1 | 1.31mi |
| 2213 Askew Ave Kansas City, MO | 2.0 | 1.0 | 865 | $1,002 | $1.16 | 19d | 1 | 1.32mi |
| 2419 Bales Ave Kansas City, MO | 3.0 | 1.5 | 1116 | $1,500 | $1.34 | 3d | 1 | 1.33mi |
| 6011 E 11th St Kansas City, MO | 3.0 | 1.0 | 900 | $1,200 | $1.33 | 16d | 1 | 1.43mi |
| 2413 College Ave Kansas City, MO | 2.0 | 2.0 | 1022 | $1,225 | $1.20 | 23d | 1 | 1.47mi |
| 3437 Jackson Ave Kansas City, MO | 2.0 | 1.0 | 700 | $1,150 | $1.64 | 16d | 1 | 1.48mi |
Listing history 24 events
-
2026-06-01status $179,900 Pending 9 DOM
-
2026-05-31days on market $179,900 Active 9 DOM
-
2026-05-22$179,900 Active
-
2019-06-04historical
-
2019-02-05price $134,950
-
2019-01-10$140,000 Active
-
2018-04-23soldstatus Sold 415-char remark
Show marketing remark (415 chars)
Fixer upper duplex. New roof was installed last month. Fenced yard, basement garages and off street parking for 6 cars. Situated on an interior street on a hill at the top of a hill. Previously leased at $600 a month, tenants paid all their own utilities and took care of the yards. Property is being sold AS IS. Buyers agent to verify all figures, numbers and estimates in marketing. Building is being sold AS IS.
-
2018-03-08status Pending 415-char remark
Show marketing remark (415 chars)
Fixer upper duplex. New roof was installed last month. Fenced yard, basement garages and off street parking for 6 cars. Situated on an interior street on a hill at the top of a hill. Previously leased at $600 a month, tenants paid all their own utilities and took care of the yards. Property is being sold AS IS. Buyers agent to verify all figures, numbers and estimates in marketing. Building is being sold AS IS.
-
2018-02-09status Active 415-char remark
Show marketing remark (415 chars)
Fixer upper duplex. New roof was installed last month. Fenced yard, basement garages and off street parking for 6 cars. Situated on an interior street on a hill at the top of a hill. Previously leased at $600 a month, tenants paid all their own utilities and took care of the yards. Property is being sold AS IS. Buyers agent to verify all figures, numbers and estimates in marketing. Building is being sold AS IS.
-
2017-12-08status Pending 415-char remark
Show marketing remark (415 chars)
Fixer upper duplex. New roof was installed last month. Fenced yard, basement garages and off street parking for 6 cars. Situated on an interior street on a hill at the top of a hill. Previously leased at $600 a month, tenants paid all their own utilities and took care of the yards. Property is being sold AS IS. Buyers agent to verify all figures, numbers and estimates in marketing. Building is being sold AS IS.
-
2017-08-30historical Contingent - Accepting Backup Offers 415-char remark
Show marketing remark (415 chars)
Fixer upper duplex. New roof was installed last month. Fenced yard, basement garages and off street parking for 6 cars. Situated on an interior street on a hill at the top of a hill. Previously leased at $600 a month, tenants paid all their own utilities and took care of the yards. Property is being sold AS IS. Buyers agent to verify all figures, numbers and estimates in marketing. Building is being sold AS IS.
-
2017-08-29$75,000 Active 415-char remark
Show marketing remark (415 chars)
Fixer upper duplex. New roof was installed last month. Fenced yard, basement garages and off street parking for 6 cars. Situated on an interior street on a hill at the top of a hill. Previously leased at $600 a month, tenants paid all their own utilities and took care of the yards. Property is being sold AS IS. Buyers agent to verify all figures, numbers and estimates in marketing. Building is being sold AS IS.
-
2016-09-02historical
-
2016-06-07$66,000 Active
-
2012-12-19soldstatus
-
2012-12-05soldstatus
-
2012-11-15soldstatus
-
2011-07-15soldstatus
-
2011-04-08$20,000
-
2010-06-22soldstatus $62,344
-
2000-01-14soldstatus
-
1999-10-25$65,000
-
1997-07-21soldstatus
-
1994-02-02soldstatus
ⓘ Source: listings_history table (triggers on properties + properties_extension) + one-shot
backfill from property_details.listing_events for pre-trigger history.
Tax reassessment forecast MO · Resets to sale price
- Current annual tax
- $479 · $40/mo
- Projected year-2 tax
- $1,745 · $145/mo
- Expected delta
- +$1,266/yr (+$105/mo · 264.2%)
ⓘ Screening estimate from a state-policy table — verify with the county assessor before closing.
Climate risk First Street
- Flood 1/10 Low FEMA zone X (unshaded) · 0% chance over 30 yrs
- Wildfire 1/10 Low
- Heat 4/10 Moderate 7 d/yr ≥106°F today · 16 d/yr by 30 yrs out
- Wind 2/10 Low
- Air quality 3/10 Moderate 2 unhealthy d/yr today · 3 by 30 yrs out
Nearby sold comps map
Loading sold comps map…
Walkable amenities ~0.75 mi
Loading nearby amenities…
Taxation est. · year 1
- Rental income
- $27,384
- − Mortgage interest
- −$10,077
- − Property taxes
- −$479
- − Insurance
- −$900
- − Repairs & maintenance
- −$2,191
- − Management
- −$2,191
- − Depreciation
- −$5,233
- Taxable income
- $6,313
- Est. tax owed @ 24.0%
- −$1,515
- After-tax cash flow
- $7,419/yr
For passive investors: Depreciation is non-cash, so a rental often shows a tax loss while cash-flowing — sheltering income. Rental losses are passive: they offset passive income freely, and up to $25,000/yr can offset ordinary (W-2) income if you actively participate and your MAGI is under $100k (phasing out to $0 by $150k); unused losses carry forward. On sale, claimed depreciation is recaptured at up to 25%, and gains may owe capital-gains tax (a 1031 exchange can defer both). Figures are a year-1 estimate at your 24.0% rate — not tax advice; consult a CPA.
Schools (NCES district)
- District
- Kansas City 33
- NCES district ID
- 2916400
- Math proficiency
- 12% ▼ -8.00%
- Reading proficiency
- 24% ▬ 0.00%
- Median HH income
- $35,227
- Composite
- 14.8/100
- National rank
- #9387
- State rank
- #308 of 324 in MO
Livability — Kansas City
- Score
- 78/100
- State rank
- #28
- US rank
- #2671
Category grades
Schools grade is shown separately in the Schools card above.
Census & demographics
- Census place
- Kansas City, MO
- County
- Jackson County · 687,798 people
- City population
- 439,467
- Metro
- Kansas City, MO-KS
- Population (ZIP)
- 17,668
- Household income
- $33,111
- Rent vs Own
- Severe rent burden
- 1943.0
Population outlook (Jackson County) Hauer SSP2
- Today (2025)
- 719,589 people
- By 2030
- 731,456 · +1.6%
- By 2040
- 746,689 · +3.8%
- By 2050
- 749,289 · +4.1%
- By 2075
- 736,227 · +2.3%
- By 2100
- 668,210 · -7.1%
Race, ethnicity, and origin ACS 2023
- Neighborhood character
- Diverse neighborhood (Simpson 0.65)
- Race & ethnicity
- Black 42% Hispanic / Latino 40% Two or more races 13% White 12% Native American 1%
- Hispanic origin (detail)
- Mexican 28%
- Foreign-born
- 20% · Canada, Vietnam
- Languages at home
- 67% English-only · Spanish 29%
Political lean MEDSL · Jackson
- 2024 margin
- D (+19.3) · D 58.9% · R 39.5% · Other 1.6%
- 2008→2024 swing
- -6.1pp toward R · 2008: 25.4pp · 2024: 19.3pp
- All cycles
- 2024: D+19.3 2020: D+22.0 2016: D+16.6 2012: D+19.0 2008: D+25.4
Not yet ingested
- Civics
- —
Market trends
- HPI YoY
- ▼ -7.88%
- Current HPI
- 289.2468
- Rent YoY
- ▲ 0.94%
- Metro
- Kansas City, MO-KS
- State GDP YoY
- ▲ 1.84%
- F500 in state
- 20
Industry mix (Fortune 500 HQ in MO)
| Industry | F500 HQs | Revenue |
|---|---|---|
| Healthcare | 1 | $163B |
|
||
| Insurance | 1 | $21B |
|
||
| Industrial Technology | 1 | $17B |
|
||
| Retail | 1 | $16B |
|
||
| Industrial Distribution | 1 | $10B |
|
||
| Utilities | 1 | $9B |
|
||
Price history
+176.8% since first listed22 events — show timeline
- 2026-05-22 Listed $179,900 Heartland MLS as Distributed by MLS Grid
- 2019-06-04 Listing Removed — Heartland MLS as Distributed by MLS Grid
- 2019-02-05 Price Changed $134,950 Heartland MLS as Distributed by MLS Grid
- 2019-01-10 Listed $140,000 Heartland MLS as Distributed by MLS Grid
- 2018-04-23 Sold (MLS) — Heartland MLS as Distributed by MLS Grid
- 2018-03-08 Pending — Heartland MLS as Distributed by MLS Grid
- 2018-02-09 Relisted — Heartland MLS as Distributed by MLS Grid
- 2017-12-08 Pending — Heartland MLS as Distributed by MLS Grid
- 2017-08-30 Contingent — Heartland MLS as Distributed by MLS Grid
- 2017-08-29 Listed $75,000 Heartland MLS as Distributed by MLS Grid
- 2016-09-02 Listing Removed — Heartland MLS as Distributed by MLS Grid
- 2016-06-07 Listed $66,000 Heartland MLS as Distributed by MLS Grid
- 2012-12-19 Sold (Public Records) — Public Records
- 2012-12-05 Sold (Public Records) — Public Records
- 2012-11-15 Sold (Public Records) — Public Records
- 2011-07-15 Sold (MLS) — Heartland MLS as Distributed by MLS Grid
- 2011-04-08 Listed $20,000 Heartland MLS as Distributed by MLS Grid
- 2010-06-22 Sold (Public Records) $62,344 Public Records
- 2000-01-14 Sold (MLS) — Heartland MLS as Distributed by MLS Grid
- 1999-10-25 Listed $65,000 Heartland MLS as Distributed by MLS Grid
- 1997-07-21 Sold (Public Records) — Public Records
- 1994-02-02 Sold (Public Records) — Public Records
Property tax history
+0.6%/yrLatest (2017): $479 · +2.2% YoY. Source: county tax records.
Cash-flow waterfall
monthlySold comps — $/sqft
last 12 mo · ≤1 miLoading sold comps…