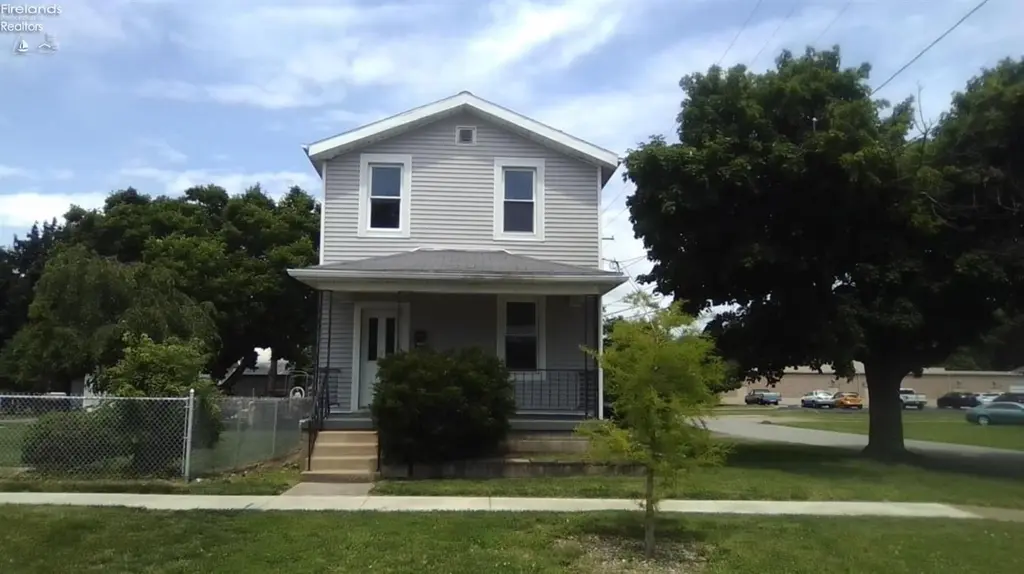
231 Lane St · Sandusky, OH
Flood risk 3/10 · Minor
- FEMA flood zone
- X (unshaded)
- Chance of flooding over 30 yrs
- 0.2%
- Est. flood insurance / yr
- $473 – $860
Fire risk 1/10 · Minimal
- Est. fire insurance / yr
- $713 – $1,323
Heat risk 3/10 · Minor
- Hot days now (above 95°F)
- 7 days/yr
- Hot days in 30 yrs
- 16 days/yr
Wind risk 2/10 · Minimal
- Chance of severe wind over 30 yrs
- —
Air-quality risk 2/10 · Minimal
- Unhealthy air days now
- 1 days/yr
- Unhealthy air days in 30 yrs
- 2 days/yr
Risk factors via First Street. Map © Google.
Why this score? — see what drove the B grade
The composite is a weighted blend of 9 inputs, each scored 0–100. Each bar is that input's sub-score; the figure is the points it added to the 100-point composite (weight × sub-score).
- Cash flow +30.0/30.0
- ARV discount +10.7/15.0
- DSCR +10.0/10.0
- 1% rule +9.1/10.0
- Livability +4.2/5.0
- Rent growth +2.5/5.0
- Schools +2.5/10.0
- Condition / age +2.5/5.0
- Appreciation +0.0/10.0
$125,000
🖨 Deal sheet 📄 Offer letter ✓ Due diligence
Listing remarks MLS
Ready for occupancy - this wonderful colonial features natural woodwork, unfinished basement with plenty of storage, newer cabinets, countertops, fresh paint, new neutral carpeting. Newer exterior door in rear. Some updated electrical. Kitchen is has lots of light and has plenty of cabinet, countertop space. Living room size is perfect for any oversized furnishings, entertaining. Bathroom good sized on second floor with some improvement. Front porch for watching the world and ample backyard space to add a garage or patio. Nearby local amenities are within minutes and of course, Cedar Point. Buyers recommended to investigate all data. See attachment for PAS requirements and WFHM offer submittal information in MLS document section.
Key facts
- Quiet street
- Home near lake erie
- Spacious kitchen
Tags
Property features AI
Exterior
- Utilities: Public water; Public sewer
- Home design: Single-family residential
- Construction: Aluminum and vinyl siding
- Exterior features: Asphalt roof
Interior
- Bathrooms: 1 full bathroom
- Heating & cooling: Natural gas forced-air heating
- Interior features: Partially finished basement; 6 total rooms
Neighborhood map
What this means for you Summary
Snapshot
- This is a 3-bed/1.0-bath single-family listed at $125k.
Deal economics
- At list price, monthly cash flow is $629 ($8k/yr) — positive.
- The deal already cash-flows at list — no discount required.
- Meets the 1% rule at list price ($2k rent vs $125k).
- Cap rate 12.3% vs local median 5.4% in Sandusky — top-decile yield for the area; either an underpriced asset or a hidden risk that comps aren't pricing in. Stress-test before assuming the spread holds.
Location & tenants
- Location reads 83/100 on livability (#63 in OH, #929 nationally) — a professional / high-income tenant draw. Strengths: commute A+, cost of living A+, housing A+; Watch: crime D-, employment F.
- Sandusky City (town): math 24% / reading 37% proficiency, ranked #583 of 656 in OH (top 89%) — families likely to look elsewhere, expect single-tenant / working-renter base with shorter leases; 71% free/reduced lunch — lower-income household profile, screen leases tightly.
- Market conditions: 209 active listings in the ZIP; 3 comparable units currently listed for rent nearby; rentals lingering (median 44d on market — plan ~5-8 weeks vacancy on turnover, expect pricing pressure); 100% of comp listings sitting > 30 days — soft ceiling on asking rent; 128 units permitted in Erie County in 2024 (5 in 5+ unit buildings).
- This rent runs 34% of the median local income ($62k/yr) — at the standard rent-burdened threshold; future hikes will face affordability resistance.
Forward outlook
- Local home prices are declining (-3.0%/yr); year-one equity from $864 of loan paydown is wiped out by about $4k of value loss. Plan a longer hold.
- Erie County population projected at -15% by 2050 — secular population decline; favor cash flow + early exit over multi-decade hold.
- At projected returns (-3.0% appreciation + 3.0% rent growth), your $35k cash investment doubles in ~6 years — after that, you're playing with house money.
Negotiation context
- Only 7 days on market — expect competitive offers; lowballing is unlikely to land.
- 3 sale attempts since 12y ago with the ask held roughly flat each time — persistent listings suggest the price (not the market) is what's stuck; bring a comps-based counter.
- Current owner paid $17k; list at $125k implies a 633% gain — meaningful room to come down on a strong offer.
Risks & watch-outs
- Watch-outs: built in 1950 — expect roof / HVAC / electrical / plumbing capex.
Questions for the listing agent
- Built in 1950 — when were the roof, HVAC, electrical panel, plumbing, and water heater last replaced?
- Is there a deadline driving the sale (1031 exchange, divorce, estate, relocation)? That informs how much negotiation room exists.
- Crime grade is D in this area — have there been break-ins, vandalism, or insurance claims at this property in the last 3 years? What carrier currently insures it and at what premium?
- What's the average days-on-market for RENTAL listings here right now (not sales)? A rising rental-DOM trend means longer vacancies and softer asking-rent achievability than the comps imply.
- What's the recent tenant-quality profile in this submarket — average credit score on applications, eviction rate, late-payment / NSF rate, and stable-employment percentage? A property-management company in the area should have these aggregated.
- How much new for-sale + rental construction is in the pipeline within 1–3 miles? Heavy new supply typically softens prices + rents 12–24 months out; constrained supply supports both.
Investment metrics
- 1% rule
- 1.41% ✓
- Cap rate
- 12.33%
- Cash-on-cash
- 21.56%
- DSCR
- 1.96
- GRM
- 5.9
CMA / ARV
- ARV (on-the-fly)
- $134,520
- Comps found
- 12
Show comp detail 12 sales within ~0.75 mi
| Address | Dist | Beds/Ba | Sqft | Sold | Price | $/sf | Match |
|---|---|---|---|---|---|---|---|
| 405 E Parish St | 0.27mi | 3/1.0 | 1,189 (+4%) | 0mo | $174,000 | $146 | 80 |
| 1311 Franklin St | 0.36mi | 3/1.0 | 1,159 (+2%) | 4mo | $126,900 | $109 | 77 |
| 1304 E Parish St | 0.46mi | 3/1.0 | 1,116 (-2%) | 1mo | $95,000 | $85 | 74 |
| 306 Tyler St | 0.51mi | 3/1.0 | 1,136 (-0%) | 3mo | $130,000 | $114 | 73 |
| 1114 Wamajo Dr | 0.50mi | 3/1.0 | 1,196 (+5%) | 3mo | $140,000 | $117 | 66 |
| 1117 Ogontz St | 0.55mi | 2/1.0 (-1) | 1,148 (+1%) | 3mo | $201,000 | $175 | 66 |
| 1117 Buckingham St | 0.57mi | 3/1.0 | 1,232 (+8%) | 1mo | $185,000 | $150 | 59 |
| 1115 Fifth St | 0.64mi | 3/1.5 | 1,089 (-4%) | 5mo | $174,700 | $160 | 57 |
| 1003 5th St | 0.62mi | 3/1.0 | 1,232 (+8%) | 3mo | $165,000 | $134 | 55 |
| 421 Scott St | 0.55mi | 3/1.0 | 1,012 (-11%) | 2mo | $119,900 | $118 | 53 |
| 1230 Fifth St | 0.66mi | 3/2.0 | 1,206 (+6%) | 4mo | $125,000 | $104 | 52 |
| 1002 Sycamore Line | 0.66mi | 3/1.0 | 1,288 (+13%) | 3mo | $140,000 | $109 | 45 |
Match score weights: distance 35% · size 25% · config 20% · recency 20%. Top-matched comps best support the ARV.
Projected returns pro-forma
-3.0% appreciation · 3.0% rent growth · sell at horizon
- IRR
- 14.1%
- Equity multiple
- 1.56×
- Total profit
- $19,754
- Equity at exit
- $18,638
- IRR
- 22.9%
- Equity multiple
- 2.96×
- Total profit
- $68,630
- Equity at exit
- $10,808
Cash invested: $35,000 (down + closing). Projections, not guarantees.
Landlord ↔ Tenant lean methodology
- Overall (STATE)
- 73 Landlord-Friendly
- State Ohio
- 73 Landlord-Friendly · R+6
- County
- — inherits STATE
- City
- — inherits STATE
ZIP-level market 44870
- Active inventory
- 209
- Price-to-rent
- 5.9×
Monthly cashflow live
- Estimated rent
- $1,768 medium interval (Pro) →
- Mortgage (P&I)
- −$656
- Tax from tax record
- −$60 /mo · $724/yr
- Insurance
- −$52
- HOA
- −$0
- Vacancy / Maint / Mgmt
- −$371
- Net cashflow
- $629
Break-even live
UW: 25.0% down · 7.5% · 30yr · 1.5% tax · 5.0% vac · 8.0% maint · 8.0% mgmt
Financing live
Cash to close
- Down payment
- $31,250
- Closing costs
- $3,750
- Reserves months
- —
- Total cash needed
- —
Loan-product check · same deal, 3 products live
Conventional
25% down · 7.5% · 30yr
- Down + closing
- —
- Monthly P&I
- —
- Monthly cashflow
- —
- DSCR
- —
- Eligible?
- —
Personal DTI + credit; lowest rate.
DSCR
20% down · 8.5% · 30yr
- Down + closing
- —
- Monthly P&I
- —
- Monthly cashflow
- —
- DSCR
- —
- Eligible?
- —
No personal income docs; deal must DSCR.
Hard money
10% down · 12.0% · 12mo
- Down + closing
- —
- Monthly P&I
- —
- Monthly cashflow
- —
- DSCR
- —
- Eligible?
- —
Short-term bridge; refi at stabilization.
Rent comps 3 comps
| Address | Beds | Baths | Sqft | Rent | $/sqft | DOM | Units | Dist |
|---|---|---|---|---|---|---|---|---|
| 1107 1st St Unit 1496057P Sandusky, OH | 4.0 | 3.0 | 1151 | $6,631 | $5.76 | 43d | 1 | 0.87mi |
| 156 E Market St Sandusky, OH | 1.0–2.0 | 1.0–2.5 | 1266 | $3,539 | $2.79 | 43d | 5 | 1.22mi |
| 1515 W Perkins Ave Sandusky, OH | 2.0 | 1.0 | 925 | $925 | $1.00 | 43d | 1 | 1.29mi |
Listing history 7 events
-
2026-06-19days on market $125,000 Active 7 DOM
-
2026-06-18days on market $125,000 Active 6 DOM
-
2026-06-17days on market $125,000 Active 5 DOM
-
2026-06-16days on market $125,000 Active 4 DOM
-
2026-06-15days on market $125,000 Active 3 DOM
-
2026-06-13remarks 695-char remark
-
2026-06-13$125,000 Active 1 DOM
ⓘ Source: listings_history table (triggers on properties + properties_extension) + one-shot
backfill from property_details.listing_events for pre-trigger history.
Tax reassessment forecast OH · Partial reset (capped growth)
- Current annual tax
- $724 · $60/mo
- Projected year-2 tax
- $1,337 · $111/mo
- Expected delta
- +$613/yr (+$51/mo · 84.7%)
ⓘ Screening estimate from a state-policy table — verify with the county assessor before closing.
Climate risk First Street
- Flood 3/10 Moderate FEMA zone X (unshaded) · 20% chance over 30 yrs
- Wildfire 1/10 Low
- Heat 3/10 Moderate 7 d/yr ≥95°F today · 16 d/yr by 30 yrs out
- Wind 2/10 Low
- Air quality 2/10 Low 1 unhealthy d/yr today · 2 by 30 yrs out
Nearby sold comps map
Loading sold comps map…
Walkable amenities ~0.75 mi
Loading nearby amenities…
Taxation est. · year 1
- Rental income
- $21,214
- − Mortgage interest
- −$7,002
- − Property taxes
- −$724
- − Insurance
- −$625
- − Repairs & maintenance
- −$1,697
- − Management
- −$1,697
- − Depreciation
- −$3,636
- Taxable income
- $5,833
- Est. tax owed @ 24.0%
- −$1,400
- After-tax cash flow
- $6,144/yr
For passive investors: Depreciation is non-cash, so a rental often shows a tax loss while cash-flowing — sheltering income. Rental losses are passive: they offset passive income freely, and up to $25,000/yr can offset ordinary (W-2) income if you actively participate and your MAGI is under $100k (phasing out to $0 by $150k); unused losses carry forward. On sale, claimed depreciation is recaptured at up to 25%, and gains may owe capital-gains tax (a 1031 exchange can defer both). Figures are a year-1 estimate at your 24.0% rate — not tax advice; consult a CPA.
Schools (NCES district)
- District
- Sandusky City
- NCES district ID
- 3904474
- Math proficiency
- 24% ▼ -17.00%
- Reading proficiency
- 37% ▼ -9.00%
- Median HH income
- $34,583
- Composite
- 25.1/100
- National rank
- #7532
- State rank
- #583 of 656 in OH
Livability — Sandusky
- Score
- 83/100
- State rank
- #63
- US rank
- #929
Category grades
Schools grade is shown separately in the Schools card above.
Census & demographics
- Census place
- Sandusky, OH
- County
- Erie County · 39,883 people
- City population
- 39,883
- Metro
- Sandusky, OH
- Population (ZIP)
- 39,883
- Household income
- $62,082
- Rent vs Own
- Severe rent burden
- 1602.0
Population outlook (Erie County) Hauer SSP2
- Today (2025)
- 73,204 people
- By 2030
- 71,341 · -2.5%
- By 2040
- 66,771 · -8.8%
- By 2050
- 62,512 · -14.6%
- By 2075
- 56,154 · -23.3%
- By 2100
- 49,045 · -33.0%
Race, ethnicity, and origin ACS 2023
- Neighborhood character
- Predominantly White (72%)
- Race & ethnicity
- White 72% Black 15% Two or more races 8% Hispanic / Latino 5%
- Common ancestry
- Romanian 3% Slovak 2% Subsaharan African 1%
- Foreign-born
- 1% · Canada
- Languages at home
- 96% English-only · Spanish 2%
Political lean MEDSL · Erie
- 2024 margin
- R (+14.1) · D 42.5% · R 56.6%
- 2008→2024 swing
- -28.0pp toward R · 2008: 13.9pp · 2024: -14.1pp
- All cycles
- 2024: R+14.1 2020: R+11.6 2016: R+9.8 2012: D+11.3 2008: D+13.9
Not yet ingested
- Civics
- —
Market trends
- HPI YoY
- ▼ -151.99%
- Current HPI
- 209.6383
- Rent YoY
- —
- Metro
- Sandusky, OH
- State GDP YoY
- ▲ 1.98%
- F500 in state
- 48
Industry mix (Fortune 500 HQ in OH)
| Industry | F500 HQs | Revenue |
|---|---|---|
| Insurance | 3 | $145B |
|
||
| Industrial Machinery | 3 | $49B |
|
||
| Financial Services | 3 | $24B |
|
||
| Consumer Goods | 2 | $93B |
|
||
| Aerospace / Defense | 2 | $47B |
|
||
| Utilities | 2 | $33B |
|
||
Price history
+657.6% since first listed5 events — show timeline
- 2026-06-12 Listed $125,000 FAOR
- 2015-03-25 Sold (MLS) $17,053 FAOR
- 2015-03-24 Sold (MLS) $17,053 MLSNOW
- 2014-12-05 Listed $16,500 MLSNOW
- 2014-12-05 Listed $16,500 FAOR
Property tax history
+13.0%/yrLatest (2025): $724 · -3.3% YoY. Source: county tax records.
Cash-flow waterfall
monthlySold comps — $/sqft
last 12 mo · ≤1 miLoading sold comps…