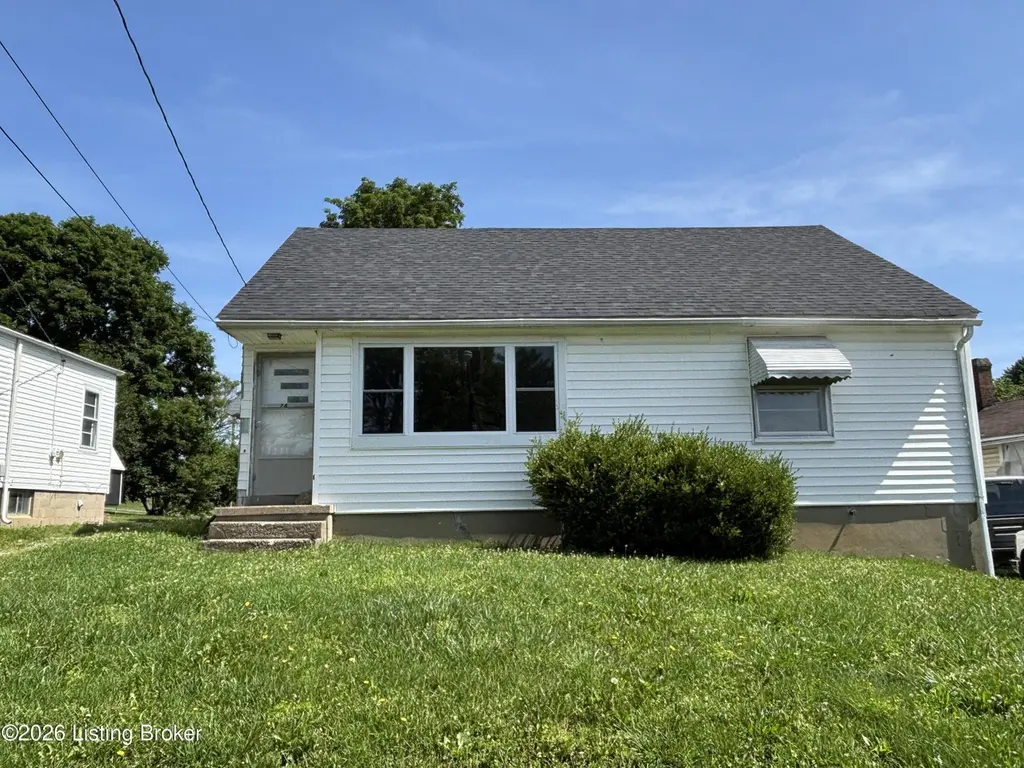
24 College St · New Castle, KY
Flood risk 1/10 · Minimal
- FEMA flood zone
- X (unshaded)
- Chance of flooding over 30 yrs
- 0.0%
- Est. flood insurance / yr
- $473 – $860
Fire risk 3/10 · Minor
- Est. fire insurance / yr
- $839 – $1,559
Heat risk 5/10 · Moderate
- Hot days now (above 103°F)
- 7 days/yr
- Hot days in 30 yrs
- 21 days/yr
Wind risk 2/10 · Minimal
- Chance of severe wind over 30 yrs
- 2.0%
Air-quality risk 2/10 · Minimal
- Unhealthy air days now
- 1 days/yr
- Unhealthy air days in 30 yrs
- 2 days/yr
Risk factors via First Street. Map © Google.
Why this score? — see what drove the D+ grade
The composite is a weighted blend of 9 inputs, each scored 0–100. Each bar is that input's sub-score; the figure is the points it added to the 100-point composite (weight × sub-score).
- Cash flow +16.9/30.0
- ARV discount +7.5/15.0
- DSCR +5.2/10.0
- Appreciation +5.0/10.0
- 1% rule +3.9/10.0
- Livability +3.0/5.0
- Schools +2.9/10.0
- Rent growth +2.5/5.0
- Condition / age +2.5/5.0
$125,000
🖨 Deal sheet 📄 Offer letter ✓ Due diligence
Listing remarks
A SPECIAL FOR INVESTORS! Make this charming cape cod house your next project. Located in the heart of New Castle, this home features original hardwood floors. The first floor offers two bedrooms, a full bathroom, a spacious living area with a picture window, and an eat in kitchen. Upstairs is a spacious bedroom. All of this sets on a walk up, unfinished basement.
Key facts
- Spacious living area
- Eat in kitchen
- Cape cod house
Tags
Property features AI
Finance
- HOA & community: No association fee
Exterior
- Parking: Driveway parking
- Utilities: Electricity connected; Natural gas
- Home design: Single-family Cape Cod; Two stories; Built in 1957; Entry level includes first and second floors
- Construction: Vinyl siding; Shingle roof; Concrete block foundation
- Exterior features: Lot is approximately 0.11 acres
Interior
- Kitchen: Kitchen on the first floor
- Bedrooms: Three bedrooms (two on the first floor, one on the second floor); Primary bedroom on the first floor
- Bathrooms: One full bathroom
- Heating & cooling: Natural gas heating; Central air conditioning; One HVAC unit
- Interior features: Five total rooms; Unfinished basement
- Laundry & utility: No first-floor laundry
Neighborhood map
What this means for you Summary
Snapshot
- This is a 2-bed/1.0-bath other listed at $125k.
Deal economics
- At list price, monthly cash flow is $82 ($980/yr) — positive.
- The deal already cash-flows at list — no discount required.
- To meet the 1% rule (rent ≥ 1% of price), the offer needs to be $111k (11.3% below list).
- Recommended offer: $111k (11.3% below list) — sets the bar for 1% rule.
Location & tenants
- Location reads 60/100 on livability (#385 in KY) — a middle-class / working-renter tenant base. Strengths: crime A+, cost of living A+, housing A-; Watch: schools D-, amenities F, commute F.
- Henry County (rural): math 30% / reading 38% proficiency, ranked #68 of 165 in KY (top 41%) — families likely to look elsewhere, expect single-tenant / working-renter base with shorter leases.
- Market conditions: 13 active listings in the ZIP; 65 units permitted in Henry County in 2024 (0 in 5+ unit buildings).
Forward outlook
- In year one you build about $936 of equity ($864 loan paydown + $72 appreciation (0.1% local appreciation)).
- At projected returns (0.1% appreciation + 3.0% rent growth), your $35k cash investment doubles in ~10 years — after that, you're playing with house money.
Negotiation context
- Only 1 days on market — expect competitive offers; lowballing is unlikely to land.
Risks & watch-outs
- Watch-outs: built in 1957 — expect roof / HVAC / electrical / plumbing capex.
- Climate carrying-cost: extreme-heat days projected 7→21/yr by 2055 (HVAC capex compounding) — expect insurance premiums to compound above CPI over the hold.
Questions for the listing agent
- Built in 1957 — when were the roof, HVAC, electrical panel, plumbing, and water heater last replaced?
- Is there a deadline driving the sale (1031 exchange, divorce, estate, relocation)? That informs how much negotiation room exists.
- Schools are D-rated, which usually means shorter tenancies and higher turnover. Who's the typical renter profile here, and what's been the actual vacancy rate?
- The area grade is low — what's the realistic commute time and amenity access for the typical tenant pool here? Any planned neighborhood developments (good or bad) we should know about?
- What's the average days-on-market for RENTAL listings here right now (not sales)? A rising rental-DOM trend means longer vacancies and softer asking-rent achievability than the comps imply.
- What's the recent tenant-quality profile in this submarket — average credit score on applications, eviction rate, late-payment / NSF rate, and stable-employment percentage? A property-management company in the area should have these aggregated.
- How much new for-sale + rental construction is in the pipeline within 1–3 miles? Heavy new supply typically softens prices + rents 12–24 months out; constrained supply supports both.
Investment metrics
- 1% rule
- 0.89% ✗
- Cap rate
- 7.08%
- Cash-on-cash
- 2.80%
- DSCR
- 1.12
- GRM
- 9.4
CMA / ARV
No comps found within radius.
Projected returns pro-forma
0.06% appreciation · 3.0% rent growth · sell at horizon
- IRR
- 1.1%
- Equity multiple
- 1.05×
- Total profit
- $1,857
- Equity at exit
- $36,657
- IRR
- 6.5%
- Equity multiple
- 1.71×
- Total profit
- $24,990
- Equity at exit
- $44,353
Cash invested: $35,000 (down + closing). Projections, not guarantees.
Landlord ↔ Tenant lean methodology
- Overall (STATE)
- 83 Strongly Landlord-Friendly
- State Kentucky
- 83 Strongly Landlord-Friendly · R+16
- County
- — inherits STATE
- City
- — inherits STATE
ZIP-level market 40050
- Home prices YoY
- 0.0%
- Active inventory
- 13
- Price-to-rent
- 9.4×
Monthly cashflow live
- Estimated rent
- $1,108 medium interval (Pro) →
- Mortgage (P&I)
- −$656
- Tax from tax record
- −$86 /mo · $1,036/yr
- Insurance
- −$52
- HOA
- −$0
- Vacancy / Maint / Mgmt
- −$233
- Net cashflow
- $82
Break-even live
UW: 25.0% down · 7.5% · 30yr · 1.5% tax · 5.0% vac · 8.0% maint · 8.0% mgmt
Financing live
Cash to close
- Down payment
- $31,250
- Closing costs
- $3,750
- Reserves months
- —
- Total cash needed
- —
Loan-product check · same deal, 3 products live
Conventional
25% down · 7.5% · 30yr
- Down + closing
- —
- Monthly P&I
- —
- Monthly cashflow
- —
- DSCR
- —
- Eligible?
- —
Personal DTI + credit; lowest rate.
DSCR
20% down · 8.5% · 30yr
- Down + closing
- —
- Monthly P&I
- —
- Monthly cashflow
- —
- DSCR
- —
- Eligible?
- —
No personal income docs; deal must DSCR.
Hard money
10% down · 12.0% · 12mo
- Down + closing
- —
- Monthly P&I
- —
- Monthly cashflow
- —
- DSCR
- —
- Eligible?
- —
Short-term bridge; refi at stabilization.
Listing history 2 events
-
2026-05-29status Pending
-
2026-05-29$125,000 Active
ⓘ Source: listings_history table (triggers on properties + properties_extension) + one-shot
backfill from property_details.listing_events for pre-trigger history.
Tax reassessment forecast KY · Resets to sale price
- Current annual tax
- $1,036 · $86/mo
- Projected year-2 tax
- $1,075 · $90/mo
- Expected delta
- +$39/yr (+$3/mo · 3.8%)
ⓘ Screening estimate from a state-policy table — verify with the county assessor before closing.
Climate risk First Street
- Flood 1/10 Low FEMA zone X (unshaded) · 0% chance over 30 yrs
- Wildfire 3/10 Moderate
- Heat 5/10 Major 7 d/yr ≥103°F today · 21 d/yr by 30 yrs out
- Wind 2/10 Low 2% chance of damaging wind over 30 yrs
- Air quality 2/10 Low 1 unhealthy d/yr today · 2 by 30 yrs out
Nearby sold comps map
Loading sold comps map…
Walkable amenities ~0.75 mi
Loading nearby amenities…
Taxation est. · year 1
- Rental income
- $13,300
- − Mortgage interest
- −$7,002
- − Property taxes
- −$1,036
- − Insurance
- −$625
- − Repairs & maintenance
- −$1,064
- − Management
- −$1,064
- − Depreciation
- −$3,636
- Taxable loss
- −$1,127
- Est. tax savings @ 24.0%
- +$271
- After-tax cash flow
- $1,250/yr
For passive investors: Depreciation is non-cash, so a rental often shows a tax loss while cash-flowing — sheltering income. Rental losses are passive: they offset passive income freely, and up to $25,000/yr can offset ordinary (W-2) income if you actively participate and your MAGI is under $100k (phasing out to $0 by $150k); unused losses carry forward. On sale, claimed depreciation is recaptured at up to 25%, and gains may owe capital-gains tax (a 1031 exchange can defer both). Figures are a year-1 estimate at your 24.0% rate — not tax advice; consult a CPA.
Schools (NCES district)
- District
- Henry County
- NCES district ID
- 2102760
- Math proficiency
- 30% ▼ -12.00%
- Reading proficiency
- 38% ▼ -9.00%
- Median HH income
- $47,899
- Composite
- 29.29/100
- National rank
- #6557
- State rank
- #68 of 165 in KY
Livability — New Castle
- Score
- 60/100
- State rank
- #385
- US rank
- #18654
Category grades
Schools grade is shown separately in the Schools card above.
Census & demographics
- Census place
- New Castle, KY
- City population
- 16
- Population (ZIP)
- 1,884
Population outlook (Henry County) Hauer SSP2
- Today (2025)
- 16,009 people
- By 2030
- 16,127 · +0.7%
- By 2040
- 16,109 · +0.6%
- By 2050
- 15,749 · -1.6%
- By 2075
- 14,586 · -8.9%
- By 2100
- 12,181 · -23.9%
Race, ethnicity, and origin ACS 2023
- Neighborhood character
- Predominantly White (92%)
- Race & ethnicity
- White 92% Asian 4% Black 2% Hispanic / Latino 2%
- Common ancestry
- Slovak 4% Italian 2% Scottish 1%
- Foreign-born
- 2% · South Korea
- Languages at home
- 95% English-only · Korean 3% Spanish 1%
Political lean MEDSL · Henry
- 2024 margin
- Solid R (+52.5) · D 23.0% · R 75.5% · Other 1.5%
- 2008→2024 swing
- -32.9pp toward R · 2008: -19.6pp · 2024: -52.5pp
- All cycles
- 2024: R+52.5 2020: R+45.6 2016: R+43.6 2012: R+21.4 2008: R+19.6
Not yet ingested
- Civics
- —
Market trends
- HPI YoY
- ▲ 0.06%
- Current HPI
- 278.4709
- Rent YoY
- —
- Metro
- —
- State GDP YoY
- ▲ 1.81%
- F500 in state
- 4
Industry mix (Fortune 500 HQ in KY)
| Industry | F500 HQs | Revenue |
|---|---|---|
| Healthcare | 1 | $118B |
|
||
| Food / Beverage | 1 | $7B |
|
||
Price history
2 events — show timeline
- 2026-05-29 Pending — Metro Search MLS
- 2026-05-29 Listed $125,000 Metro Search MLS
Property tax history
+4.0%/yrLatest (2025): $1,036 · +0.9% YoY. Source: county tax records.
Cash-flow waterfall
monthlySold comps — $/sqft
last 12 mo · ≤1 miLoading sold comps…